REVIEW 4 major objections 6 minor 1 cited by
The population of NuSTAR Black Hole X-ray Binaries
T0 review · 4 major / 6 minor · reviewed 2026-08-07 · deepseek-v4-flash
Pith's one-line read X-ray binary black holes spin near maximum, a uniform NuSTAR sample shows.
desk verdict A valuable data release and transparent exploratory analysis, but the headline beta-distribution claim is under-specified and the XB/GW incompatibility is not yet demonstrated. read the letter →
The pith
A machine-rendered reading of the paper's core claim, the machinery that carries it, and where it could break.
The reading
What carries the argument
The load-bearing object is the uniform sample itself: 245 NuSTAR spectra of 36 accreting black hole X-ray binaries, each fit with six flavors of the relxill relativistic-reflection model, selected by deviance information criterion and processed through MCMC posteriors. The named identity carrying the population claim is the $\beta$ distribution P(a) = Gamma($\alpha$+$\beta$)/(Gamma($\alpha$)Gamma($\beta$)) $a^{{alpha-1}}$(1-a)^{$\beta$-1} with $\alpha$ = 5.66 and $\beta$ = 1.09, which summarizes the observed spin sample. The comparison that makes the claim consequential is the same Bayesian-inference procedure applied to the GWTC-3 black-hole merger spins, yielding two distributions that barely overlap.
What would settle it
Take one high-quality NuSTAR spectrum from the selected Eddington range, leave the inner disk radius free instead of fixing it to the ISCO, and check whether the best fit prefers a radius significantly outside the ISCO; if it does, that spin is biased low and the beta(5.66, 1.09) distribution is not a clean natal-spin measurement. A second check would be to re-fit the faint spectra that currently yield low spin with absorption-line components and see whether the low-spin solutions disappear.
Extended reading notes
Core claim
The authors claim that the observed spin distribution of the 36 X-ray binary black holes is a $\beta$ distribution, P(a) proportional to $a^{{alpha-1}}$(1-a)^{$\beta$-1} with $\alpha$ = 5.66 and $\beta$ = 1.09, peaking near a approximately 0.97 and incompatible with the spin distribution inferred from GWTC-3, whose mode is around 0.18. The incompatibility is presented as the first such comparison built from X-ray measurements made with one uniform pipeline, and therefore not an artifact of mixing different model assumptions. The paper further claims that high spins in systems with short orbital periods exceed the maximum spin that accretion can deliver, so these black holes must have formed rotating near their maximum rate; that spin-measurement precision increases with black hole mass and decreases with distance and with lower reflection counts; and that low or negative individual spin fits are confined to faint spectra with low reflection strength, where the model cannot distinguish high-spin/high-emissivity from low-spin/low-emissivity solutions.
Load-bearing premise
The analysis assumes that in every selected observation the accretion disk reaches the innermost stable circular orbit, so the fitted inner radius can be read directly as spin; if some disks are truncated, those spins are biased low and the beta distribution would not describe true natal spins.
Editorial extensions
If this is right
- If the beta distribution is correct, most stellar-mass black holes in X-ray binaries are born with near-maximal rotation, and supernova and binary-evolution models must reproduce that angular momentum before any accretion occurs.
- Accretion spin-up cannot explain the fastest rotators at short orbital periods, so mass transfer is not the origin of the high spins; the observed values are close to natal values.
- The X-ray and gravitational-wave spin distributions are genuinely different, or at least are not reconciled by uniform X-ray systematics, motivating searches for selection effects and formation-channel differences.
- Spin measurements will be most precise for massive, nearby, bright systems with high reflection counts, while the low-spin tail of the distribution should be treated cautiously because it comes from faint spectra.
- The published 245-fit dataset becomes a community resource for testing model degeneracies and future parameter correlations.
Reading between the lines
- If the same pipeline were applied to a sample selected without the Eddington-fraction cut, or to AGN spins measured by reflection, the inferred beta parameters might shift, which would test whether the high-spin peak is a property of X-ray binaries or of the reflection method itself.
- The tentative spin-emissivity degeneracy suggests that some low-spin measurements are algorithmic artifacts of faint spectra; high-resolution microcalorimeter spectra could distinguish real low spins from unmodeled absorption features.
- A physical consequence the authors leave implicit is that if most X-ray binary black holes are born spinning fast while most merging black holes appear to spin slowly, the two populations may trace different mass or metallicity channels, not just different measurement techniques.
- The density experiments imply that fitting with densities above log n = 20 lowers Fe abundance and inclination but not spin; extending this to a full sample could turn the bimodal Fe abundance into a diagnostic of unmodeled disk density.
Editorial analysis
A structured set of objections, weighed in public.
Referee Report
Summary. Using the 245 NuSTAR spectra of 36 BH X-ray binaries previously analyzed in Draghis et al. (2024), this paper presents a population-level study of measured spins and spectral-fit parameters. It reports Spearman correlations between spin uncertainty and system properties (mass, distance, inclination), identifies parameter degeneracies in relativistic reflection fits (e.g., q1--a, R--Gamma, log xi--Gamma), and fits the observed XB spin distribution with a beta distribution alpha=5.66, beta=1.09, concluding that the XB distribution is incompatible with the low-spin distribution inferred from GWTC-3 and that most XB BHs must have formed with high natal spins. The full fitting table is released on Zenodo.
Significance. The paper's main value is as a resource: a uniformly reduced, publicly released table of 245 NuSTAR spectral fits and spin measurements, plus a set of cautionary examples about low-SNR degeneracies (low-q1/low-a vs high-q1/high-a) and the influence of absorption lines and disk density. The comparison of measured spins with the Fragos & McClintock (2015) accretion-spinup ceiling is an interesting and falsifiable argument for high natal spins. However, the two headline population claims--the beta-distribution characterization and the XB/GW incompatibility--are not yet established because the statistical inference is under-specified and the input sample is not independent. The paper is honest about many limitations and does not overstate the exploratory correlation analysis, but the central 'incompatible with GWTC-3' statement needs a properly specified and reproducible hierarchical fit before it can carry the weight placed on it.
major comments (4)
- [Section 3.1, Eq. (1)] The Bayesian inference that produces alpha=5.66 and beta=1.09 is not described. The text does not state the likelihood, the prior on (alpha, beta), the input data (36 source-level values from Table 1, 36 full posteriors, or the 245 per-spectrum fits), how asymmetric 1-sigma intervals are propagated, or how the posterior draws shown as thin blue lines in Figure 4 are generated. The beta distribution is only defined on [0,1], whereas individual fits in Figure 6 extend to negative a, so the treatment of negative/retrograde values must be stated. Without these details, and without credible intervals or a goodness-of-fit statistic for alpha and beta, the claim that the XB distribution 'is well approximated' by beta(5.66,1.09) cannot be evaluated or reproduced; this is the load-bearing step for the XB/GW comparison.
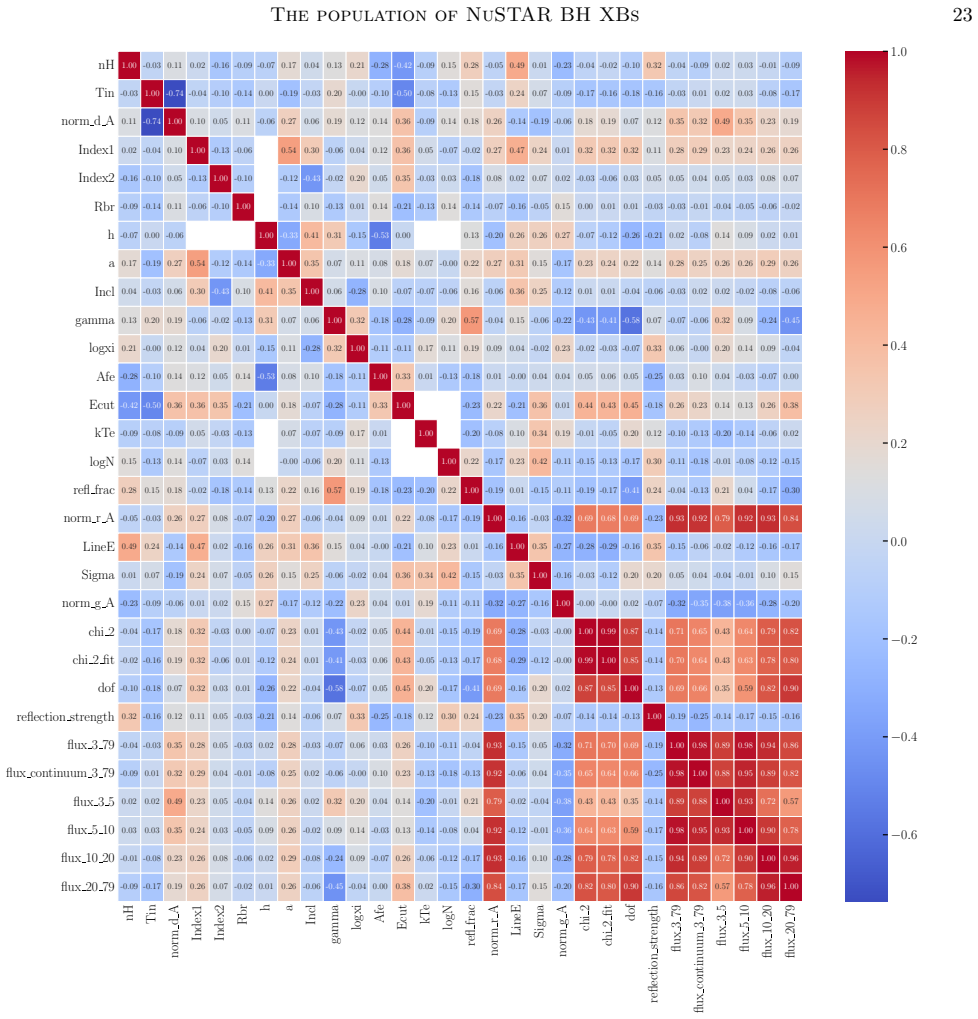
- [Section 4, Figures 6 and 8] The correlation analysis treats the 245 spectra as independent samples even though they are repeated observations of 36 sources. The quoted Spearman coefficients and their +/- uncertainties therefore ignore clustering; for example, Figure 8 panels (e) and (f) report rho=0.32+/-0.01 and 0.57+/-0.01 on 245 points, while Figure 9 shows clear source-level structure in the same parameter combinations. A source-resampling or mixed-effects analysis is needed to establish whether the trends are within-source or between-source and whether the reported significance survives. The same issue applies to the spin-uncertainty correlations in Figure 3, although those use one value per source.
- [Section 3.1, Figure 4] The paper states that the two distributions are 'clearly distinct', but the XB distribution is explicitly the observed distribution with no selection-function correction, while the GWTC-3 distribution is selection-corrected. This asymmetry is acknowledged in the text but not accounted for in the conclusion. Because the XB sample is selected by outburst activity, Eddington fraction, detection of reflection, and successful spin constraint, the observed high-spin excess could be partly a selection artifact. The authors should either model the XB selection function or restrict the claim to the observed sample with the selection caveat carried through the abstract and conclusions.
- [Sections 2 and 4.1] The assumption that the inner disk radius equals the ISCO in every fitted observation is the physical link between the reflection fits and the spin a. The defense in Section 4.1, based on hardness-intensity diagrams for nine sources (Figure 10), is indirect and relies on the absence of an obvious hardness trend in the spin constraints rather than a direct test of Rin/ISCO. If some hard-state disks are truncated, the inferred spins are biased low, and the beta distribution in Eq. (1) describes biased measurements rather than true spins. A direct test, such as letting Rin vary in a subset of spectra and quoting the change in fit statistic or the posterior on Rin/ISCO, would make the population claim much stronger.
minor comments (6)
- [Eq. (1)] The definition of the gamma function contains a typo: 'r^{-t}' should be 'e^{-t}'.
- [Sections 2 and 4.6] Section 2 states that 36 of the 245 spectra required the zxipcf component for complex obscuration, while Section 4.6 states that 96 spectra required an absorption Gaussian line and 149 did not; these numbers need to be reconciled or explicitly described as different diagnostics.
- [Section 3.1, Figure 4] The phrase 'modes and +/-1 sigma of the mean distributions' is confusing; please specify whether the vertical lines are the mode and central credible interval of the population distribution itself.
- [Figures 6 and 8] Several panels use the placeholder symbol 'square' as the y-axis label (e.g., Figure 8 panels e, f, i, o); these should be replaced with the actual parameter name (Gamma or another label).
- [Table 1 footnote] The footnote marker '3 represents an inclination estimate based on dips' should be typeset as a superscript to match the table entries and to avoid confusion with the numeric value 3.
- [Figure 2, panel (g)] The caption for the theoretical curves from Fragos & McClintock (2015) does not state the assumed accretion efficiency or spin-up prescription; adding one sentence would help readers interpret the comparison.
Circularity Check
No significant circularity: the beta distribution is an explicitly fitted description of the authors' own published spin measurements, not a prediction derived from itself, and the GW comparison uses an external catalog.
full rationale
The paper's central quantitative claim is that the observed NuSTAR reflection-measured spins of 36 X-ray binaries are described by a beta distribution with alpha=5.66 and beta=1.09 (Section 3.1, Eq. 1). This is presented explicitly as a Bayesian characterization of the observed sample, not as a prediction generated from first principles. The input data are the 36 source-level spin measurements published in Draghis et al. (2024), and those measurements were obtained by spectral fitting with relxill models; the population-level beta parameters are then fit to those measurements. That is an empirical summary, and no equation in the paper reduces to another by construction. The comparison to gravitational-wave spins uses the external GWTC-3 catalog, so the claimed incompatibility is an external benchmark rather than a self-referential statement. The self-citations to Draghis et al. (2023b, 2023c, 2024) are legitimate reuse of the authors' own published data and methods; the spin table is accompanied by a Zenodo release (doi:10.5281/zenodo.15801174), making the input data independently accessible, and the cited prior work contains the detailed fitting and MCMC procedures. The ISCO assumption (Section 2, defended in Section 4.1) is a modeling assumption that can bias spin values if disks are truncated, but it is not a circular argument: the spins are fitted from spectra, not assumed by the population analysis. The remaining concerns about Section 3.1 are statistical transparency issues (e.g., whether the population likelihood uses 36 source-level posteriors or per-spectrum values, and how asymmetric credible intervals are propagated), which affect robustness and reproducibility but do not constitute circularity. Accordingly, the analysis is self-contained with respect to its own derivation chain, and the only mild concern is the heavy reliance on the authors' own prior dataset, which is published and reproducible rather than load-bearing in a circular sense.
Assumptions & free parameters
free parameters (3)
- alpha (beta distribution shape) =
5.66
- beta (beta distribution shape) =
1.09
- Eddington fraction selection window =
10^-3 to 0.3
assumptions (4)
- domain assumption The accretion disk extends to the ISCO during the selected observations.
- domain assumption The relxill family of reflection models accurately describes the reflected spectra and the relevant parameter relationships.
- domain assumption Literature values for BH masses, distances, companion masses, and independent inclinations are accurate enough for the correlation analysis.
- ad hoc to paper The 245 spectra can be treated as independent samples for correlation analysis.
Cite this review
Pith. "Pith review of The population of NuSTAR Black Hole X-ray Binaries." pith.science (2026). https://pith.science/paper/55NOSGV2
@misc{pith2026250612121,
  author       = {Pith},
  title        = {Pith review of: The population of NuSTAR Black Hole X-ray Binaries},
  year         = {2026},
  howpublished = {\url{https://pith.science/paper/55NOSGV2}},
  note         = {Machine review of arXiv:2506.12121}
}
abstract
The spin of a black hole (BH) encodes information about its formation and evolution history. Yet the understanding of the distribution of BH spins in X-ray binaries (XBs), of the models used to measure spin, and of their impact on systematic uncertainties remains incomplete. In this work, we expand on previous analyses of the entire NuSTAR archive of accreting BH XBs. Prior work compiled a sample of 245 spectral fits using the relativistic reflection method for NuSTAR observations of 36 BH systems. Here, we aim to probe two aspects: the connection between BH spin and binary system properties, and the relationships between parameters in the spectral fits. We identify moderate negative correlations between spin uncertainty and both BH mass and system inclination, and a moderate positive correlation with distance. We also point out tentative multidimensional degeneracies between inclination, disk density, Fe abundance, ionization, and the presence or absence of absorption features from ionized outflows linked to disk winds. Lastly, we provide a comprehensive view of the observed distribution of BH spins in XBs, in comparison to spins inferred from gravitational waves. We find that the distribution of BH spins in XBs can be described by a beta distribution with $\alpha=5.66$ and $\beta=1.09$. This data set is highly complex, and the analysis presented here does not fully explore all potential parameter correlations. We make the full data set available in Zenodo to the community to encourage further exploration.
Figures


Figures from the paper (10 more)





Forward citations
Cited by 1 Pith paper
-
Spin Constraints on 4U 1630-47 via combined Continuum Fitting and Reflection methods: a comparative study using Frequentist and Bayesian statistics
Combined continuum fitting and reflection modeling of NICER/NuSTAR spectra yield spin a*=0.93(+0.05,-0.04), mass about 9 solar masses, distance about 10.5 kpc, and inclination about 54 degrees for 4U 1630-47.
Reference graph
Works this paper leans on
-
[1]
Abbott, R., Abbott, T. D., Acernese, F., et al. 2023, Physical Review X, 13, 011048, doi: 10.1103/PhysRevX.13.011048
-
[2]
Abdulghani, Y., Lohfink, A. M., & Chauhan, J. 2024, MNRAS, 530, 424, doi: 10.1093/mnras/stae767
-
[3]
2017, arXiv e-prints, arXiv:1702.00786, doi: 10.48550/arXiv.1702.00786
Amaro-Seoane, P., Audley, H., Babak, S., et al. 2017, arXiv e-prints, arXiv:1702.00786, doi: 10.48550/arXiv.1702.00786
-
[4]
2022, MNRAS, 511, 176, doi: 10.1093/mnras/stab3776 24 Draghis et al
Antoni, A., & Quataert, E. 2022, MNRAS, 511, 176, doi: 10.1093/mnras/stab3776 24 Draghis et al
-
[5]
Arnaud, K. A. 1996, in Astronomical Society of the Pacific Conference Series, Vol. 101, Astronomical Data Analysis Software and Systems V, ed. G. H. Jacoby & J. Barnes, 17 Astropy Collaboration, Robitaille, T. P., Tollerud, E. J., et al. 2013, A&A, 558, A33, doi: 10.1051/0004-6361/201322068 Astropy Collaboration, Price-Whelan, A. M., Sip˝ ocz, B. M., et a...
-
[6]
Atri, P., Miller-Jones, J. C. A., Bahramian, A., et al. 2020, MNRAS, 493, L81, doi: 10.1093/mnrasl/slaa010
-
[7]
Bardeen, J. M., & Petterson, J. A. 1975, ApJL, 195, L65, doi: 10.1086/181711
doi:10.1086/181711 1975
-
[8]
2023, ApJ, 944, 165, doi: 10.3847/1538-4357/acaeaf
Barillier, E., Grinberg, V., Horn, D., et al. 2023, ApJ, 944, 165, doi: 10.3847/1538-4357/acaeaf
Show all 108 references
-
[9]
2022, ApJ, 925, 69, doi: 10.3847/1538-4357/ac375a
Belczynski, K., Romagnolo, A., Olejak, A., et al. 2022, ApJ, 925, 69, doi: 10.3847/1538-4357/ac375a
2022 doi
-
[10]
W., & Reynolds, C
Brenneman, L. W., & Reynolds, C. S. 2006, ApJ, 652, 1028, doi: 10.1086/508146
2006 doi
- [11]
-
[12]
2019, MNRAS, 488, 1356, doi: 10.1093/mnras/stz1793
Casares, J., Mu˜ noz-Darias, T., Mata S´ anchez, D., et al. 2019, MNRAS, 488, 1356, doi: 10.1093/mnras/stz1793
2019 doi
-
[13]
A., Zurita, C., et al
Casares, J., Orosz, J. A., Zurita, C., et al. 2009, ApJS, 181, 238, doi: 10.1088/0067-0049/181/1/238
2009 doi
-
[14]
V., Torres, M
Casares, J., Yanes-Rizo, I. V., Torres, M. A. P., et al. 2023, MNRAS, 526, 5209, doi: 10.1093/mnras/stad3068
2023 doi
-
[15]
P., & Israel, G
Chaty, S., Mignani, R. P., & Israel, G. L. 2006, MNRAS, 365, 1387, doi: 10.1111/j.1365-2966.2005.09838.x
2006
-
[16]
Chauhan, J., Miller-Jones, J. C. A., Anderson, G. E., et al. 2019, MNRAS, 488, L129, doi: 10.1093/mnrasl/slz113
2019 doi
-
[17]
Connors, R. M. T., Tomsick, J. A., Draghis, P., et al. 2024, Frontiers in Astronomy and Space Sciences, 10, 1292682, doi: 10.3389/fspas.2023.1292682
2024
-
[18]
M., Casares, J., Mu˜ noz-Darias, T., et al
Corral-Santana, J. M., Casares, J., Mu˜ noz-Darias, T., et al. 2016, A&A, 587, A61, doi: 10.1051/0004-6361/201527130
2016 doi
-
[19]
2025, Nature Astronomy, 9, 36, doi: 10.1038/s41550-024-02416-3
Cruise, M., Guainazzi, M., Aird, J., et al. 2025, Nature Astronomy, 9, 36, doi: 10.1038/s41550-024-02416-3
2025 doi
-
[20]
2014, MNRAS, 444, L100, doi: 10.1093/mnrasl/slu125
Wilms, J. 2014, MNRAS, 444, L100, doi: 10.1093/mnrasl/slu125
2014 doi
-
[21]
A., Miller, J
Draghis, P. A., Miller, J. M., Brumback, M. C., et al. 2023a, ApJ, 954, 62, doi: 10.3847/1538-4357/ace7b3
-
[22]
A., Miller, J
Draghis, P. A., Miller, J. M., Cackett, E. M., et al. 2020, ApJ, 900, 78, doi: 10.3847/1538-4357/aba2ec
2020 doi
-
[23]
A., Miller, J
Draghis, P. A., Miller, J. M., Costantini, E., et al. 2024, ApJ, 969, 40, doi: 10.3847/1538-4357/ad43ea
2024 doi
-
[24]
A., Miller, J
Draghis, P. A., Miller, J. M., Zoghbi, A., et al. 2021, ApJ, 920, 88, doi: 10.3847/1538-4357/ac1270 —. 2023b, ApJ, 946, 19, doi: 10.3847/1538-4357/acafe7
2021 doi
-
[25]
A., Balakrishnan, M., Miller, J
Draghis, P. A., Balakrishnan, M., Miller, J. M., et al. 2023c, ApJ, 947, 39, doi: 10.3847/1538-4357/acc1c8
-
[26]
C., Zoghbi, A., Ross, R
Fabian, A. C., Zoghbi, A., Ross, R. R., et al. 2009, Nature, 459, 540, doi: 10.1038/nature08007
2009 doi
-
[27]
C., Buisson, D
Fabian, A. C., Buisson, D. J., Kosec, P., et al. 2020, MNRAS, 493, 5389, doi: 10.1093/mnras/staa564
2020 doi
-
[28]
2022, ApJL, 929, L26, doi: 10.3847/2041-8213/ac64a5
Fishbach, M., & Kalogera, V. 2022, ApJL, 929, L26, doi: 10.3847/2041-8213/ac64a5
2022 doi
-
[29]
2016, The Journal of Open Source Software, 1, 24, doi: 10.21105/joss.00024
Foreman-Mackey, D. 2016, The Journal of Open Source Software, 1, 24, doi: 10.21105/joss.00024
2016 doi
-
[30]
W., Lang, D., & Goodman, J
Foreman-Mackey, D., Hogg, D. W., Lang, D., & Goodman, J. 2013, PASP, 125, 306, doi: 10.1086/670067
2013 doi
- [31]
-
[32]
C., Wilkins, D
Gallo, L. C., Wilkins, D. R., Bonson, K., et al. 2015, MNRAS, 446, 633, doi: 10.1093/mnras/stu2108
2015 doi
-
[33]
F., Shapiro, S
Gammie, C. F., Shapiro, S. L., & McKinney, J. C. 2004, ApJ, 602, 312, doi: 10.1086/380996 Garc ´ ıa, J., Dauser, T., Lohfink, A., et al. 2014, ApJ, 782, 76, doi: 10.1088/0004-637X/782/2/76
2004 doi
-
[34]
Ghodla, S., & Eldridge, J. J. 2024, MNRAS, 534, 1868, doi: 10.1093/mnras/stae2198
2024 doi
-
[35]
E., Liu, J., et al
Gou, L., McClintock, J. E., Liu, J., et al. 2009, ApJ, 701, 1076, doi: 10.1088/0004-637X/701/2/1076
2009 doi
- [36]
-
[37]
R., Millman, K
Harris, C. R., Millman, K. J., van der Walt, S. J., et al. 2020, Nature, 585, 357, doi: 10.1038/s41586-020-2649-2
2020 doi
-
[38]
A., Craig, W
Harrison, F. A., Craig, W. W., Christensen, F. E., et al. 2013, ApJ, 770, 103, doi: 10.1088/0004-637X/770/2/103
2013 doi
- [39]
-
[40]
G., Torres, M
Heida, M., Jonker, P. G., Torres, M. A. P., & Chiavassa, A. 2017, ApJ, 846, 132, doi: 10.3847/1538-4357/aa85df
2017 doi
- [41]
-
[42]
Hunter, J. D. 2007, Computing in Science & Engineering, 9, 90, doi: 10.1109/MCSE.2007.55
2007 doi
-
[43]
V., & Yungelson, L
Iben, Icko, J., Tutukov, A. V., & Yungelson, L. R. 1995, ApJS, 100, 217, doi: 10.1086/192217 Ivezi´ c,ˇZ., Kahn, S. M., Tyson, J. A., et al. 2019, ApJ, 873, 111, doi: 10.3847/1538-4357/ab042c The population of NuSTAR BH XBs 25
1995 doi
-
[44]
2015, ApJ, 807, 108, doi: 10.1088/0004-637X/807/1/108
Iyer, N., Nandi, A., & Mandal, S. 2015, ApJ, 807, 108, doi: 10.1088/0004-637X/807/1/108
2015 doi
-
[45]
K., et al
Jana, A., Naik, S., Jaisawal, G. K., et al. 2022, MNRAS, 511, 3922, doi: 10.1093/mnras/stac315
2022 doi
-
[46]
K., Naik, S., et al
Jana, A., Jaisawal, G. K., Naik, S., et al. 2021, Research in Astronomy and Astrophysics, 21, 125, doi: 10.1088/1674-4527/21/5/125
2021 doi
-
[47]
G., Kaur, K., Stone, N., & Torres, M
Jonker, P. G., Kaur, K., Stone, N., & Torres, M. A. P. 2021, ApJ, 921, 131, doi: 10.3847/1538-4357/ac2839
2021 doi
-
[48]
S., Nardini, E., & Risaliti, G
Kammoun, E. S., Nardini, E., & Risaliti, G. 2018, A&A, 614, A44, doi: 10.1051/0004-6361/201732377
2018 doi
-
[49]
L., Brenneman, L
Keck, M. L., Brenneman, L. W., Ballantyne, D. R., et al. 2015, ApJ, 806, 149, doi: 10.1088/0004-637X/806/2/149
2015 doi
-
[50]
S., & Robinson, E
Khargharia, J., Froning, C. S., & Robinson, E. L. 2010, ApJ, 716, 1105, doi: 10.1088/0004-637X/716/2/1105
2010 doi
-
[51]
R., & Kolb, U
King, A. R., & Kolb, U. 1999, MNRAS, 305, 654, doi: 10.1046/j.1365-8711.1999.02482.x
1999
-
[52]
2022, Science, 378, 650, doi: 10.1126/science.add5399
Krawczynski, H., Muleri, F., Dovˇ ciak, M., et al. 2022, Science, 378, 650, doi: 10.1126/science.add5399
2022 doi
-
[53]
D., Predehl, P., et al
Lamer, G., Schwope, A. D., Predehl, P., et al. 2021, A&A, 647, A7, doi: 10.1051/0004-6361/202039757
2021 doi
-
[54]
2024, ApJ, 967, 35, doi: 10.3847/1538-4357/ad3c2b
Liao, J., Ghasemi-Nodehi, M., Cui, L., et al. 2024, ApJ, 967, 35, doi: 10.3847/1538-4357/ad3c2b
2024 doi
-
[55]
B., Mirzaev, T., et al
Liu, H., Abdikamalov, A. B., Mirzaev, T., et al. 2025, MNRAS, 536, 2594, doi: 10.1093/mnras/stae2722
2025 doi
-
[56]
MacDonald, R. K. D., Bailyn, C. D., Buxton, M., et al. 2014, ApJ, 784, 2, doi: 10.1088/0004-637X/784/1/2
2014 doi
-
[57]
2020, JCAP, 2020, 050, doi: 10.1088/1475-7516/2020/03/050
Maggiore, M., Van Den Broeck, C., Bartolo, N., et al. 2020, JCAP, 2020, 050, doi: 10.1088/1475-7516/2020/03/050
2020 doi
-
[58]
2024, A&A, 684, A95, doi: 10.1051/0004-6361/202348277
Marra, L., Brigitte, M., Rodriguez Cavero, N., et al. 2024, A&A, 684, A95, doi: 10.1051/0004-6361/202348277
2024 doi
-
[59]
2010, in Proceedings of the 9th Python in Science Conference, ed
McKinney, W. 2010, in Proceedings of the 9th Python in Science Conference, ed. St´ efan van der Walt & Jarrod Millman, 56–61, doi: 10.25080/Majora-92bf1922-00a
2010 doi
-
[60]
M., Raymond, J., Reynolds, C
Miller, J. M., Raymond, J., Reynolds, C. S., et al. 2008, ApJ, 680, 1359, doi: 10.1086/588521
2008 doi
-
[61]
M., Reynolds, C
Miller, J. M., Reynolds, C. S., Fabian, A. C., Miniutti, G., & Gallo, L. C. 2009, ApJ, 697, 900, doi: 10.1088/0004-637X/697/1/900
2009 doi
-
[62]
M., Fabian, A
Miller, J. M., Fabian, A. C., Wijnands, R., et al. 2002, ApJ, 578, 348, doi: 10.1086/342466
2002 doi
-
[63]
M., Raymond, J., Fabian, A
Miller, J. M., Raymond, J., Fabian, A. C., et al. 2016, ApJL, 821, L9, doi: 10.3847/2041-8205/821/1/L9
2016 doi
-
[64]
Miller-Jones, J. C. A. 2008, in Journal of Physics Conference Series, Vol. 131, Journal of Physics Conference Series (IOP), 012057, doi: 10.1088/1742-6596/131/1/012057
2008 doi
-
[65]
Miller-Jones, J. C. A., Jonker, P. G., Dhawan, V., et al. 2009, ApJL, 706, L230, doi: 10.1088/0004-637X/706/2/L230
2009 doi
-
[66]
Miller-Jones, J. C. A., Tetarenko, A. J., Sivakoff, G. R., et al. 2019, Nature, 569, 374, doi: 10.1038/s41586-019-1152-0
2019 doi
-
[67]
Miller-Jones, J. C. A., Bahramian, A., Orosz, J. A., et al. 2021, Science, 371, 1046, doi: 10.1126/science.abb3363
2021 doi
-
[68]
B., et al
Mirzaev, T., Bambi, C., Abdikamalov, A. B., et al. 2024, ApJ, 976, 229, doi: 10.3847/1538-4357/ad8a63
2024 doi
-
[69]
A., Chakrabarti, S
Molla, A. A., Chakrabarti, S. K., Debnath, D., & Mondal, S. 2017, ApJ, 834, 88, doi: 10.3847/1538-4357/834/1/88
2017 doi
-
[70]
2024, MNRAS, 531, 366, doi: 10.1093/mnras/stae1160
Mummery, A., Ingram, A., Davis, S., & Fabian, A. 2024, MNRAS, 531, 366, doi: 10.1093/mnras/stae1160
2024 doi
-
[71]
A., Wilms, J., Pottschmidt, K., et al
Nowak, M. A., Wilms, J., Pottschmidt, K., et al. 2012, ApJ, 744, 107, doi: 10.1088/0004-637X/744/2/107
2012 doi
-
[72]
A., Jain, R
Orosz, J. A., Jain, R. K., Bailyn, C. D., McClintock, J. E., & Remillard, R. A. 1998, ApJ, 499, 375, doi: 10.1086/305620
1998 doi
-
[73]
A., Steiner, J
Orosz, J. A., Steiner, J. F., McClintock, J. E., et al. 2014, ApJ, 794, 154, doi: 10.1088/0004-637X/794/2/154
2014 doi
-
[74]
A., Kuulkers, E., van der Klis, M., et al
Orosz, J. A., Kuulkers, E., van der Klis, M., et al. 2001, ApJ, 555, 489, doi: 10.1086/321442
2001 doi
-
[75]
A., Steeghs, D., McClintock, J
Orosz, J. A., Steeghs, D., McClintock, J. E., et al. 2009, ApJ, 697, 573, doi: 10.1088/0004-637X/697/1/573 pandas development team, T. 2020, pandas-dev/pandas: Pandas, latest, Zenodo, doi: 10.5281/zenodo.3509134
2009 doi
-
[76]
Q., Miller, J
Park, S. Q., Miller, J. M., McClintock, J. E., et al. 2004, ApJ, 610, 378, doi: 10.1086/421511
2004 doi
-
[77]
L., Tomsick, J
Parker, M. L., Tomsick, J. A., Kennea, J. A., et al. 2016, ApJL, 821, L6, doi: 10.3847/2041-8205/821/1/L6
2016 doi
-
[78]
J., McClintock, J
Reid, M. J., McClintock, J. E., Steiner, J. F., et al. 2014, ApJ, 796, 2, doi: 10.1088/0004-637X/796/1/2
2014 doi
- [79]
- [80]
-
[81]
2020b, MNRAS, 491, 417, doi: 10.1093/mnras/stz3022 —
Riaz, S., Ayzenberg, D., Bambi, C., & Nampalliwar, S. 2020b, MNRAS, 491, 417, doi: 10.1093/mnras/stz3022 —. 2020c, ApJ, 895, 61, doi: 10.3847/1538-4357/ab89ab
-
[82]
P., Miller-Jones, J
Rushton, A. P., Miller-Jones, J. C. A., Curran, P. A., et al. 2017, MNRAS, 468, 2788, doi: 10.1093/mnras/stx526
2017 doi
-
[83]
Salvesen, G., & Miller, J. M. 2021, MNRAS, 500, 3640, doi: 10.1093/mnras/staa3325
2021 doi
-
[84]
M., Reis, R
Salvesen, G., Miller, J. M., Reis, R. C., & Begelman, M. C. 2013, MNRAS, 431, 3510, doi: 10.1093/mnras/stt436
2013 doi
-
[85]
A., Bunn, J
Shahbaz, T., Ringwald, F. A., Bunn, J. C., et al. 1994, MNRAS, 271, L10, doi: 10.1093/mnras/271.1.L10
1994 doi
-
[86]
R., Debnath, D., Chatterjee, D., et al
Shang, J. R., Debnath, D., Chatterjee, D., et al. 2019, ApJ, 875, 4, doi: 10.3847/1538-4357/ab0c1e 26 Draghis et al
2019 doi
-
[87]
2021, Research in Astronomy and Astrophysics, 21, 214, doi: 10.1088/1674-4527/21/9/214
Dutta, A. 2021, Research in Astronomy and Astrophysics, 21, 214, doi: 10.1088/1674-4527/21/9/214
2021 doi
-
[88]
1995, ApJ, 445, 780, doi: 10.1086/175740 Sisk-Reyn´ es, J., Reynolds, C
Shimura, T., & Takahara, F. 1995, ApJ, 445, 780, doi: 10.1086/175740 Sisk-Reyn´ es, J., Reynolds, C. S., Matthews, J. H., & Smith, R. N. 2022, MNRAS, 514, 2568, doi: 10.1093/mnras/stac1389
1995 doi
-
[89]
M., Heindl, W
Smith, D. M., Heindl, W. A., & Swank, J. H. 2002, ApJL, 578, L129, doi: 10.1086/344701
2002 doi
-
[90]
2020, MNRAS, 493, 2694, doi: 10.1093/mnras/staa417
Braga, J. 2020, MNRAS, 493, 2694, doi: 10.1093/mnras/staa417
2020 doi
-
[91]
E., Parsons, S
Steeghs, D., McClintock, J. E., Parsons, S. G., et al. 2013, ApJ, 768, 185, doi: 10.1088/0004-637X/768/2/185
2013 doi
-
[92]
F., McClintock, J
Steiner, J. F., McClintock, J. E., Orosz, J. A., et al. 2014, ApJL, 793, L29, doi: 10.1088/2041-8205/793/2/L29
2014 doi
-
[93]
F., McClintock, J
Steiner, J. F., McClintock, J. E., & Reid, M. J. 2012, ApJL, 745, L7, doi: 10.1088/2041-8205/745/1/L7
2012 doi
-
[94]
F., et al
Svoboda, J., Dovˇ ciak, M., Steiner, J. F., et al. 2024, ApJ, 960, 3, doi: 10.3847/1538-4357/ad0842
2024 doi
-
[95]
2020, in Society of Photo-Optical Instrumentation Engineers (SPIE) Conference Series, Vol
Tashiro, M., Maejima, H., Toda, K., et al. 2020, in Society of Photo-Optical Instrumentation Engineers (SPIE) Conference Series, Vol. 11444, Space Telescopes and Instrumentation 2020: Ultraviolet to Gamma Ray, ed. J.-W. A. den Herder, S. Nikzad, & K. Nakazawa, 1144422, doi: 10...
2020 doi
-
[96]
Thorstensen, J. R. 1987, ApJ, 312, 739, doi: 10.1086/164917
1987 doi
-
[97]
2024, in 38th International Cosmic Ray Conference, 745
Tomsick, J., Boggs, S., Zoglauer, A., et al. 2024, in 38th International Cosmic Ray Conference, 745
2024
-
[98]
A., Parker, M
Tomsick, J. A., Parker, M. L., Garc ´ ıa, J. A., et al. 2018, ApJ, 855, 3, doi: 10.3847/1538-4357/aaaab1
2018 doi
-
[99]
Torres, M. A. P., Casares, J., Jim´ enez-Ibarra, F., et al. 2020, ApJL, 893, L37, doi: 10.3847/2041-8213/ab863a
2020 doi
-
[100]
B., Ayzenberg, D., et al
Tripathi, A., Abdikamalov, A. B., Ayzenberg, D., et al. 2021a, ApJ, 907, 31, doi: 10.3847/1538-4357/abccbd
-
[101]
B., Ayzenberg, D., Bambi, C., & Liu, H
Tripathi, A., Abdikamalov, A. B., Ayzenberg, D., Bambi, C., & Liu, H. 2021b, ApJ, 913, 129, doi: 10.3847/1538-4357/abf6c5
-
[102]
E., et al
Virtanen, P., Gommers, R., Oliphant, T. E., et al. 2020, Nature Methods, 17, 261, doi: 10.1038/s41592-019-0686-2
2020 doi
-
[103]
2017, PhRvL, 119, 251103, doi: 10.1103/PhysRevLett.119.251103
Zimmerman, A. 2017, PhRvL, 119, 251103, doi: 10.1103/PhysRevLett.119.251103
2017 doi
-
[104]
2018, PASJ, 70, 67, doi: 10.1093/pasj/psy058
Wang, S., Kawai, N., Shidatsu, M., et al. 2018, PASJ, 70, 67, doi: 10.1093/pasj/psy058
2018 doi
-
[105]
C., Soffitta, P., Baldini, L., et al
Weisskopf, M. C., Soffitta, P., Baldini, L., et al. 2022, Journal of Astronomical Telescopes, Instruments, and Systems, 8, 026002, doi: 10.1117/1.JATIS.8.2.026002
2022 doi
-
[106]
V., Torres, M
Yanes-Rizo, I. V., Torres, M. A. P., Casares, J., et al. 2025, A&A, 694, A119, doi: 10.1051/0004-6361/202452575
2025 doi
-
[107]
R., Burdge, K
Yao, Y., Kulkarni, S. R., Burdge, K. B., et al. 2021, ApJ, 920, 120, doi: 10.3847/1538-4357/ac15f9
2021 doi
-
[108]
A., Banerjee, S., Chand, S., et al
Zdziarski, A. A., Banerjee, S., Chand, S., et al. 2024, ApJ, 962, 101, doi: 10.3847/1538-4357/ad1b60
2024 doi
Reviewed August 7, 2026 · model on record in the stance chip above.
Discussion (0). Continue with ORCID to comment.