REVIEW 3 major objections 5 minor 61 references
The optical constants and grain sizes of interstellar dust measured directly using the dust scattered x-ray halo of GRB 221009A
T0 review · 3 major / 5 minor · reviewed 2026-08-07 · deepseek-v4-flash
Pith's one-line read The expanding X-ray rings of GRB 221009A directly measure the size distribution and complex refractive index of interstellar dust.
desk verdict A careful ADT re-analysis of the GRB 221009A X-ray rings that delivers the first direct measurement of the dust refractive index at X-ray energies; the single-population assumption is the main caveat, but the core result looks solid. read the letter →
The pith
A machine-rendered reading of the paper's core claim, the machinery that carries it, and where it could break.
The reading
What carries the argument
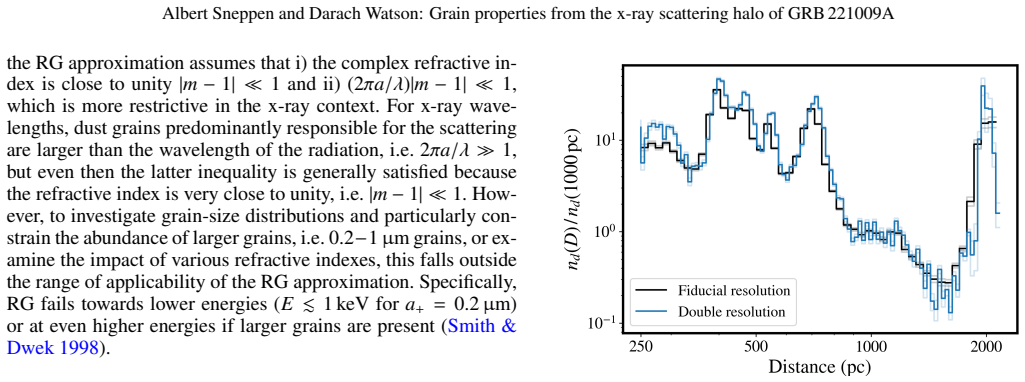
The load-bearing object is the expanding dust-scattered X-ray halo of GRB 221009A, observed as rings by XMM-Newton's EPIC cameras at 2.3--2.9 and 4.7--5.1 days after the burst, with the geometric delay $t_d = D\theta^2/(2c)$ mapping each ring to a dust-sheet distance $D$ and scattering angle $\theta$. The scattering is modeled with anomalous diffraction theory (ADT), whose differential cross-section for a spherical grain of radius $a$ is computed from the phase-shift integral involving $(2\pi a/\lambda)(m-1)$; ADT is valid for $|m-1|\ll1$ and $a/\lambda\gg1$, where the Rayleigh-Gans approximation breaks down. The fit simultaneously adjusts the radial dust density at 50 distance bins, the parameters of an MRN power-law grain size distribution $n(a)\propto a^{-q}$ up to $a_{\max}$, and a power-law parameterization of the refractive index, $k(E)=k_{1\,\mathrm{keV}}E^{-k_\alpha}$ and $1-n(E)=(1-n_{1\,\mathrm{keV}})E^{-n_\alpha}$, using MCMC sampling to map the posterior.
What would settle it
A future X-ray observation with spectral resolution that resolves the oxygen K-edge at 0.532 keV would test the assumed power-law form of $k(E)$: a factor-of-several step in absorption at that energy, unresolved in EPIC data, would show the inferred $k_{1\,\mathrm{keV}}$ and iron fraction are biased by the parameterization. Alternatively, detecting the $\sim0.4\,\mu\mathrm{m}$ grains the model excludes would require seeing their strongly forward-scattered photons at angles below $0.1^\circ$ or at lower energies than the current 0.5 keV threshold.
Extended reading notes
Core claim
The central claim is that the energy- and angle-dependent fading of GRB 221009A's X-ray rings directly constrains the complex refractive index and grain-size distribution of Galactic interstellar dust, without assuming a specific dust composition in advance. Using anomalous diffraction theory rather than the Rayleigh-Gans approximation, which the paper shows is statistically disfavoured and biased, the best fit gives $k_{1\,\mathrm{keV}}=(2.7\pm0.7)\times10^{-4}$ and $1-n_{1\,\mathrm{keV}}=(9\pm2)\times10^{-4}$, with power-law slopes $k_\alpha=3.4\pm0.2$ and $n_\alpha=2.2\pm0.2$ over $0.5$--$4$ keV. These optical constants are close to those of iron-bearing silicates such as MgFeSiO$_4$, and the absorption component requires a substantial iron mass fraction of $35\pm7\%$ when the dust is modeled as a mixture of Fe, MgSiO$_3$, and carbon. The fitted maximum grain radius, $a_{\max}=0.24\pm0.01\,\mu\mathrm{m}$, and the steep MRN slope $q=3.08\pm0.04$ rule out models with abundant $\sim0.4\,\mu\mathrm{m}$ grains, in tension with the astrodust size distribution proposed for the mean Milky Way sight line. As a consistency check, the soft X-ray spectrum of the prompt burst recovered from the rings agrees with the low-energy slope of the directly measured prompt emission.
Load-bearing premise
The analysis assumes that the complex refractive index follows a smooth power law in energy and that one grain composition and size distribution describes all dust layers; if the energy dependence bends near absorption edges or grain properties vary with distance, the inferred $k$, $n$, and iron fraction would shift.
Editorial extensions
If this is right
- Rayleigh-Gans-based analyses of X-ray scattering halos will underestimate the maximum grain size; here the RG fit gives $a_+=0.212\pm0.008\,\mu\mathrm{m}$ while ADT gives $0.235$--$0.24\,\mu\mathrm{m}$, so the systematic bias exceeds the statistical error.
- Dust models that include a significant population of $\sim0.4\,\mu\mathrm{m}$ grains, such as the fiducial astrodust distribution, are strongly disfavored for this sight line, with $\Delta\chi^2\approx1350$ relative to the MRN fit.
- The absorption component of the refractive index requires substantial iron in the scattering grains; mixtures of Fe, MgSiO$_3$, and graphitic carbon give an iron mass fraction of $0.35\pm0.07$, consistent with depletion-based expectations.
- The soft X-ray spectrum of the prompt GRB can be recovered from the rings, matching the low-energy slope of the Band model of the direct emission, which provides an independent check that the grain model is correct.
- X-ray scattering halos can measure the complex refractive index of interstellar dust directly, making bright transients a general tool for dust composition studies.
Reading between the lines
- Because the constraining power comes mostly from photons below 1 keV, a future bright transient observed with higher spectral resolution near the oxygen K-edge at 0.532 keV could test the power-law parameterization and possibly measure the oxygen abundance of dust as a function of grain size.
- The apparent tension between the absorption-favored iron content and the weaker real-part constraint could mean that scattering and absorbing elements live in grains of different sizes; a two-population model with composition varying by size would be a natural next test.
- If the ruling out of $\sim0.4\,\mu\mathrm{m}$ grains holds for other sight lines, models built to reproduce the mean Galactic extinction and polarization may need to treat the large-grain population as spatially variable rather than universal.
Signed reviews
Editorial analysis
A structured set of objections, weighed in public.
Referee Report
Summary. This paper analyzes the expanding X-ray scattering halo of GRB 221009A observed with XMM-Newton at two epochs, modeling the ring brightness as a function of angle, time, and energy using anomalous diffraction theory (ADT). The authors simultaneously fit the radial dust density, a parametric grain size distribution (MRN and variants), and the complex refractive index parametrized as power laws in energy. They report k_1keV = (2.7 ± 0.7)×10^-4 and 1 - n_1keV = (9 ± 2)×10^-4, claim inconsistency with the Rayleigh-Gans approximation, find a maximum grain radius amax = 0.24 ± 0.01 μm, rule out a significant population of ~0.4 μm grains, infer an iron mass fraction of 35 ± 7%, and show that the inferred prompt spectrum is consistent with the low-energy slope of the Band model.
Significance. If the results hold, this is the first direct measurement of the complex refractive index of interstellar dust from a scattering halo, and it demonstrates the importance of ADT over the commonly used Rayleigh-Gans approximation. The model comparisons yield chi2 differences of order 1000, making the qualitative conclusions robust. The work is likely to influence future analyses of X-ray scattering halos and dust property measurements. However, the quantitative central values and error bars are conditional on several simplifying assumptions that are acknowledged but not fully tested.
major comments (3)
- [Sec. 2.2 (Eq. 3) and Sec. 4.4] The factorization n_g(a,D) = n(a)n_d(D) forces a single grain size distribution and composition for all dust sheets, while the ring data probe sheets at distances from ~300 pc to >2 kpc, including prominent sheets near ~400 pc, ~700 pc, and ~2 kpc. If grain properties vary with distance, the quoted global amax, n_1keV, and k_1keV are biased averages and the MCMC error bars do not capture the resulting systematic shift. The paper acknowledges this in Sec. 4.4 ('we do not allow for the different dust sheets to have different dust properties') but does not test it, e.g., by splitting the data by ring distance or allowing independent grain parameters for the strongest sheets. The elevated reduced chi2 of 1.19–1.42 is consistent with such unmodeled spatial variation, and the prompt-spectrum cross-check validates the total energy dependence but not the spatial uniformity.
- [Sec. 2.3.3] The energy dependence of the complex refractive index is assumed to be a power law, k(E) = k_1keV E^{-k_alpha} and 1 - n(E) = (1 - n_1keV) E^{-n_alpha}. The text states that the refractive index 'can be fit independently at each energy bin or with a spectral model', but only the power-law fits are reported. Because the quantitative claims (k_1keV, 1 - n_1keV, and the iron mass fraction) depend on this parametrization, the paper should present the independent per-bin fits, at least for the energy bins with good signal-to-noise, and quantify whether the power-law indices are consistent with them. This is especially relevant given the oxygen K-edge at 0.532 keV, which is acknowledged in Sec. 4.3 but lies inside the fitted band.
- [Sec. 2.3 and Table 3] The best-fit reduced chi2 values of 1.19–1.42 with ~5800 degrees of freedom formally reject the statistical model, as the paper notes. Nevertheless, the quoted 1-sigma uncertainties (e.g., amax = 0.24 ± 0.01 μm, k_1keV = (2.7 ± 0.7) × 10^-4) are the MCMC statistical errors under that rejected model. The paper should either incorporate systematic uncertainties from model assumptions (single grain population, power-law energy dependence, spherical grains, single scattering, factorization) or explicitly state that the error bars are conditional on the model and likely underestimate the true uncertainty. This is load-bearing for the claim of a 'direct measurement'.
minor comments (5)
- [Sec. 2.3] The description of the RG model is ambiguous: 'enforce the RG approximation (e.g. k = 0, n−1∼ 0)' would yield no scattering; please specify the exact optical constants and formula used for the 'MRN RG' row in Table 3.
- [Sec. 2.2.2] There is a duplicate 'the' in 'to examine the the optical constants of the grains'.
- [Sec. 4.3] 'GRB 230307A' appears to be a typo for GRB 221009A, since the cited Tiengo et al. (2023) concerns the latter.
- [Fig. 7] The shaded confidence bands are difficult to distinguish in some print versions; separating the 68% and 95% contours would improve readability.
- [Table 1] The flux ratios (F_0.5 keV etc.) should state whether they are per unit energy or per band; a short note would avoid ambiguity.
Circularity Check
No significant circularity: the optical constants and grain-size parameters are genuine MCMC fits to the halo fading data, and the prompt-spectrum agreement is an external cross-check, not an input.
full rationale
The derivation chain is self-contained. The refractive index (n_1keV, k_1keV, n_alpha, k_alpha), grain-size parameters, and the 50-bin radial dust density are fitted simultaneously to the observed (theta, t_d) halo surface brightness in nine energy bands using anomalous diffraction theory (Eqs. 2-4) with flat priors (Sec. 2.3). The per-band input flux normalizations are also free parameters, so the source spectrum is not an input; Sec. 3.1 states the authors 'choose to leave the analysis agnostic with complete freedom to vary the spectral shape.' The inferred prompt spectrum is therefore a fitted by-product, and its agreement with the externally measured Band-model slope (Lesage et al. 2023) is a genuine cross-check because the Band slope is not imposed on the halo fit. The composition conclusions compare the fitted n(E), k(E) to independent optical constants (Henke et al. 1993; Draine 2003; Draine & Hensley 2021) and to discrete mixing models (Secs. 3.3-3.4), all external inputs. The only self-citation (Watson et al. 2006) is a background example in the introduction and carries no load. Stated limitations are weighed and do not constitute circularity: the factorization n_g(a,D)=n(a)n_d(D) (Sec. 2.2) and the single-grain-population assumption (Sec. 4.4: 'we do not allow for the different dust sheets to have different dust properties') are modeling assumptions that could bias the fitted values if violated, but they do not presuppose the conclusions; the elevated reduced chi-square of 1.19-1.42 (Sec. 2.3) is likewise an honest limitation statement, not a circular step.
Assumptions & free parameters
free parameters (10)
- amax (MRN maximum grain radius) =
0.24 ± 0.01 µm
- amin (MRN minimum grain radius) =
<0.022 µm (2σ upper limit)
- q (MRN power-law slope) =
3.08 ± 0.04
- k_1keV (imaginary part of refractive index at 1 keV) =
(2.7 ± 0.7) x 10^-4
- 1 - n_1keV (real part deficit at 1 keV) =
(9 ± 2) x 10^-4
- k_alpha (power-law index for k(E)) =
3.4 ± 0.2
- n_alpha (power-law index for 1-n(E)) =
2.2 ± 0.2
- nd(D) radial dust density at 50 bins =
See Table 2 (e.g., 32±9 at 250 pc, 140±30 at 2027 pc)
- Relative flux normalization per energy band =
e.g., F_0.5keV = 0.09±0.02, F_1.25keV = 1.48±0.04, relative to 1 keV
- Mass fractions in composition mixture fits (Fe, MgSiO3, C) =
x(Fe) = 0.35 ± 0.07 (2σ 0.20-0.47)
assumptions (6)
- domain assumption Anomalous diffraction theory (ADT) applies: |m-1| << 1 and a/λ >> 1 (Eq. 4).
- domain assumption Single-scattering approximation; multiple scattering is neglected (Eqs. 2-3).
- domain assumption Dust density and grain size distribution are separable: n_g(a,D) = n(a) n_d(D) (Sec. 2.3).
- ad hoc to paper Grain size distribution follows an MRN power law (Eq. 6), possibly with an exponential cutoff or a lognormal component.
- ad hoc to paper Refractive index energy dependence follows power laws k(E) = k_1keV E^{-k_alpha}, 1-n(E) = (1-n_1keV) E^{-n_alpha} (Sec. 2.3.3).
- standard math Time-delay geometry td = D θ^2 / (2c) (Eq. 1).
Cite this review
Pith. "Pith review of The optical constants and grain sizes of interstellar dust measured directly using the dust scattered x-ray halo of GRB 221009A." pith.science (2026). https://pith.science/paper/PWXZUVN5
@misc{pith2026250612125,
  author       = {Pith},
  title        = {Pith review of: The optical constants and grain sizes of interstellar dust measured directly using the dust scattered x-ray halo of GRB 221009A},
  year         = {2026},
  howpublished = {\url{https://pith.science/paper/PWXZUVN5}},
  note         = {Machine review of arXiv:2506.12125}
}
abstract
X-ray scattering is a powerful probe of the optical constants and grain size distribution of interstellar dust. Bright, transient sources are excellent tools for this, since they fade rapidly, leaving only the expanding scattered x-ray halo. Here, we analyse the dust-scattered x-ray halo data of the unprecedentedly bright $\gamma$-ray burst, GRB 221009A, using anomalous diffraction theory to measure the grain size distribution of dust in the Galaxy as well as the complex refractive index, $m$, and use these results to infer the likely composition. We find a complex refractive index, $m=n+ik$ at several x-ray energies, finding $k_{1\,\mathrm{keV}}= (2.7 \pm 0.7)\times10^{-4}$ and $1-n_{1\,\mathrm{keV}}= (9 \pm 2)\times 10^{-4}$, strongly inconsistent with the commonly employed assumptions of the Rayleigh-Gans approximation. These results lie in the expected range for interstellar dust compositions dominated by carbon, magnesium silicates, and iron. The absorption results suggest a substantial mass fraction of iron at $35\pm7\%$. The MRN distribution fit returns a maximum grain radius, $a_{\rm max}=0.24\pm 0.01\,\mu$m; all fits strongly rule out models with $\sim0.4\,\mu$m grains for this sightline. The soft x-ray spectrum of the prompt GRB can also be inferred from the fitting, with the best-fit providing a spectral slope that is consistent with the slope of the low energy side of the best-fit Band model of the directly measured prompt emission. Forcing a different grain size or composition than the best fit results in an inferred prompt spectrum different to the observed prompt emission. The refractive index is consistent with standard average dust compositions, showing that x-ray scattering is an effective tool to measure interstellar dust optical properties. [abridged]
Figures


Figures from the paper (7 more)


Reference graph
Works this paper leans on
-
[1]
G., Lazarian, A., & Vaillancourt, J
Andersson, B. G., Lazarian, A., & Vaillancourt, J. E. 2015, ARA&A, 53, 501
2015
-
[2]
J., & Scott, P
Asplund, M., Grevesse, N., Sauval, A. J., & Scott, P. 2009, ARA&A, 47, 481
2009
-
[3]
P., Willingale, R., Kuulkers, E., et al
Beardmore, A. P., Willingale, R., Kuulkers, E., et al. 2016, MNRAS, 462, 1847
work page 2016
-
[4]
Corrales, L., Gotthelf, E. V ., Gatuzz, E., et al. 2024, ApJ, 965, 172
work page 2024
-
[5]
Corrales, L. R. & Paerels, F. 2015, MNRAS, 453, 1121
work page 2015
-
[6]
Costantini, E. & Corrales, L. 2022, in Handbook of X-ray and Gamma-ray As- trophysics, ed. C. Bambi & A. Sangangelo, 40 De Cia, A., Ledoux, C., Mattsson, L., et al. 2016, A&A, 596, A97 De Cia, A., Ledoux, C., Petitjean, P., & Savaglio, S. 2018, A&A, 611, A76 de Vries, C. P. & Costantini, E. 2009, A&A, 497, 393
work page 2022
-
[7]
Draine, B. T. 2003, ApJ, 598, 1026
2003
-
[8]
Draine, B. T. 2011, Physics of the Interstellar and Intergalactic Medium
2011
Show all 61 references
-
[9]
Draine, B. T. & Allaf-Akbari, K. 2006, ApJ, 652, 1318
2006
-
[10]
Draine, B. T. & Hensley, B. S. 2021, ApJ, 909, 94
2021
-
[11]
Draine, B. T. & Tan, J. C. 2003, ApJ, 594, 347
2003
-
[12]
W., Lang, D., & Goodman, J
Foreman-Mackey, D., Hogg, D. W., Lang, D., & Goodman, J. 2013, PASP, 125, 306
2013
-
[13]
2015, ApJ, 806, 265
Heinz, S., Burton, M., Braiding, C., et al. 2015, ApJ, 806, 265
2015
-
[14]
L., Gullikson, E
Henke, B. L., Gullikson, E. M., & Davis, J. C. 1993, Atomic Data and Nuclear Data Tables, 54, 181
1993
-
[15]
2010, ARA&A, 48, 21
Henning, T. 2010, ARA&A, 48, 21
2010
-
[16]
Hensley, B. S. & Draine, B. T. 2023, ApJ, 948, 55
2023
-
[17]
& Draine, B
Hoffman, J. & Draine, B. T. 2016, ApJ, 817, 139
2016
-
[18]
Jenkins, E. B. 2009, ApJ, 700, 1299
2009
-
[19]
P., Köhler, M., Ysard, N., Bocchio, M., & Verstraete, L
Jones, A. P., Köhler, M., Ysard, N., Bocchio, M., & Verstraete, L. 2017, A&A, 602, A46
2017
-
[20]
2022, A&A, 666, A12
Konstantopoulou, C., De Cia, A., Krogager, J.-K., et al. 2022, A&A, 666, A12
2022
-
[21]
2024, A&A, 681, A64
Konstantopoulou, C., De Cia, A., Ledoux, C., et al. 2024, A&A, 681, A64
2024
-
[22]
Lee, J. C. & Ravel, B. 2005, ApJ, 622, 970
2005
-
[23]
S., et al
Lesage, S., Veres, P., Briggs, M. S., et al. 2023, ApJ, 952, L42
2023
-
[24]
2003, ApJ, 591, 1220
Lodders, K. 2003, ApJ, 591, 1220
2003
-
[25]
B., Levan, A
Malesani, D. B., Levan, A. J., Izzo, L., et al. 2023, arXiv e-prints, arXiv:2302.07891
2023 arXiv
-
[26]
S., Rumpl, W., & Nordsieck, K
Mathis, J. S., Rumpl, W., & Nordsieck, K. H. 1977, ApJ, 217, 425
1977
-
[27]
C., & Petitjean, P
Mattsson, L., De Cia, A., Andersen, A. C., & Petitjean, P. 2019, A&A, 624, A103
2019
-
[28]
Mauche, C. W. & Gorenstein, P. 1986, ApJ, 302, 371
1986
-
[29]
Min, M., Waters, L. B. F. M., de Koter, A., et al. 2007, A&A, 462, 667
2007
-
[30]
J., Waters, L
Molster, F. J., Waters, L. B. F. M., & Tielens, A. G. G. M. 2002, A&A, 382, 222
2002
-
[31]
B., et al
Newville, M., Stensitzki, T., Allen, D. B., et al. 2016, Lmfit: Non-Linear Least- Square Minimization and Curve-Fitting for Python, Astrophysics Source Code Library, record ascl:1606.014
2016
-
[32]
Overbeck, J. W. 1965, ApJ, 141, 864
1965
-
[33]
2017, MNRAS, 472, 1465 Planck Collaboration, Abergel, A., Ade, P
Pintore, F., Tiengo, A., Mereghetti, S., et al. 2017, MNRAS, 472, 1465 Planck Collaboration, Abergel, A., Ade, P. A. R., et al. 2014, A&A, 571, A11 Planck Collaboration, Aghanim, N., Akrami, Y ., et al. 2020, A&A, 641, A12
2017
-
[34]
A., Whittet, D
Poteet, C. A., Whittet, D. C. B., & Draine, B. T. 2015, ApJ, 801, 110
2015
-
[35]
& Schmitt, J
Predehl, P. & Schmitt, J. H. M. M. 1995, A&A, 293, 889
1995
-
[36]
2024, AJ, 167, 217
Psaradaki, I., Corrales, L., Werk, J., et al. 2024, AJ, 167, 217
2024
-
[37]
2023, A&A, 670, A30
Psaradaki, I., Costantini, E., Rogantini, D., et al. 2023, A&A, 670, A30
2023
-
[38]
M., Rosen, S
Read, A. M., Rosen, S. R., Saxton, R. D., & Ramirez, J. 2011, A&A, 534, A34
2011
-
[39]
T., et al
Rogantini, D., Costantini, E., Zeegers, S. T., et al. 2019, A&A, 630, A143 Article number, page 12 of 13 Albert Sneppen and Darach Watson: Grain properties from the x-ray scattering halo of GRB 221009A
2019
-
[40]
T., et al
Rogantini, D., Costantini, E., Zeegers, S. T., et al. 2020, A&A, 641, A149
2020
-
[41]
Rolf, D. P. 1983, Nature, 302, 46
1983
-
[42]
Savage, B. D. & Sembach, K. R. 1996, ARA&A, 34, 279
1996
-
[43]
Smith, R. K. & Dwek, E. 1998, ApJ, 503, 831
1998
-
[44]
K., Edgar, R
Smith, R. K., Edgar, R. J., & Shafer, R. A. 2002, ApJ, 581, 562
2002
-
[45]
Tielens, A. G. G. M., Waters, L. B. F. M., Molster, F. J., & Justtanont, K. 1998, Ap&SS, 255, 415
1998
-
[46]
& Mereghetti, S
Tiengo, A. & Mereghetti, S. 2006, A&A, 449, 203
2006
-
[47]
2023, ApJ, 946, L30
Tiengo, A., Pintore, F., Vaia, B., et al. 2023, ApJ, 946, L30
2023
-
[48]
2010, ApJ, 710, 227
Tiengo, A., Vianello, G., Esposito, P., et al. 2010, ApJ, 710, 227
2010
-
[49]
2025, A&A, 696, A9 van de Hulst, H
Vaia, B., Bošnjak, Ž., Bracco, A., et al. 2025, A&A, 696, A9 van de Hulst, H. C. 1957, Light Scattering by Small Particles
2025
-
[50]
I., & Petropoulou, M
Vasilopoulos, G., Karavola, D., Stathopoulos, S. I., & Petropoulou, M. 2023, MNRAS, 521, 1590
2023
-
[51]
T., et al
Vaughan, S., Willingale, R., O’Brien, P. T., et al. 2004, ApJ, 603, L5
2004
-
[52]
2006, ApJ, 639, 323
Vaughan, S., Willingale, R., Romano, P., et al. 2006, ApJ, 639, 323
2006
-
[53]
A., Willingale, R., et al
Watson, D., Vaughan, S. A., Willingale, R., et al. 2006, ApJ, 636, 967
2006
-
[54]
Weingartner, J. C. & Draine, B. T. 2001, ApJ, 548, 296
2001
-
[55]
J., Butterworth, A
Westphal, A. J., Butterworth, A. L., Tomsick, J. A., & Gainsforth, Z. 2019, ApJ, 872, 66
2019
-
[56]
A., Kennea, J
Williams, M. A., Kennea, J. A., Dichiara, S., et al. 2023, ApJ, 946, L24
2023
-
[57]
1986, Nature, 319, 652
Xu, Y ., McCray, R., & Kelley, R. 1986, Nature, 319, 652
1986
-
[58]
T., Costantini, E., de Vries, C
Zeegers, S. T., Costantini, E., de Vries, C. P., et al. 2017, A&A, 599, A117
2017
-
[59]
T., Costantini, E., Rogantini, D., et al
Zeegers, S. T., Costantini, E., Rogantini, D., et al. 2019, A&A, 627, A16
2019
-
[60]
& Shen, R.-F
Zhao, G. & Shen, R.-F. 2024, ApJ, 970, 124
2024
-
[61]
2018, ApJ, 857, 94 Article number, page 13 of 13
Zhukovska, S., Henning, T., & Dobbs, C. 2018, ApJ, 857, 94 Article number, page 13 of 13
2018
Reviewed August 7, 2026 · model on record in the stance chip above.
Discussion (0). Continue with ORCID to comment.