REVIEW 3 major objections 6 minor 18 references
A 13-Billion-Year View of Galaxy Growth: Metallicity Gradient Evolution from the Local Universe to $z=9$ with JWST and Archival Surveys
T0 review · 3 major / 6 minor · reviewed 2026-08-07 · deepseek-v4-flash
Pith's one-line read Combining 455 JWST galaxies with archival surveys, this paper traces how the radial metallicity gradient of galaxies evolves from z=9 to z=0, finding steep negative gradients at z>5, near-flat gradients at z≈2, and renewed steepening…
desk verdict New z>5 gradient measurements are worth a referee, but the steep slopes rest on an untested lower-branch assumption in the R3 calibration. read the letter →
The pith
A machine-rendered reading of the paper's core claim, the machinery that carries it, and where it could break.
The reading
What carries the argument
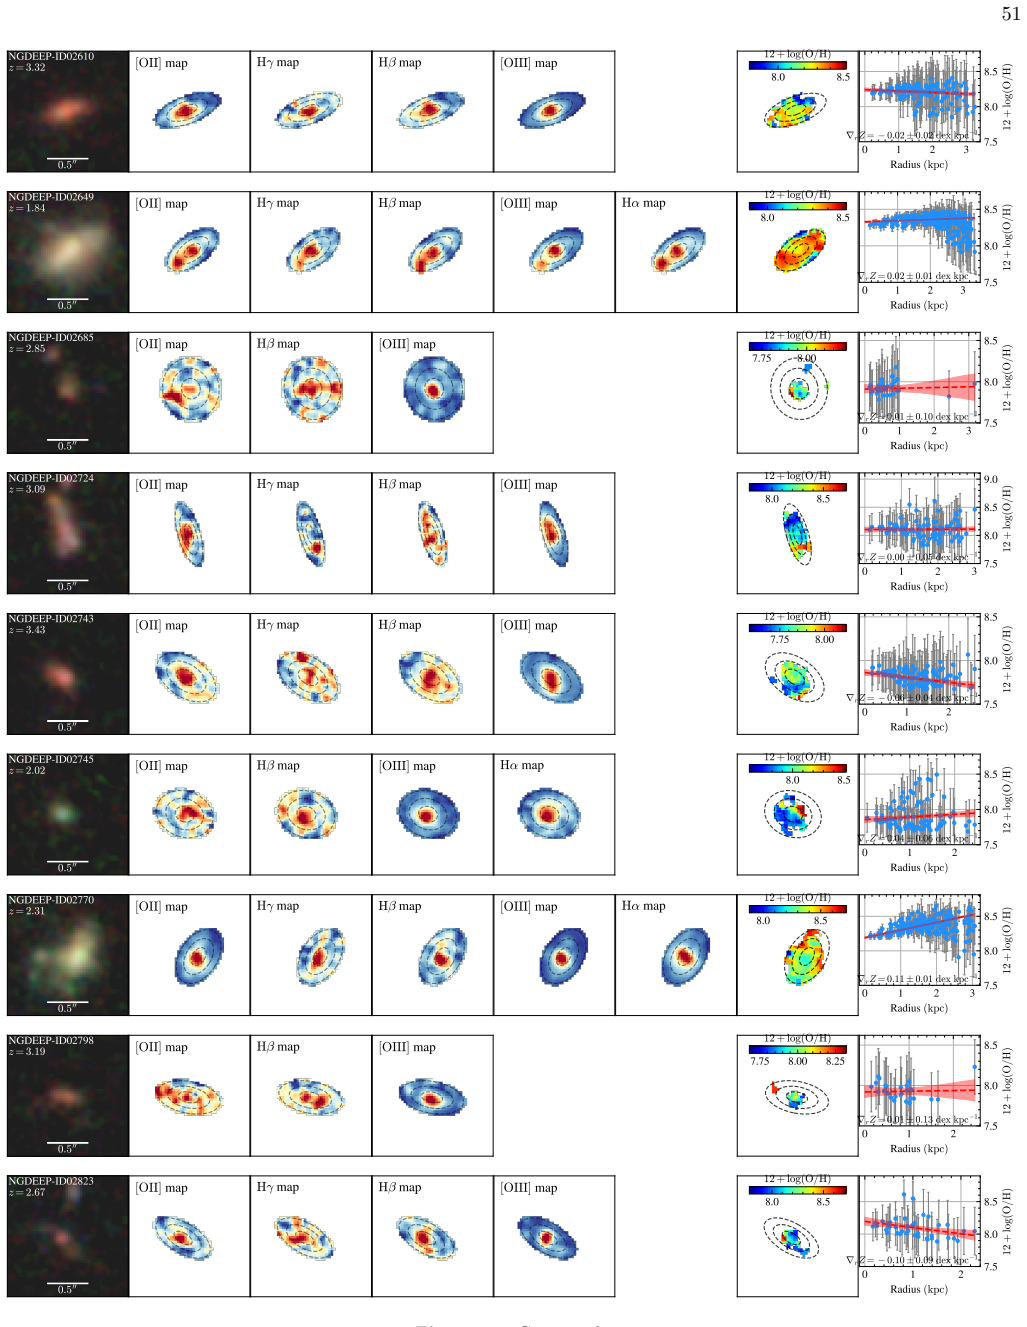
The central object is the gas-phase metallicity gradient $\nabla_r \log(\mathrm{O/H})$ measured in dex/kpc. The measurement pipeline stacks emission-line maps without resizing or deprojecting, converts the [OIII]/Hβ (R3) line ratio to metallicity using an empirical calibration built from direct electron-temperature measurements of high-redshift galaxies, and assumes the lower-branch solution (12+log(O/H)≲7.9) for z>5 galaxies on the basis of their low stellar masses and the adopted mass-metallicity relation. For the z≈2 NGDEEP sample, the [OII]/Hβ (R2) index resolves the R3 degeneracy. The evolutionary curve is fitted by a double power law in (1+z), and the z>5 observations are compared with predictions of the Feedback-Free Starburst toy model, which reproduces steep gradients when central in situ star formation dominates while gas mixing is inefficient.
What would settle it
Measure [OII]λ3727 or the auroral line [OIII]λ4363 for a sample of the z≈5-9 galaxies in ASPIRE and FRESCO. If the direct electron-temperature metallicities place a sizable fraction above 12+log(O/H)≈7.9, or if the [OII]/Hβ ratios are inconsistent with the lower branch, the steep negative gradients reported here would not survive.
Extended reading notes
Core claim
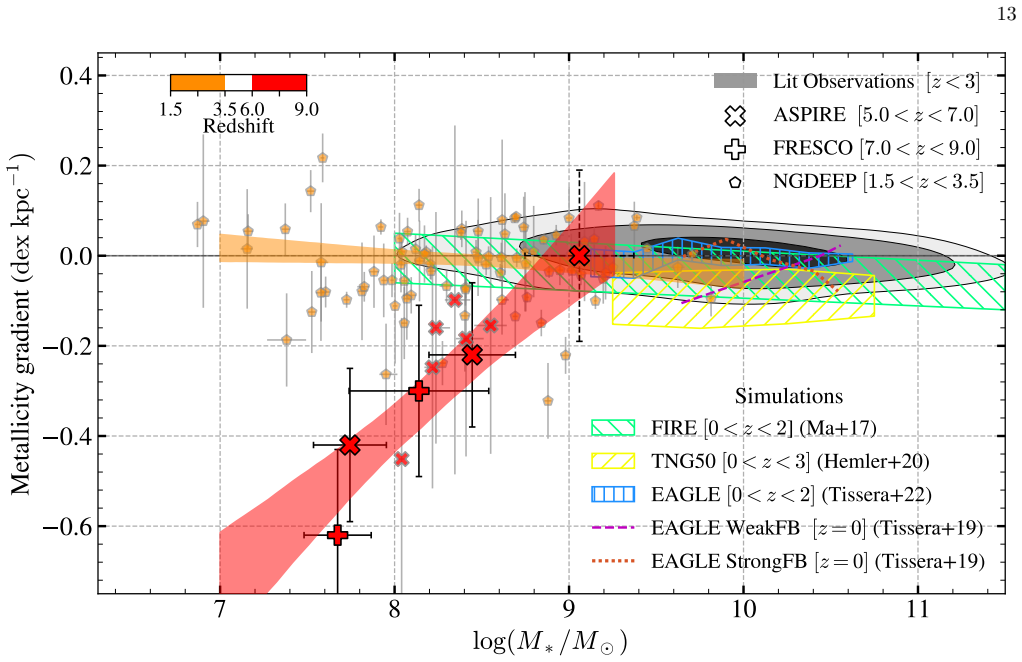
Using median stacks of [OIII] and Hβ emission maps from the ASPIRE (z≈5-7), FRESCO (z≈7-9), and NGDEEP (z≈1.7-3.5) surveys, the paper measures radial gradients in 12+log(O/H) and finds steep negative gradients of -0.34±0.18 and -0.53±0.21 dex/kpc in the two highest-redshift bins. Combining these with literature gradients from z=0 to z≈3, the authors find an ascending phase from z≈8 to z≈2, a peak near z≈2 coincident with the peak of the cosmic star formation rate density, and a descending phase to z=0. The paper interprets this as evidence for three distinct galaxy growth modes: inside-out growth with inefficient feedback and limited radial mixing at cosmic dawn, enhanced gas mixing from feedback-driven winds and cold gas accretion at cosmic noon, and secular steepening as feedback weakens toward the present. It also reports a positive mass-metallicity-gradient relation at z>5 and a negative one at z≈2, supporting the same shift in the dominant mixing mechanism.
Load-bearing premise
For the z>5 stacked samples, essentially all galaxies are assumed to lie on the lower branch of the double-valued R3 ([OIII]/Hβ) metallicity calibration; if a non-negligible fraction of the population actually sits on the upper branch, the reported steep negative gradients flatten or invert.
Editorial extensions
If this is right
- At z>5, metal gradients are steep and negative (-0.3 to -0.5 dex/kpc), so the first generations of galaxies built their metal content in their cores before their disks.
- The flattening at z≈2 ties chemical mixing inside galaxies to the peak of the cosmic star formation rate, implicating feedback-driven outflows and cold gas accretion as the mixing agents.
- The late-time steepening toward z=0 implies feedback weakens and disks settle, so metal gradients re-form through secular evolution.
- The mass-metallicity-gradient relation flips sign between z>5 (positive) and z≈2 (negative), showing that low-mass galaxies at cosmic noon are the ones most affected by feedback-driven mixing.
Reading between the lines
- If the interpretation holds, galaxies at z>5 with higher stellar mass should show shallower gradients than low-mass ones; a targeted survey spanning a wider mass range at z≈6-9 could test this directly.
- The lower-branch assumption could be checked with JWST/NIRSpec or ALMA observations of [OII] or [NII] for a subset of the ASPIRE/FRESCO galaxies; if some fall on the upper branch, the reported gradients would flatten or even invert.
- The same stacking method applied to future JWST surveys over larger areas could extend the gradient-redshift curve beyond z=9, testing whether the steep negative phase continues into the era of the first galaxies.
Editorial analysis
A structured set of objections, weighed in public.
Referee Report
Summary. This paper combines JWST WFSS observations from ASPIRE, FRESCO, and NGDEEP with literature measurements to present gas-phase metallicity gradients for 455 spectroscopically confirmed galaxies at 1.7 ≲ z ≲ 9. For z > 5, the authors stack [OIII] and Hβ emission maps in two redshift bins and, adopting the lower branch of the double-valued R3 ([OIII]/Hβ) calibration, report negative gradients of −0.34 ± 0.18 and −0.53 ± 0.21 dex/kpc at z ≈ 5–7 and z ≈ 7–9, respectively. Combining these points with literature data at lower redshift, they propose a U-shaped redshift evolution: steep negative gradients at cosmic dawn, flattening to near-zero around z ≈ 2, and steepening again toward z = 0. They interpret this as inside-out growth with inefficient metal mixing at high z, enhanced mixing at cosmic noon, and secular evolution at low z, and they support the interpretation with comparisons to cosmological simulations and a toy Feedback-Free Starburst (FFB) model.
Significance. If the high-redshift gradients are correct, this is one of the first statistical measurements of radial metallicity structure at z > 5 and would provide a valuable constraint on gas accretion, feedback, and metal mixing across 13 Gyr of cosmic time. The paper's strengths include a large, uniformly processed WFSS sample; bootstrap-resampled stacks; explicit tests of alternative strong-line calibrations (Appendix E); mock recovery tests of the stacking method (Appendix G); and a detailed discussion of AGN contamination (Appendix I). The central high-redshift result, however, depends on an untested branch choice in a double-valued metallicity calibration, and the lower-redshift evolutionary curve is assembled from heterogeneous literature measurements. The FFB comparison is a fit with chosen parameters rather than an independent prediction. A public release of the reduction and fitting code would also improve reproducibility.
major comments (3)
- [Section 3.3, Table 1, Section 2.3] The z > 5 negative gradients rest entirely on assigning every stacked radial bin to the lower branch of the double-valued R3 calibration (12+log(O/H) ≲ 7.9). The stated justification—the Sarkar+25 MZR plus the log(M*/M☉) ≤ 9 mass cut—is not sufficient. The MZR has ~0.16 dex scatter; at log M* = 9 and z = 6 its central value is already near 12+log(O/H) ≈ 8.0, and a galaxy with a negative gradient has central bins more enriched than its integrated metallicity, so a non-negligible fraction of central bins can plausibly lie on the upper branch. On the upper branch the same centrally elevated R3 would imply a positive (inverted) gradient, so a radially varying branch fraction could flatten or invert the reported −0.34 and −0.53 dex/kpc. Appendix E changes only the calibrator while keeping the lower branch, and the Appendix G mock test assigns metallicities from the MZR with scatter but assumes a single branch. The authors should quantify the upper-branch fraction from the MZR scatter plus the expected central radial offset, or repeat the stacking with the upper branch and with a two-branch mixture; the Appendix A result that the massive ASPIRE upper-branch bin gives a flat gradient (0.00 ± 0.18) underscores the sensitivity to this choice.
- [Section 4.1, Fig. 2, Eq. (3)] The ascending phase at z > 5 is supported by only two stacked bins (5.3 < z < 7 and 7 < z < 9), whose gradients are consistent with each other at about the 1σ level (−0.34 ± 0.18 versus −0.53 ± 0.21). The double-power-law fit of Eq. (3) has broad posterior uncertainties (e.g., γ3 = 5.23 +2.42/−2.01 in Appendix D), and the z < 2 part of the curve is assembled from literature measurements using different line diagnostics, spatial resolutions, and selection functions. The reported likelihood-ratio p-value of 1.3 × 10⁻²² does not account for inter-calibration systematics. The authors should show how the best-fit evolution changes when each high-z bin is removed, and should add a systematic floor (e.g., 0.05–0.1 dex/kpc) to the literature measurements to test whether the ascending and descending phases survive.
- [Section 4.3, Fig. 4] The claimed positive MZGR at 5 < z < 9 (slope 0.30 ± 0.19) is derived from a small number of stacked mass bins, and the highest-mass ASPIRE bin is measured with the upper branch of the R3 calibration (Appendix A). Since that upper-branch bin shows a flat gradient (0.00 ± 0.18), it contributes strongly to the positive MZGR. The branch dependence is therefore not limited to the average gradients; it also affects the mass dependence claim. The MZGR fit should be repeated with a consistent branch treatment and with the branch-mixing systematic propagated into the fitted slope.
minor comments (6)
- [Section 4.5, text near Eq. (6)] In the sentence defining f_sn, Z_sn, and Z_sn, the third quantity should be the metallicity of gas forming stars, Z_sf; as written the same symbol Z_sn appears twice.
- [Section 2.3] The text says the low-mass sample includes 47 FRESCO galaxies, but later states that the final FRESCO sample contains 42 galaxies at 7 < z < 9; please clarify the selection step that reduces 47 to 42.
- [Fig. 2 caption] The caption says the dark-red line shows the 'best fit of all stacks,' but the fit includes individual NGDEEP and literature measurements as well; please rephrase.
- [Section 3.4] The phrase 'the observed elasticity is due to projection effects' should read 'the observed ellipticity'; this appears to be a typo.
- [Section 4.1] The sign convention for the quoted slopes, such as '−0.046 ± 0.012 dex kpc−1/δz from z = 3.5 to z = 1.75,' is confusing because δz is negative as cosmic time increases; please state explicitly whether the derivative is taken with respect to redshift or cosmic time.
- [Appendix C] In the sentence beginning 'The P star is obtained by spatially resolved SED fitting,' the symbol appears to be a typo for the stellar mass surface density Σ_star; please correct.
Circularity Check
The z>5 gradient measurement is observational and not circular; the only reduction is the FFB toy-model comparison, whose parameters are chosen to reproduce the observed gradients before being presented as agreement.
-
fitted input called prediction
[Section 4.5, Eqs. (8)-(9), Fig. 7b]
"We adopt ϵ=0.05∼0.2, Z_in=0.01Z⊙, Z_sn=3Z⊙, f_sn=0.2, and f_out=0.95 (corresponding to η=18∼4), which reproduce the observation well. ... From Fig. 7b, our observed metallicity gradients in the ASPIRE and FRESCO samples are also in agreement with the predictions of the FFB models at redshifts of z=6 and z=8, respectively."
The FFB model parameters (ϵ, Z_in, Z_sn, f_sn, f_out) are explicitly adopted so that the model 'reproduce[s] the observation well,' and then the same section states that the observed gradients are 'in agreement with the predictions of the FFB models.' The agreement is therefore a restatement of the parameter choice, not an independent test of the model. However, this is a toy-model interpretation in the discussion section and does not enter the observational derivation of the metallicity gradients themselves.
full rationale
The central observational chain is self-contained: [OIII] and Hβ maps are stacked from JWST WFSS data, line ratios are converted to metallicity via the external R3 calibration of Sanders et al. (2024), and the lower-branch choice is justified by an empirical mass-metallicity relation (Sarkar et al. 2025) plus a stellar-mass cut. The resulting z>5 gradients are measurements of the stacked line-ratio profiles under an explicit calibration assumption; they do not reduce to the paper's own inputs by construction. The lower-branch assumption is a genuine systematic risk, but it is not a circular step because the R3-to-Z mapping is external and monotonic on the chosen branch. Self-citations to Wang et al. (2020), Li et al. (2022), and companion FFB papers are methodology or interpretation, not load-bearing for the main claim. The one partial circularity is the FFB toy-model comparison in Section 4.5: parameters are chosen to reproduce the observation and then the model's output is called a prediction. This affects the interpretive claim only, leaving the observational gradient evolution independently supported.
Assumptions & free parameters
free parameters (6)
- FFB star formation efficiency epsilon =
0.05-0.2
- Inflow metallicity Z_in =
0.01 Z_sun
- SN ejecta metallicity Z_sn =
3 Z_sun
- Mass loading fraction f_out =
0.95
- KS-law burstiness parameter kappa_s =
10 (z~1-3), 20 (z~6-7)
- Double power-law parameters gamma0-gamma4 =
0.40, 0.27, 5.17, 5.23, -0.50
assumptions (6)
- domain assumption Flat Lambda-CDM cosmology with Omega_m=0.3, Omega_Lambda=0.7, H0=70 km/s/Mpc
- domain assumption R3 and R2 strong-line calibrations (Sanders+24, Bian+18) are valid at the redshifts studied
- domain assumption The lower branch of the double-valued R3 calibration applies to the z>5 sample
- domain assumption The Kennicutt-Schmidt law with chosen kappa_s applies to derive gas masses
- domain assumption The SMC dust attenuation law applies at all redshifts
- domain assumption Sample galaxies are circular disks for deprojection
Cite this review
Pith. "Pith review of A 13-Billion-Year View of Galaxy Growth: Metallicity Gradient Evolution from the Local Universe to $z=9$ with JWST and Archival Surveys." pith.science (2026). https://pith.science/paper/XOK3Q7YR
@misc{pith2026250612129,
  author       = {Pith},
  title        = {Pith review of: A 13-Billion-Year View of Galaxy Growth: Metallicity Gradient Evolution from the Local Universe to $z=9$ with JWST and Archival Surveys},
  year         = {2026},
  howpublished = {\url{https://pith.science/paper/XOK3Q7YR}},
  note         = {Machine review of arXiv:2506.12129}
}
abstract
The galaxy gas-phase metallicity gradients have been extensively studied over the past four decades, both in the local and high-redshift universe, as they trace the baryon cycle and growth of galaxies. With the unprecedented spatial resolution and sensitivity of JWST, it is now possible to measure metallicity and its radial gradients out to redshifts as high as $z = 9$. Here, we present a sample of 455 spectroscopically confirmed galaxies from redshifts $1.7 \lesssim z \lesssim 9$ that are spatially resolved on sub-kiloparsec (kpc) scales by deep JWST NIRCam or NIRISS Wide Field Slitless Spectroscopy (WFSS). Synthesizing these new JWST observations with legacy observations from the literature, we observe that at redshift $z > 5$, galaxy centers are more metal-rich, exhibiting negative metallicity gradients of $\sim-0.4$ dex kpc$^{-1}$. These gradients flatten over time, reaching near-zero around $z \approx 2$, coinciding with the peak of the cosmic star formation rate. Beyond this point, the gradients become negative again at lower redshifts approaching $z=0$. This evolution likely reflects transitions in galaxy formation modes: an inside-out growth phase dominated by intense central star formation with inefficient feedback and limited gas mixing during ``cosmic dawn", enhanced gas mixing due to feedback-driven wind and gas accretion at ``cosmic noon", and a later phase of slow evolution and reduced feedback toward the present day. These physical processes, including gas accretion and feedback, not only regulate star and galaxy formation on a cosmic scale but also shape the evolutionary pathways of individual galaxies over cosmic time.
Figures


Figures from the paper (31 more)




Reference graph
Works this paper leans on
-
[1]
Acharyya, A., Peeples, M. S., Tumlinson, J., et al. 2025, ApJ, 979, 129, doi: 10.3847/1538-4357/ad9dd8 Angl´ es-Alc´ azar, D., Faucher-Gigu` ere, C.-A., Kereˇ s, D., et al. 2017, MNRAS, 470, 4698, doi: 10.1093/mnras/stx1517 Arribas, S., Perna, M., Rodr ´ ıguez Del Pino, B., et al. 2024, A&A, 688, A146, doi: 10.1051/0004-6361/202348824 Aung, H., Mandelker,...
arXiv 2025
-
[2]
The gray shadow encompasses literature observations (D. Carton et al. 2018; A. Franchetto et al. 2021; R. C. Simons et al. 2021). andz= 7.24 for ASPIRE and FRESCO, respectively. We then apply the SED fitting to each pixel, assuming the fixed redshiftsz= 6.28 andz= 7.24 for the ASPIRE and FRESCO samples, respectively. The gas surface density Σ gas can be d...
work page 2018
-
[3]
E.SYSTEMATICS USING DIFFERENT EMISSION-LINE CALIBRATIONS To verify that our results are not significantly altered by different metallicity diagnostics, we compare our fiducial measurements using F. Bian et al. (2018) in the NGDEEP sample with other popular calibrations based on different samples and methods (R. Maiolino et al. 2008; M. Curti et al. 2020a;...
work page 2018
-
[4]
We estimate gas density by inverting the Kennicutt–Schmidt law (KS law, M
In this section, we present our gas fraction estimation as follows. We estimate gas density by inverting the Kennicutt–Schmidt law (KS law, M. Schmidt 1959; R. C. Kennicutt 1989): ΣSFR = 10−12κsΣ1.4 gas,(C1) where ΣSFR is inM ⊙yr−1 kpc−2, and Σ gas is inM ⊙ kpc−2.κ s is the burstiness parameter representing the deviation from the original KS relation (A. ...
work page 2010
-
[9]
9, but for galaxies with highest stellar masses (log(M ∗/M⊙)>9.00) in ASPIRE sample
Figure 10.The same as Fig. 9, but for galaxies with highest stellar masses (log(M ∗/M⊙)>9.00) in ASPIRE sample. The metallicities are estimated using the upper branch solution of the R3 relation in R. L. Sanders et al. (2024). 0.4 0.2 0.0 0.2 0.4 arcsec 0.4 0.2 0.0 0.2 0.4 arcsec [OIII] map 0.4 0.2 0.0 0.2 0.4 arcsec [OII] map 0.4 0.2 0.0 0.2 0.4 arcsec H...
work page 2024
-
[10]
We resample our 1D spectra to rest-frame on a common 1 ˚Awavelength grid with flux preserved usingspectres(A. C. Carnall 2017). Following X. Wang et al. (2022b), to avoid the excessive weighting towards bright sources with stronger line fluxes, we normalized each spectrum by its measured [Oiii] flux. We take the median value of the normalized spectra at e...
work page 2022
-
[11]
The stacks in mass bins provide a more representative characterization of the galaxy population with similar masses and sizes. From the stacked map of NGDEEP sample, we measure the MZGR slope of−0.019 dex kpc −1 using the two stacked points at low and high masses, which is consistent with the slope of−0.020 dex kpc −1 obtained from a linear regression on ...
work page 2024
-
[12]
We note that K. Nakajima et al. (2022) calibration gives∼0.1−0.2 dex high metallicities. More detailed analysis of integrated metallicity and mass-metallicity relation of the ASPIRE and NGDEEP sample is presented in Z. Li et al. (2025) and X. He et al. submitted. G.UNCERTAINTIES IN GRADIENT MEASUREMENTS To quantify how uncertainties in emission may impact...
work page 2022
Show all 18 references
-
[13]
Carton et al
We also include literature observations at high redshift (D. Carton et al. 2018; R. C. Simons et al. 2021), and local observations from MaNGA (A. Franchetto et al. 2021), which provide metallicity gradients in the same units for comparison. The ascending phase at 3.5< z <1.75 ...
2018
-
[15]
Maiolino et al
R. Maiolino et al. (2025) further suggested a high covering factor of the broad line region (BLR), prohibiting photons 37 from escaping to produce NLR emissions. An alternative explanation is that the NLR of high-zAGN is characterized by low metallicities (Y. Harikane et al. 2...
2025
-
[16]
The AGN component should contribute to a small fraction of the total [Oiii] emissions from the host galaxy
suggested that AGN NLR emission is subdominant, possibly due to either the high cover fraction in BLR or the low metallicity nature of NLR. The AGN component should contribute to a small fraction of the total [Oiii] emissions from the host galaxy. M. Curti et al. (2024) also f...
2024
-
[18]
Therefore, the gradients observed for galaxies atz≈6−7 are strong representations of the populations
We have found that the gradient measured from the stacked emission maps can effectively represent the median gradients of the mock sample. Therefore, the gradients observed for galaxies atz≈6−7 are strong representations of the populations. 0.0 0.5 1.0 1.5 2.0 2.5 kpc 6.5 7.0 ...
2024
-
[1996]
and SNIa (F. K. Thielemann et al. 1986), and FOGGIE uses a custom recipe for the metal enrichment. Different metal yield influences the absolute metals produced in galaxies, and, for example, can imprint on the normalization of mass-metallicity relations (e.g. X. Ma et al. 201...
2021
-
[2006]
and the predictions of a photoionization model in the high-metallicity branch (L. J. Kewley & M. A. Dopita 2002). The calibrations in M. Curti et al. (2020a) are derived from a set of individual low-metallicity galaxies together with stacks of high-metallicity galaxies in the ...
2020
-
[2015]
to separate AGNs from star-forming galaxies. In Fig. 20, we have removed the sources≥2σfrom the demarcation. As shown, all of our sample galaxies are classified as typical star-forming galaxies. Nevertheless, we also note that AGN may be more common in high-zgalaxies. Y. Harik...
2023
-
[2023]
between FFB clouds and the mean overdensity. For less massive galaxies between green solid and dashed lines, the gas clouds can reach the FFB threshold when their contraction reaches a higher density than the mean gas density, so that the FFB can happen locally. If the gas can...
2003
-
[2025]
×” and “+
measured at similar redshifts. We also considered 33 0.6 0.4 0.2 0.0 0.2 0.4 0.6 ∇ rlog(O/H) (dex kpc−1) [Fiducial] 0.6 0.4 0.2 0.0 0.2 0.4 0.6 ∇ rlog(O/H) (dex kpc−1) [Alternative] Maiolino+08 Curti+20 Nakajima+22 Figure 16.Comparisons between different strong-line calibratio...
2018
-
[4959]
Assuming the lower branch solution, the metallicities are measured using R3 calibrations from R. L. Sanders et al. (2024), the same as we use for metallicity gradient measurements. We also compare the metallicities from different calibrations in K. Nakajima et al. (2022). We l...
2024
Reviewed August 7, 2026 · model on record in the stance chip above.
Discussion (0). Continue with ORCID to comment.