REVIEW 5 major objections 3 minor 13 references
Ball path curvature and in-game free throw shooting proficiency in the National Basketball Association
T0 review · 5 major / 3 minor · reviewed 2026-08-07 · deepseek-v4-flash
Pith's one-line read This paper claims that low curvature near release predicts NBA free-throw percentage, and that coaches should prioritize smoothing the end of the shot rather than its peak-curvature transition.
desk verdict New in-game curvature result, but the release-point rule is load-bearing and untested. read the letter →
The pith
A machine-rendered reading of the paper's core claim, the machinery that carries it, and where it could break.
The reading
What carries the argument
The central object is the time-weighted curvature integral σ(ℓ) = ∫₀¹ (ℓ+1)κ(τ)^ℓ dτ, applied to an eighth-order Bézier curve fitted by least squares to the ball's sagittal-plane trajectory. κ(τ) is the standard planar curvature formula |x' z'' − z' x''| / ((x')² + (z')²)^{3/2}. The weighting factor ℓ shifts emphasis toward the end of the path: ℓ = 0 gives the average curvature, while larger ℓ makes the integral approximate terminal curvature κ(1). Per-player averages of these integrals enter a weighted least squares regression of season FT%, weighted by season free-throw attempts, so players with more attempts influence the fit more.
What would settle it
Re-run the weighted least squares regressions with the release point moved one frame earlier and one frame later relative to the maximum-speed frame. If the ℓ = 5 terminal-curvature coefficient stays near –48.7 with p ≈ 0.0003 and R² ≈ 0.33, the endpoint rule is not driving the result; if the effect shrinks, changes sign, or falls below significance, the central claim depends on the chosen release heuristic.
Extended reading notes
Core claim
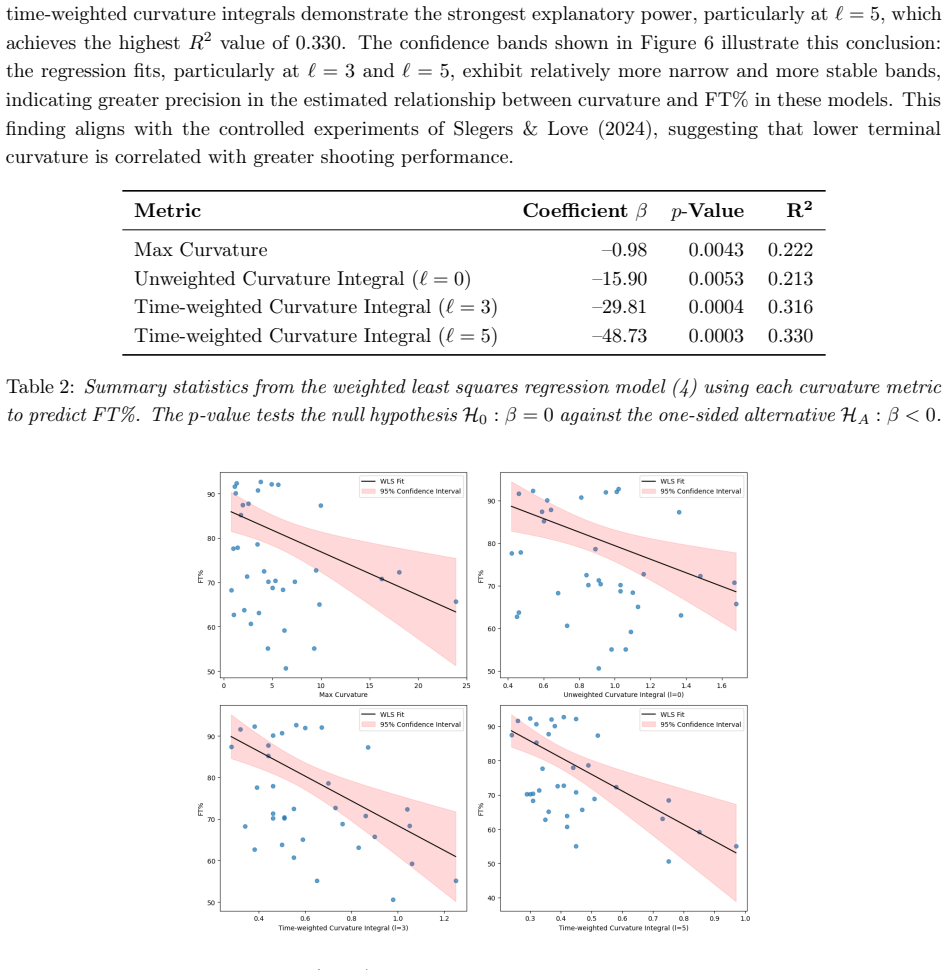
The paper's claim, on its own terms, is that the smoothness of the ball's path as it approaches release carries real information about free-throw proficiency in NBA game conditions. In a weighted least squares regression of season FT% on player-average curvature, the time-weighted curvature integral at ℓ = 5 has a coefficient of –48.73 (p = 0.0003) and an R² of 0.330, while max curvature has a coefficient of –0.98 and an R² of 0.222. Both are negative and statistically significant, so higher curvature anywhere is associated with lower accuracy, but the terminal measure is the stronger predictor. This matches the prior controlled study's conclusion that terminal curvature matters most, while differing from it on the direction of max curvature. The authors read these results as evidence that coaches should treat end-of-path smoothness, not the peak-curvature transition, as the primary mechanical target, and that curvature metrics can be derived automatically from in-game optical tracking alone.
Load-bearing premise
The load-bearing premise is that release occurs about 0.08 seconds after the ball reaches maximum speed, and therefore that 'terminal curvature' measured near that point is a true property of the shooter's late motion; if that timing rule is wrong or noisy, the stronger association between terminal curvature and free-throw percentage could be an artifact of where the path is cut.
Editorial extensions
If this is right
- Coaches should target the final phase of the shot: a curvature metric that weights late-path bending explains 33% of between-player variance in FT%, more than any other tested metric.
- Peak curvature alone is a weaker lever; its R² is 22.2%, so smoothing only the initial forward transition is less likely to move accuracy.
- Shot smoothness can be quantified automatically from in-game optical tracking, without biomechanical sensors or hand-contact video.
- The method carries over from controlled jump-shot experiments to elite game conditions, with the open discrepancy in max-curvature direction flagged for future work.
Reading between the lines
- My inference: the absence of a sensitivity analysis around the 0.08-second release rule is the most direct threat; re-running the regressions with release pulled one or three frames after peak speed would show whether the ℓ = 5 result is stable.
- My inference: the monotone increase in R² from ℓ = 0 (0.213) to ℓ = 3 (0.316) to ℓ = 5 (0.330) suggests a dose-response; an independent dataset of jump shots or next-season free throws could test whether weighting the end more heavily always increases explanatory power.
- My inference: since release-speed variability was the accuracy proxy in the laboratory study, measuring the spread of estimated release speeds from the same tracking data could reveal whether terminal curvature works through speed control.
- My inference: the framework could be turned into a coach-facing diagnostic that tracks a player's ℓ = 5 curvature across games and checks whether a targeted late-shot smoothing drill lowers it before FT% rises.
Editorial analysis
A structured set of objections, weighed in public.
Referee Report
Summary. This paper analyzes 515 in-game NBA free throws from 35 players using Second Spectrum optical tracking. The authors fit eighth-order Bézier curves to the sagittal-plane ball path, compute max curvature and time-weighted curvature integrals σ(ℓ) for ℓ=0, 3, and 5, and regress player-level season FT% on each metric via WLS weighted by season free-throw attempts. They find negative associations for all metrics and report that the ℓ=5 terminal integral has the largest R² (0.330 vs 0.222 for max curvature), concluding that coaches should prioritize smoothing the end of the shooting motion. The manuscript is an extension of Slegers & Love (2024) to in-game data.
Significance. The curvature mathematics and the regression setup are standard and clearly described, and the use of an independent outcome (season FT%) rather than a same-sample kinematic proxy is a real strength. If the endpoint-definition concerns are resolved, the paper would provide a useful in-game validation that terminal path smoothness carries more information than peak curvature, with a concrete coaching implication. The authors are also explicit about limitations, including sensitivity of Bézier fits to parameter choices. At present, however, the central claim rests on endpoint and parameter choices that are not shown to be robust, so the strength of the evidence is not yet commensurate with the title's broad conclusion.
major comments (5)
- [Section 4.1; Table 2] The release point is defined as two frames (0.08 s) after the frame of maximum ball speed, and this endpoint determines the terminal portion of the Bézier path used to compute σ(5). The assumption that speed is maximized at release is not validated, and no sensitivity analysis is reported for the two-frame lag. If the true release occurs at or before the max-speed frame, the terminal metric partly describes post-release flight; if the max-speed frame is noisy or its offset from true release correlates with FT%, the reported advantage of σ(5) over κ_max (R²=0.330 vs 0.222) could be an artifact of the endpoint rule. Please report results for lags of 0, 1, 2, and 3 frames, and validate the rule against known release times on a subset of shots if possible.
- [Section 4.1] The start of the analyzed path is 'the frame in which the ball is furthest from the player's body,' but the data description states that only ball positions are available and explicitly says the authors have no information about the shooter's elbow or hand. The operational definition of 'furthest from the player's body' is therefore not reproducible from the described data. Because the Bézier fit and all curvature metrics depend on the start point, please specify how body position is determined or replace this rule with a purely data-based criterion.
- [Equation (3), Section 4.2.3] As printed, Eq. (3) defines σ(ℓ)=∫₀¹ (ℓ+1)κ(τ)^ℓ dτ, which is a power transform of curvature, not a time-weighted integral. This is inconsistent with the surrounding text ('more weight as time increases') and with Figure 4, which shows the product of a time weight and curvature. If the intended definition is σ(ℓ)=∫₀¹ (ℓ+1)τ^ℓ κ(τ) dτ (or equivalent), correct the formula and confirm that the reported σ(3) and σ(5) values were computed with that definition; as written, the manuscript does not reproduce the central metric.
- [Section 5, Table 2] The conclusion that terminal curvature 'explains much more of the between-player variance' is based on comparing in-sample R² values across four metrics, with ℓ=5 appearing to be selected after inspecting results. No adjusted R², cross-validation, bootstrap, or interval estimate for R² is provided. With n=35 players, the difference between R²=0.330 and R²=0.222 may be within sampling variability, and the ranking should be shown to be stable (e.g., leave-one-player-out or bootstrap) before drawing a coaching recommendation.
- [Section 3, Section 4.3] Each player-level curvature predictor is an average of only about 15 tracked shots, and the WLS model accounts for uncertainty in the outcome (FT%) but not for measurement error in the predictor. Such errors-in-variables attenuation can affect different curvature metrics differently and can bias the R² ranking in Table 2. Please add a reliability analysis (e.g., split-half or within-player between-shot consistency) or an errors-in-variables sensitivity check.
minor comments (3)
- [Section 4.3 vs Table 2 caption] Section 4.3 states that the p-value tests the two-sided alternative H_A: β≠0, while the Table 2 caption says the test is one-sided (H_A: β<0). Please make these consistent.
- [Section 4.2.1] The phrase 'weighted averaged' should be 'weighted average'.
- [Section 4.2.1] The choice of Bézier order n=8 is justified only by visual inspection; a brief note on why n=6 (as in Slegers & Love, 2024) was not used, or a sensitivity check, would help the reader assess the robustness of the reported metrics.
Circularity Check
No significant circularity: the curvature metrics are measured from ball tracking data and regressed against an independent season FT% outcome.
full rationale
The paper's derivation chain is: optical ball tracking yields (x,y,z) positions; a Bézier curve is fitted to the sagittal-plane trajectory; curvature κ(τ) is computed from that fitted curve; a weighted integral σ(ℓ) summarizes terminal curvature; and σ(ℓ) is regressed against season free-throw percentage obtained from an external source (Basketball Reference). None of these steps defines the predictor in terms of the outcome or fits a parameter to FT% and then renames it as a prediction. The release-point rule in §4.1 (two frames after maximum ball speed) influences where terminal curvature is evaluated, but this is a measurement-definition concern and would be a validity or robustness issue, not a circular reduction: FT% is not used to define the endpoint, and the association could have failed empirically. The heavy methodological citation to Slegers & Love (2024), which shares an author with this paper, is real self-citation, but it is not load-bearing for the new result: the present study tests the prior framework on new NBA in-game data with an independent outcome, so the citation provides a template rather than the evidence for the association. The use of 'predictive power' to describe in-sample R² in Table 2 and Section 6.1 is standard regression language, not a claim that an out-of-sample prediction was made from a fitted parameter. No equation in the paper reduces to its own input by construction, and no fitted value is relabeled as an independent finding. The endpoint-sensitivity limitation is explicitly acknowledged in Section 6.2 as a reproducibility concern, which further confirms that the authors treat the metric as empirical rather than definitionally tied to the result.
Assumptions & free parameters
free parameters (3)
- Bézier curve order n =
8
- Release lag =
2 frames (0.08 s)
- Weighting factor ell =
0, 3, 5, with best R-squared at 5
assumptions (4)
- domain assumption Ball speed is maximized at the moment of release
- domain assumption The sagittal plane (X-Z) captures the relevant curvature and lateral motion can be ignored
- domain assumption A smooth ball path is a meaningful proxy for shooting smoothness
- standard math Least-squares Bézier fitting and standard curvature calculus are valid for these noisy trajectories
Cite this review
Pith. "Pith review of Ball path curvature and in-game free throw shooting proficiency in the National Basketball Association." pith.science (2026). https://pith.science/paper/RGGDWPN7
@misc{pith2026250613779,
  author       = {Pith},
  title        = {Pith review of: Ball path curvature and in-game free throw shooting proficiency in the National Basketball Association},
  year         = {2026},
  howpublished = {\url{https://pith.science/paper/RGGDWPN7}},
  note         = {Machine review of arXiv:2506.13779}
}
read the original abstract
Basketball shooting coaches agree that smoother shooting motions are better, but there is less agreement about what "smooth" means quantitatively or what part of the shooting motion needs to be smooth. Using ball tracking data from the 2023-2024 National Basketball Association regular season, we explore the relationship between ball path curvature and free throw shooting performance. We fit B\'ezier curves to the ball tracking data in the sagittal plane and test different methods of calculating path curvature. We find that both max curvature and terminal curvature are negatively associated with shooting performance, but terminal curvature explains much more of the between-player variance in free throw shooting performance. This suggests that shooting coaches would be better off focusing on the smoothness at the end of the shot rather than at the beginning of the forward motion of the ball.
Figures


Figures from the paper (3 more)


Reference graph
Works this paper leans on
-
[1]
2023-24 NBA Player Stats : Totals
Basketball Reference (2024). 2023-24 NBA Player Stats : Totals . ://www.basketball-reference.com/leagues/NBA\_2024\_totals.html
work page 2024
-
[2]
Baydas, S., & Karakas, B. (2019). Defining a curve as a Bezier curve. Journal of Taibah University for Science\/ , 13\/ (1), 522--528
work page 2019
-
[3]
Button, C., Macleod, M., Sanders, R., & Coleman, S. (2003). Examining movement variability in the basketball free-throw action at different skill levels. Research Quarterly for Exercise and Sport\/ , 74\/ (3), 257--269
work page 2003
-
[4]
Haefner, J. (2010). 7 Tips To Improve Your Shooting Mechanics . ://www.usab.com/news/2014/01/7-tips-to-improve-your-shooting-mechanics
work page 2010
-
[5]
Hamilton, G. R., & Reinschmidt, C. (1997). Optimal trajectory for the basketball free throw. Journal of Sports Sciences\/ , 15\/ (5), 491--504
work page 1997
-
[6]
Kozar, B., Vaughn, R. E., Whitfield, K. E., Lord, R. H., & Dye, B. (1994). Importance of Free - Throws at Various Stages of Basketball Games . Perceptual and Motor Skills\/ , 78\/ (1), 243--248
work page 1994
-
[7]
Mullineaux, D. R., & Uhl, T. L. (2010). Coordination-variability and kinematics of misses versus swishes of basketball free throws. Journal of Sports Sciences\/ , 28\/ (9), 1017--1024
work page 2010
-
[8]
NBA announces multiyear partnership with Sportradar and Second Spectrum
National Basketball Association (2016). NBA announces multiyear partnership with Sportradar and Second Spectrum . ://pr.nba.com/nba-announces-multiyear-partnership-sportradar-second-spectrum/
work page 2016
Show all 13 references
-
[9]
Pakosz, P., Domaszewski, P., Konieczny, M., & B a czkowicz, D. (2021). Muscle activation time and free-throw effectiveness in basketball. Scientific Reports\/ , 11\/ , 7489
2021
-
[10]
Penny, R. (2016). The Overlooked Importance of Arm & Wrist Angles . ://www.breakthroughbasketball.com/fundamentals/shooting-arm-wrist-angle.html
2016
-
[11]
Slegers, N. (2022). Basketball shooting performance is maximized by individual-specific optimal release strategies. International Journal of Performance Analysis in Sport\/ , 22\/ (3), 393--406
2022
-
[12]
Slegers, N., & Love, D. (2024). The role of ball path curvature in basketball shooting accuracy. Journal of Sports Sciences\/ , 42\/ (21), 2052--2060
2024
-
[13]
M., & Silverberg, L
Tran, C. M., & Silverberg, L. M. (2008). Optimal release conditions for the free throw in men's basketball. Journal of Sports Sciences\/ , 26\/ (11), 1147--1155
2008
Reviewed August 7, 2026 · model on record in the stance chip above.
Discussion (0). Sign in to comment.