REVIEW 3 major objections 5 minor 61 references
Distinguishing Ram Pressure from Tidal Interactions: the Size-Shape Difference (SSD) measure
T0 review · 3 major / 5 minor · reviewed 2026-08-07 · deepseek-v4-flash
Pith's one-line read The paper claims that a new Size-Shape Difference (SSD) measure, which compares how far and in what shape young stars (<200 Myr) extend relative to an intermediate-age population (200–400 Myr), can distinguish ram pressure stripping from…
desk verdict A genuinely new morphological diagnostic for separating ram pressure from tides in simulations, with a real but non-fatal caveat about the star-formation recipe amplifying the signal. read the letter →
The pith
A machine-rendered reading of the paper's core claim, the machinery that carries it, and where it could break.
The reading
What carries the argument
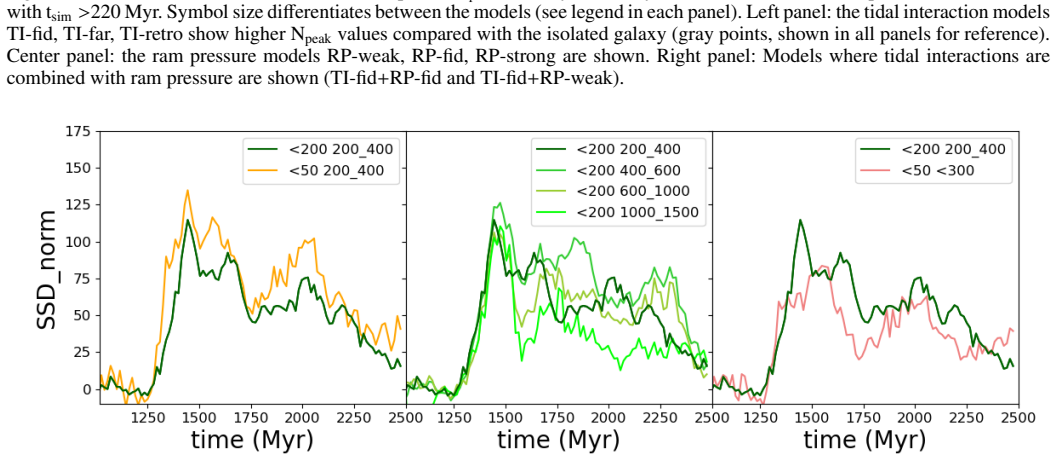
The load-bearing object is the Size-Shape Difference (SSD), computed from Lagrangian radii: for each 15-degree position-angle wedge around the disk center, one measures the radii containing 50, 75, 90, 95, and 99% of the young stars and of the intermediate-age stars, then sums the absolute differences between the two cohorts across all wedges: $SSD = \sum_{\theta=0^\circ}^{360^\circ} \sum_{i=1}^{5} |R_i^{\rm young}(\theta) - R_i^{\rm intermed}(\theta)|$. The mechanism it exploits is that young stars form from, and therefore map, the current dense-gas geometry, while the 200–400 Myr population records the older, less disturbed disk; ram pressure reshapes the gas on a few hundred Myr timescale, creating a measurable age-dependent size-shape mismatch, whereas a gravitational encounter perturbs gas and stars together.
What would settle it
Compare SSD distributions for a sample of galaxies with kinematically confirmed ram pressure tails and a matched sample of tidally interacting pairs without gas: if the two SSD distributions overlap substantially, the central claim fails; alternatively, run the same simulation with a star formation recipe that delays star formation by ~100 Myr or decouples it from the dense gas, and check whether the SSD separation between ram pressure and tidal models disappears.
Extended reading notes
Core claim
The central discovery is that ram pressure leaves a measurable, age-dependent size-shape mismatch that tidal encounters do not. Since stars younger than 200 Myr are born from the current gas distribution, ram pressure's compressive and stripping action makes the young stellar disk visibly smaller on the leading edge and more extended downwind relative to the 200–400 Myr population. The SSD quantifies this by summing, over 15-degree position-angle slices, the absolute differences in the 50%, 75%, 90%, 95%, and 99% Lagrangian radii of the two age cohorts. In the simulations the SSD of the fiducial ram-pressure model is typically about twice that of the isolated or tidally interacting disks (mean enhancement of 194% over isolated, with values rising 20% to 300%), while all tidal models stay close to the isolated control. Combined ram-pressure-plus-tidal runs give even higher SSD values, because the tidal encounter first builds an S-shaped spiral structure that ram pressure then distorts, pushing young stars far from the intermediate-age distribution. Adding a measurement of the number of significant spiral-arm peaks (Npeak), which tides preferentially excite to Npeak=2 while ram pressure typically gives a one-sided tail near Npeak=1, turns the two quantities into a 2D diagnostic that separates pure ram pressure, pure tides, and combined cases with little overlap.
Load-bearing premise
The SSD assumes that stars younger than 200 Myr form from, and faithfully trace, the current dense gas disk, so that when ram pressure compresses or strips the gas the young stellar disk changes shape relative to the 200–400 Myr population.
Editorial extensions
If this is right
- Ram pressure stripping can be diagnosed from a single optical morphology measurement, without resolving tidal bridges, gas tails, or requiring expensive radio or H-alpha confirmation.
- In dense environments where infalling galaxies experience tides and ram pressure simultaneously, the SSD still flags the ram pressure component, and with greater sensitivity than in the pure ram-pressure case.
- Combining SSD with the spiral-arm peak count separates isolated, tidally interacting, and ram-pressure-stripped galaxies over the simulated parameter space, including weak ram pressure cases that SSD alone would miss.
- The SSD is robust to moderate changes in age-bin choice, to disk inclination after a simple correction, and to variations in ram-pressure wind angle, making it a viable candidate for application to IFU stellar-population maps.
- Because the SSD responds to the current gas geometry, it can track the time evolution of an interaction, peaking during the cometary phase and remaining elevated after truncation as long as the intermediate-age bin is chosen older than the truncation epoch.
Reading between the lines
- If the age-tracing assumption transfers to real galaxies, the SSD could be built from broad-band filters (e.g., a blue/UV filter tracing recent star formation versus a redder filter), since the paper's non-exclusive age-bin test shows ram pressure is still detectable; that would make the diagnostic available to large imaging surveys without IFU.
- The SSD might be inverted to estimate ram-pressure strength or infall phase: the paper only separates mechanisms, but the monotonic rise of SSD with wind speed (RP-weak < RP-fid < RP-strong) hints at a quantitative calibration.
- Comparing SSD across several intermediate-age bins (200-400, 400-600, 600-1000 Myr) could encode the time since the gas disk was truncated, something the paper shows qualitatively in the face-on wind case but does not develop.
- The Npeak-type spiral-arm counting requires a matched isolated control disk; in observations, where no such control exists, Fourier-based spiral amplitudes (as the paper mentions) could substitute, so a public implementation of the SSD itself may be the more portable piece.
Editorial analysis
A structured set of objections, weighed in public.
Referee Report
Summary. The paper introduces the Size-Shape Difference (SSD) measure, which compares the angular distributions of Lagrangian radii of a young (<200 Myr) stellar population with an intermediate-age (200-400 Myr) population, to distinguish ram pressure stripping from gravitational-only tidal interactions in simulated disk galaxies. In a suite of wind-tunnel and fly-by simulations with a single disk galaxy model, the authors find that the SSD is substantially elevated for ram-pressure cases, close to isolated values for tidal cases, and even more elevated when both mechanisms act together. They also show that combining SSD with a spiral-arm peak count (Npeak) separates the classes more cleanly. Robustness tests include variations in ram pressure strength, tidal encounter geometry, disk inclination, wind angle, time-varying wind, resolution and star formation threshold, and age bin definitions.
Significance. If the claimed separation holds for realistic star formation and more diverse galaxy models, the SSD provides a practical morphological discriminator of ram pressure in jellyfish-candidate samples, where tidal asymmetries are a major contaminant. The paper's main strengths are the clarity of the measure, the broad parameter exploration, and the explicit robustness tests; the use of controlled simulations with a single model galaxy is appropriate for an initial methods paper. The central result is, however, conditional on the subgrid star formation recipe and on the completeness of the resolution test, as discussed below.
major comments (3)
- [Section 4.1 and Section 2.2] The central claim that the SSD separates ram pressure from tidal interactions rests on the assumption that young stars trace the gas distribution that ram pressure modifies. The test that is meant to guard against the artificial choice of density threshold (0.1 H/cc at 270 pc) only reruns the RP-fid and isolated models, not any tidal model. Consequently, even if the RP enhancement over isolated survives at level 12 with threshold 1.0 H/cc, the separation margin between the RP and TI classes is not verified under the modified recipe; a higher SSD for the TI model at these settings could close the gap. Additionally, the tested threshold of 1.0 H/cc is still orders of magnitude below the densities of self-gravitating molecular gas typically responsible for star formation, so the test does not probe the regime where young stars would trace dense, ram-pressure-resistant clumps. Please rerun at least the TI-fid model at the higher resolution and threshold, or otherwise argue why the TI response is insensitive to the star formation recipe.
- [Section 3.3 and Figure 7] The claimed improvement from combining SSD with Npeak is not quantified. The peak-detection thresholds (S/N > 3, minimum width 105 degrees) are chosen by visual inspection, and the 'clean separation' in the SSD-Npeak plane is asserted from plots of snapshot points rather than measured by a classification statistic (e.g., overlap fraction, completeness and false-positive rates in distinguishing TI from RP or control). Since conclusion item 3 recommends this 2D combination as the best method, please provide a quantitative separability measure and show the sensitivity of the separation to reasonable variations of the S/N and width thresholds.
- [Section 2.1 and throughout] The entire study uses a single initial disk galaxy model (one mass, one gas fraction, one structural profile). The robustness tests in Sections 4.2-4.7 vary the environmental conditions and the age bins, but not the galaxy properties. The abstract's statement that the SSD 'can effectively distinguish' is therefore demonstrated only for this one model; the paper should either add a second galaxy model with a different gas fraction or mass, or explicitly restrict the claim to galaxies similar to the simulated one and discuss the expected dependencies (e.g., on gas fraction).
minor comments (5)
- [Section 4.1] The sentence 'The SSD values of both the isolated and RP-fid model are found to be slightly smaller than in the higher resolution models' appears to be a typo; the following parenthesis indicates the comparison is to the standard resolution, not the higher resolution. Please clarify the intended comparison.
- [Section 2.3] The phrase 'covers the fully-zface of cube' is unclear; it should probably read 'covers the full z-face of the cube'.
- [Equation (1)] The summation index i is used without being defined; please state explicitly that i runs from 1 to 5 corresponding to the 50, 75, 90, 95, and 99 percent Lagrangian radii.
- [Figure 4, far-right panel] The legend labels the inclination-corrected model as 'RPS-fid 60 corr' while the text refers to 'RP-fid 60 corr'; please make the notation consistent.
- [Section 3.2] Please state explicitly that the disk center determined from the intermediate-age stars is recomputed at each snapshot and used for both populations in all position-angle slices; this is implied but not stated.
Circularity Check
The SSD-alone separation is not circular, but the claimed SSD+Npeak enhancement is an in-sample calibration: the peak thresholds are chosen on the same simulations used to demonstrate the classifier.
-
fitted input called prediction
[Sec. 3.3 (peak criteria) and Sec. 4.6 (combined SSD-Npeak demonstration)]
"To evaluate if a peak is significant or simply noise, we use a double criteria. We assume that a genuine peak must have a peak height with a minimum signal-to-noise (S/N>3), and it must have a minimum width (105◦) as the environmentally induced features tend to be quite broad in position angle, whereas noisy features are more narrow. In practice, we find this choice of values for the parameters is effective at helping to distinguish the isolated model from a model undergoing ram pressure or tides (as we will demonstrate in Sect. 4.6)."
The peak-detection thresholds (S/N>3, minimum width 105 degrees) and the choice of the 90/95/99% Lagrangian radii for mean Npeak are selected by inspecting the same simulated models (isolated, TI, RP, and combined runs) whose separation is then reported as a demonstration in Fig. 7. The noise baseline is also defined from the isolated control simulation, so the significance criteria are calibrated to those specific runs. Applying these tuned criteria to the same runs and then presenting the resulting clean separation in the SSD-Npeak plane as evidence that the SSD is 'further enhanced' when combined with Npeak is an in-sample evaluation: the classifier's success is partly built into the threshold choices rather than being an independent prediction.
full rationale
The central SSD definition (Eq. 1) is not circular: it is a direct morphological statistic comparing <200 Myr and 200-400 Myr stellar Lagrangian radii, and it does not encode the RP/TI labels. The finding that RP-fid yields higher SSD values than TI-fid is an empirical outcome of the controlled simulations, supported by robustness tests over age bins (Sec. 4.7), Lagrangian radii (Appendix D), inclination (Sec. 4.4), and a resolution/star-formation-threshold rerun (Sec. 4.1). Self-citations such as Bellhouse et al. 2021 and Marasco et al. 2016 are contextual and not load-bearing for the SSD derivation. The specific circular element is confined to the auxiliary SSD+Npeak claim: the S/N>3 and 105-degree peak criteria, the choice of the outermost Lagrangian radii for Npeak, and the noise definition from the isolated control are all calibrated on the same model runs whose separation in Fig. 7 is then presented as a demonstration, so that enhancement is in-sample. Two additional limitations (not circularity) weaken the evidence: the Sec. 4.1 resolution test reruns only the RP-fid and isolated control models, not the TI model, so the separation margin's resolution robustness is not fully verified; and the 0.1 H/cc star-formation threshold is far below typical dense-gas densities, which is a physical plausibility risk for the young-stars-trace-gas mechanism. Neither limitation makes the SSD-alone derivation a tautology, so the overall circularity is partial rather than total.
Assumptions & free parameters
free parameters (5)
- Age bins for young and intermediate populations =
<200 Myr and 200-400 Myr
- Lagrangian radius percentages =
50, 75, 90, 95, 99%
- Position angle slice width =
15 degrees
- Peak detection signal-to-noise threshold =
S/N > 3
- Peak minimum width =
105 degrees
assumptions (4)
- domain assumption The DICE/Ramses galaxy model with the adopted star formation and feedback recipes produces realistic star-gas coupling on 270 pc scales.
- domain assumption A constant, uniform wind-tunnel ram pressure approximates cluster infall conditions for the fiducial result.
- domain assumption The gas-free secondary galaxy represents gravitational-only tidal encounters that can be confused with ram pressure.
- domain assumption The isolated control disk is a valid null hypothesis for the Npeak noise measurement.
Cite this review
Pith. "Pith review of Distinguishing Ram Pressure from Tidal Interactions: the Size-Shape Difference (SSD) measure." pith.science (2026). https://pith.science/paper/447O2F7L
@misc{pith2026250613884,
  author       = {Pith},
  title        = {Pith review of: Distinguishing Ram Pressure from Tidal Interactions: the Size-Shape Difference (SSD) measure},
  year         = {2026},
  howpublished = {\url{https://pith.science/paper/447O2F7L}},
  note         = {Machine review of arXiv:2506.13884}
}
read the original abstract
Context: In dense environments, disk galaxies can be subjected to tidal interactions with other galaxies and/or ram pressure stripping. Some morphological features are clearly associated with one or the other interaction (e.g. tidal bridges vs long one-sided linear gas tails). But, under certain circumstances, both mechanisms can result in morphological features that could be confused, such as lopsided or asymmetric disks and unwinding spiral arms. Aims: Our aim is to develop new measures for application to asymmetric galaxies of this type that distinguish gravitational-only tidal interactions from ram pressure stripping, and that can be applied directly to simulations, and potentially to observations. Methods: We define a new measure for galaxies called the Size-Shape Difference (SSD) measure. This measure is sensitive to differences in the size and shape of a younger stellar population (<200 Myr) compared to that of an intermediate age stellar population (200-400 Myr). We use numerical simulations of galaxies undergoing gravitational-only tidal interactions and/or undergoing ram pressure stripping to test the measure. Results: Because ram pressure tends to directly alter the gas distribution, the younger stellar population (which best traces out the gas distribution) tends to change shape and morphology with respect to the intermediate age population. The SSD measure is sensitive to this change, and we find it can effectively distinguish between ram pressure and gravitational-only tidal encounters. In fact, we find it is even more effective when a combination of a tidal interaction and ram pressure has occurred together, as may arise in dense environments. As tidal interactions tend to enhance the spiral structure in disk galaxies, the effectiveness of the SSD measure is further enhanced when combined with a measure of the strength of the spiral arms.
Figures


Figures from the paper (5 more)


Reference graph
Works this paper leans on
-
[1]
Bellhouse, C., McGee, S. L., Smith, R., et al. 2021, MNRAS, 500, 1285
work page 2021
-
[2]
2022, A&A Rev., 30, 3
Boselli, A., Fossati, M., & Sun, M. 2022, A&A Rev., 30, 3
2022
-
[3]
& Gavazzi, G
Boselli, A. & Gavazzi, G. 2006, PASP, 118, 517
2006
-
[4]
& Valtonen, M
Byrd, G. & Valtonen, M. 1990, ApJ, 350, 89
1990
-
[5]
Byrd, G. G. & Howard, S. 1992, AJ, 103, 1089
1992
-
[6]
2018, MNRAS, 476, 875
Catinella, B., Saintonge, A., Janowiecki, S., et al. 2018, MNRAS, 476, 875
2018
-
[7]
Cayatte, V ., Kotanyi, C., Balkowski, C., & van Gorkom, J. H. 1994, AJ, 107, 1003
work page 1994
-
[8]
Conselice, C. J., Gallagher, III, J. S., & Wyse, R. F. G. 2001, ApJ, 559, 791
work page 2001
Show all 61 references
-
[9]
2021, PASA, 38, e035
Cortese, L., Catinella, B., & Smith, R. 2021, PASA, 38, e035
2021
-
[10]
2007, MNRAS, 376, 157
Cortese, L., Marcillac, D., Richard, J., et al. 2007, MNRAS, 376, 157
2007
-
[11]
P., Jaffé, Y
Crossett, J. P., Jaffé, Y . L., McGee, S. L., et al. 2024, arXiv e-prints, arXiv:2412.10060
2024 arXiv
-
[12]
Davies, R. D. & Lewis, B. M. 1973, MNRAS, 165, 231 De Lucia, G., Weinmann, S., Poggianti, B. M., Aragón-Salamanca, A., & Zarit- sky, D. 2012, MNRAS, 423, 1277
1973
-
[13]
& Baba, J
Dobbs, C. & Baba, J. 2014, PASA, 31, e035
2014
-
[14]
L., Theis, C., Pringle, J
Dobbs, C. L., Theis, C., Pringle, J. E., & Bate, M. R. 2010, Monthly Notices of the Royal Astronomical Society, 403, 625
2010
-
[15]
1980, ApJ, 236, 351
Dressler, A. 1980, ApJ, 236, 351
1980
-
[16]
N., & Edge, A
Ebeling, H., Stephenson, L. N., & Edge, A. C. 2014, ApJ, 781, L40
2014
-
[17]
Elmegreen, D. M. & Elmegreen, B. G. 1982, MNRAS, 201, 1021
1982
-
[18]
2011, A&A, 528, A46
Fumagalli, M., Gavazzi, G., Scaramella, R., & Franzetti, P. 2011, A&A, 528, A46
2011
-
[19]
2006, A&A, 446, 839
Gavazzi, G., Boselli, A., Cortese, L., et al. 2006, A&A, 446, 839
2006
-
[20]
2002, A&A, 396, 449
Gavazzi, G., Boselli, A., Pedotti, P., Gallazzi, A., & Carrasco, L. 2002, A&A, 396, 449
2002
-
[21]
2013, A&A, 553, A89
Gavazzi, G., Fumagalli, M., Fossati, M., et al. 2013, A&A, 553, A89
2013
-
[22]
Gunn, J. E. & Gott, J. R. I. 1972, ApJ, 176, 1
1972
-
[23]
& Madau, P
Haardt, F. & Madau, P. 1996,\apj, 461, 20
1996
-
[24]
2018, ApJ, 866, 78
Han, S., Smith, R., Choi, H., et al. 2018, ApJ, 866, 78
2018
-
[25]
Haynes, M. P. & Giovanelli, R. 1986, ApJ, 306, 466
1986
-
[26]
Hester, J. A. 2010, ApJ, 720, 191
2010
-
[27]
K., Tammann, G
Huchtmeier, W. K., Tammann, G. A., & Wendker, H. J. 1976, A&A, 46, 381
1976
-
[28]
Kennicutt, R. C. 1983, ApJ, 272, 54
1983
-
[29]
A., Schaye, J., et al
Marasco, A., Crain, R. A., Schaye, J., et al. 2016, MNRAS, 461, 2630
2016
-
[30]
2005, MNRAS, 364, 607
Mastropietro, C., Moore, B., Mayer, L., et al. 2005, MNRAS, 364, 607
2005
-
[31]
L., Balogh, M
McGee, S. L., Balogh, M. L., Bower, R. G., Font, A. S., & McCarthy, I. G. 2009, MNRAS, 400, 937
2009
-
[32]
2016, MNRAS, 455, 2994
McPartland, C., Ebeling, H., Roediger, E., & Blumenthal, K. 2016, MNRAS, 455, 2994
2016
-
[33]
1983, ApJ, 264, 24
Merritt, D. 1983, ApJ, 264, 24
1983
-
[34]
2021, AJ, 161, 268
Michea, J., Pasquali, A., Smith, R., et al. 2021, AJ, 161, 268
2021
-
[35]
1996, Nature, 379, 613
Moore, B., Katz, N., Lake, G., Dressler, A., & Oemler, A. 1996, Nature, 379, 613
1996
-
[36]
1998, ApJ, 495, 139
Moore, B., Lake, G., & Katz, N. 1998, ApJ, 495, 139
1998
-
[37]
F., Frenk, C
Navarro, J. F., Frenk, C. S., & White, S. D. M. 1997, ApJ, 490, 493
1997
-
[38]
N., Keel, W
Owen, F. N., Keel, W. C., Wang, Q. D., Ledlow, M. J., & Morrison, G. E. 2006, AJ, 131, 1974
2006
-
[39]
S., Couch, W
Owers, M. S., Couch, W. J., Nulsen, P. E. J., & Rand all, S. W. 2012, ApJ, 750, L23
2012
-
[40]
Y ., Ho, L
Peng, C. Y ., Ho, L. C., Impey, C. D., & Rix, H.-W. 2002, AJ, 124, 266
2002
-
[41]
2014, A&A, 562, A1
Perret, V ., Renaud, F., Epinat, B., et al. 2014, A&A, 562, A1
2014
-
[42]
Pettitt, A. R. & Wadsley, J. W. 2018, MNRAS, 474, 5645
2018
-
[43]
M., Fasano, G., Omizzolo, A., et al
Poggianti, B. M., Fasano, G., Omizzolo, A., et al. 2016, AJ, 151, 78
2016
-
[44]
M., Gullieuszik, M., Tonnesen, S., et al
Poggianti, B. M., Gullieuszik, M., Tonnesen, S., et al. 2019, MNRAS, 482, 4466
2019
-
[45]
M., Moretti, A., Gullieuszik, M., et al
Poggianti, B. M., Moretti, A., Gullieuszik, M., et al. 2017, ApJ, 844, 48
2017
-
[46]
Roberts, I. D. & Parker, L. C. 2020, MNRAS, 495, 554
2020
-
[47]
D., van Weeren, R
Roberts, I. D., van Weeren, R. J., McGee, S. L., et al. 2021b, arXiv e-prints, arXiv:2106.06315
-
[48]
& Brüggen, M
Roediger, E. & Brüggen, M. 2007, MNRAS, 380, 1399
2007
-
[49]
L., Smith, R., et al
Salinas, V ., Jaffé, Y . L., Smith, R., et al. 2024, Monthly Notices of the Royal Astronomical Society, 533, 341
2024
-
[50]
L., & del Pino, A
Semczuk, M., Łokas, E. L., & del Pino, A. 2017, ApJ, 834, 7
2017
-
[51]
2016, ApJ, 833, 109
Smith, R., Choi, H., Lee, J., et al. 2016, ApJ, 833, 109
2016
-
[52]
M., Manrique, A., García-Gómez, C., et al
Solanes, J. M., Manrique, A., García-Gómez, C., et al. 2001, ApJ, 548, 97
2001
-
[53]
S., Steinhardt, C
Speagle, J. S., Steinhardt, C. L., Capak, P. L., & Silverman, J. D. 2014, ApJS, 214, 15
2014
-
[54]
Sun, M., Donahue, M., & V oit, G. M. 2007, ApJ, 671, 190
2007
-
[55]
Sutherland, R. S. & Dopita, M. A. 1993, ApJS, 88, 253
1993
-
[56]
2002, A&A, 385, 337
Teyssier, R. 2002, A&A, 385, 337
2002
-
[57]
K., Klein, R
Truelove, J. K., Klein, R. I., McKee, C. F., et al. 1997, ApJ, 489, L179
1997
-
[58]
A., Tissera, P
Varela-Lavin, S., Gómez, F. A., Tissera, P. B., et al. 2023, MNRAS, 523, 5853
2023
-
[59]
M., Smith, R., et al
Vulcani, B., Poggianti, B. M., Smith, R., et al. 2022, ApJ, 927, 91
2022
-
[60]
2008, ApJ, 688, 918
Yoshida, M., Yagi, M., Komiyama, Y ., et al. 2008, ApJ, 688, 918
2008
-
[61]
2013, ApJ, 772, 135 Article number, page 15 of 21 A&A proofs:manuscript no
Zaritsky, D., Salo, H., Laurikainen, E., et al. 2013, ApJ, 772, 135 Article number, page 15 of 21 A&A proofs:manuscript no. aanda Appendix A: Varying the Wind Angle In the main paper, we consider only cases of edge-on ram pressure stripping. In this appendix, we additionally c...
2001
Reviewed August 7, 2026 · model on record in the stance chip above.
Discussion (0). Sign in to comment.