REVIEW 4 major objections 5 minor 58 references
A Stochastic Differential Equation Framework for Modeling Queue Length Dynamics Inspired by Self-Similarity
T0 review · 4 major / 5 minor · reviewed 2026-08-15 · deepseek-v4-flash
Pith's one-line read This paper proposes a stochastic differential equation that reproduces both the distribution and the 1/f power spectrum of queue lengths at signalized intersections, and claims it is the first equation-based model for queue dynamics.
desk verdict A novel SDE for queue lengths that shows plausible fits but is held back by an asserted micro-to-macro derivation, an unreported Hurst exponent, and circular validation. read the letter →
The pith
A machine-rendered reading of the paper's core claim, the machinery that carries it, and where it could break.
The reading
What carries the argument
The central object is the SDE itself, composed of three ingredients. Mean reversion toward the periodic mean $\phi_t$ encodes the daily traffic demand and the negative feedback introduced by adaptive signal control. Multiplicative noise $\gamma_t Y_t$ makes fluctuations scale with queue size and is motivated microscopically: if vehicle interarrival times follow a lognormal-type multiplicative process, the reciprocal instantaneous flow inherits multiplicative noise via Itô's lemma, and the authors assert that this survives aggregation to cycle level. Fractional Brownian motion $W_t^H$ supplies correlated increments, with $H > 0.5$ producing the long-memory, $1/f$-type spectral structure observed in the data. The volatility $\gamma_t$ is itself an Ornstein–Uhlenbeck square-root process, adding stochastic volatility.
What would settle it
Take a calibrated model for one intersection, simulate a 90-day trajectory, and compare the PSD and the empirical distribution against the observed time series on days excluded from calibration; the central claim fails if the simulated spectrum no longer shows the observed 1/f power-law decay or if a Kolmogorov–Smirnov test on held-out daily distributions rejects the match. A more direct check is to estimate the Hurst exponent from the data by rescaled-range or detrended fluctuation analysis and verify that the fitted H parameter reproduces it.
Extended reading notes
Core claim
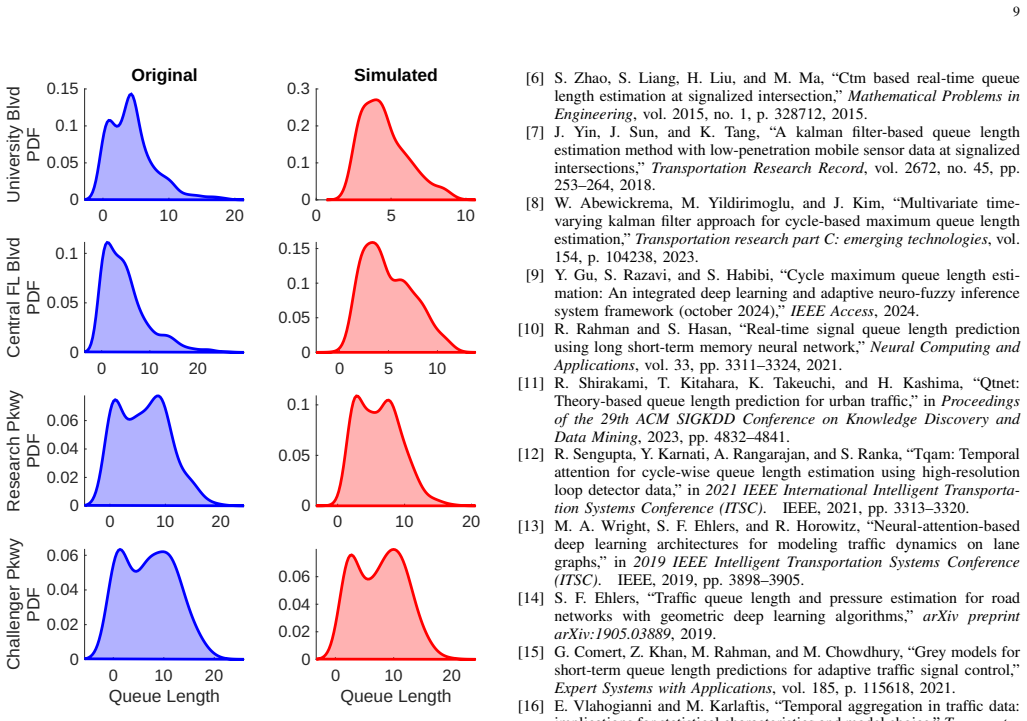
The paper's central claim is that queue length dynamics at a signalized intersection can be described by $dY_t = \mu(\phi_t - Y_t)\,dt + \gamma_t Y_t\,dW_t^H$, where $Y_t$ is the maximum queue length in a cycle, $\phi_t$ is a periodic mean estimated from spectral decomposition, $\gamma_t$ follows a mean-reverting square-root diffusion, and $W_t^H$ is fractional Brownian motion. The authors report that simulations calibrated per intersection reproduce the empirical PDF and preserve the roughly $1/f$ power-law decay seen in the data, with Pearson correlations above 0.74 between simulated and observed series over a week. The intended contribution is not a first-principles derivation but a statistically faithful, transparent equation that captures quasiperiodicity, multiplicative fluctuations, and long-range dependence.
Load-bearing premise
The load-bearing premise is that multiplicative noise at the vehicle-headway level remains multiplicative after aggregation over a signal cycle, so that the macroscopic SDE inherits its noise structure from the microscopic point-process model; no aggregation theorem or derivation is supplied for that step.
Editorial extensions
If this is right
- If the SDE is right, a handful of parameters per intersection—mean-reversion speed, volatility dynamics, Hurst exponent, and the periodic mean—encode the statistical behavior of queue length time series.
- The model gives a generative simulator: one can draw new queue-length trajectories with realistic distributions and spectra without running a traffic microsimulation.
- Its interpretable structure separates deterministic daily demand from stochastic fluctuation, allowing the two effects to be analyzed and controlled independently.
- Because the SDE reproduces statistical signatures rather than exact trajectories, it is naturally suited as a physics-informed prior or regularizer for neural-network predictors.
- The calibrated parameter set could serve as a compact descriptor for comparing the behavior of different signalized intersections.
Reading between the lines
- A testable extension the paper leaves implicit is to use the SDE for short-horizon queue-length forecasting, conditioning on the current estimated state and $\gamma_t$, and benchmark it against the deep-learning baselines the paper cites.
- The paper does not derive the relationship between the fitted Hurst exponent and the measured 1/f slope; a natural check is whether the Hurst exponent estimated from the data by detrended fluctuation analysis matches the calibrated value across intersections.
- One could stress the microscopic-to-macroscopic bridge by building the cumulative arrival process explicitly from a lognormal interarrival model and verifying numerically that the aggregated process's noise is indeed multiplicative before trusting the SDE as an equation of motion.
Signed reviews
Editorial analysis
A structured set of objections, weighed in public.
Referee Report
Summary. The paper proposes a stochastic differential equation (SDE) model for cycle-to-cycle queue length dynamics at signalized intersections. The model is dY_t = μ(φ_t − Y_t) dt + γ_t Y_t dW_t^H, combining mean reversion toward a periodic seasonal mean φ_t, multiplicative noise with stochastic volatility γ_t, and fractional Brownian motion W_t^H. The authors motivate the model from a microscopic point-process model of vehicle arrivals whose interarrival times follow multiplicative noise, then assert that the cumulative queue process inherits multiplicative noise. They calibrate the model separately for four intersections on the Alafaya Trail corridor using Nelder–Mead optimization of RMSE, extract the seasonal component from the same time series, simulate the SDE, and compare simulated trajectories, Pearson correlations, power spectral densities, and probability density functions with the observed data. The central claims are that the model replicates the empirical PDF and 1/f-type PSD and that it is the first equation-based model for queue dynamics.
Significance. If the proposed SDE were properly derived, calibrated with a reported Hurst exponent, and validated on independent data, it could provide a compact generative description of queue length fluctuations that might be useful for simulation, prediction, and integration with physics-informed learning. The empirical observation of 1/f-like spectra in cycle-level queue lengths at multiple signalized intersections is a valuable data point in itself. However, as presented, the central derivation from Eqs. (2)–(5) to Eq. (7) is an unsupported assertion, the Hurst exponent H is never estimated or reported, the volatility process is mis-specified, and the validation is largely circular because the seasonal mean is extracted from the same series used for fitting and evaluation. These issues prevent the main claim of a physically grounded equation-based model from being substantiated. The paper also does not provide simulation code or a reproducible numerical scheme for the fractional Brownian motion, which is essential for independent verification.
major comments (4)
- [Section IV-B3, Eqs. (2)–(7)] The transition from the microscopic multiplicative-noise model of interarrival times to the macroscopic SDE for queue length is not derived. Eq. (5) is obtained from Eqs. (2)–(4) by Itô's lemma, but the move from Eq. (5) to Eq. (7) rests solely on the sentence "in the cumulative process, the noise will still remain multiplicative." No aggregation theorem, limit argument, or scaling analysis is supplied. The cumulative sum of many multiplicative random variables need not remain multiplicative, and the mean-reversion term μ(φ_t − Y_t) and the fractional Brownian driver are introduced at this step without derivation. Consequently, Eq. (7) is not a derived equation of queue dynamics but an independently chosen phenomenological model, which undermines the paper's central claim of an equation-based model emerging from microscopic traffic behavior.
- [Section IV-C, Table I, and Fig. 9] The Hurst exponent H in Eq. (7) is never estimated, reported, or listed in Table I, and no discrete-time simulation scheme for the fractional Brownian motion integral is provided. The PSD of a fractional Gaussian noise is determined by H, so the 1/f-type match claimed in Fig. 9 cannot be reproduced by the reader and cannot be attributed to the model rather than to an unquantified choice of H. Since H is the parameter that controls the self-similarity and long-range dependence that the paper emphasizes, its omission makes the validation of Eq. (7) incomplete and the simulated PSD a genuinely unverifiable result.
- [Section IV-B3, Eq. (8)] Eq. (8) is described as a "mean-reverting Ornstein–Uhlenbeck-type square-root diffusion process," but the equation shown is dγ(t) = κ(γ̄ − γ(t)) dt + σγ dW_t, which is an additive-noise Ornstein–Uhlenbeck process. It is not a square-root diffusion (Cox–Ingersoll–Ross type), and it does not enforce γ(t) ≥ 0. The constraint "γ(t) ≥ 0" is stated but no mechanism (reflecting boundary, transformation, or parameter restriction) is given. If the simulated γ(t) crosses zero, the multiplicative noise term γ_t Y_t changes sign, which is not discussed and may alter the qualitative behavior of the model.
- [Section IV-C, validation and Figs. 7–10] The model is not independently validated. The seasonal trend φ_t is extracted by spectral decomposition of the same zero-mean queue length time series that is later used for all comparisons, and the parameters θ are fitted by minimizing the RMSE between the simulated trajectory and that same empirical series. Under these conditions, the simulated process is constructed to follow the empirical periodic mean and is optimized to track the empirical path, so the reported Pearson correlations, PDF overlap, and PSD similarity in Figs. 7–10 are largely by construction. The paper does not report any out-of-sample or hold-out evaluation, and it does not compare the fitted model's performance against simpler benchmarks (e.g., a periodic mean plus noise of known distribution). The validation therefore does not support the claim that the specific SDE structure, rather than the fitted seasonal component, is responsible for the observed agreement.
minor comments (5)
- [General] There are numerous typos and grammatical errors, e.g., "Alafya" for "Alafaya", "Nyquiest" for "Nyquist", "Instantenous" for "Instantaneous", "becuase" for "because", and incomplete sentences such as "Based on the finding we" at the start of Section IV.
- [Section II-A] The reference "Hinguich and Musha" should be "Higuchi and Musha" (Musha and Higuchi, 1976); the citation given as [20] in the text appears with reversed author order.
- [Section II-B] The text mentions "models like Hull-White and Viscek" but does not define these models or cite the relevant references; presumably "Viscek" refers to the Vicsek model, but this is unclear in the current form.
- [Section IV-B2, Eq. (6)] Eq. (6) defines X_n as the accumulated volume in interval n, but the subsequent discussion identifies X_n with the maximum queue length Y_t in a cycle without addressing the distinction between total arrivals during the cycle and the maximum number of queued vehicles, which is a physical mismatch that the stochastic term is invoked to cover.
- [Section IV-D, Fig. 8] The figure caption states that a reference line with a 45-degree slope is included, but the axes of the scatter plot have different scales after smoothing; the claim that "closer alignment of points along this line indicates better model performance" is therefore not geometrically calibrated.
Circularity Check
The reported validation is partly circular: the seasonal mean φ_t and all parameters are fit to the same queue series later used for comparison, so the simulated trajectory's mean is inherited by construction.
-
fitted input called prediction
[Section IV-C ('Model Calibration and Validation'), 'Seasonality Extraction' and 'Objective Function' paragraphs; Section IV-D, Figs. 8-10.]
"To replicate the observed queue dynamics at signalized intersections, we calibrated the parameters of a stochastic model through numerical optimization... a seasonal trend ϕt was extracted via spectral decomposition. ... A Fourier transform was subsequently applied to the zero-mean time series, and the top 12 harmonics surrounding the dominant frequency were retained to reconstruct the seasonal component. ... The model parameters were estimated by minimizing the root-mean-square error (RMSE) between the simulated queue length trajectory and the empirical data."
The time-varying mean ϕt in Eq. (7) is reconstructed from the very same queue-length series that is later used as the 'validation' target: the paper takes a spectral decomposition of the zero-mean target series, retains the top 12 harmonics as ϕt, and then optimizes the remaining parameters by RMSE against that same target while simulating from the same initial condition. Consequently the deterministic part of the simulated Y_t inherits the target series' daily-periodic mean by construction. The reported high Pearson correlations (r = 0.74-0.88 in Fig. 8) and the location/center agreement of the PDF comparison (Fig. 10) are therefore in-sample fitting results, not independent confirmation that the equation predicts queue dynamics.
full rationale
The paper's micro-to-macro 'derivation' from Eqs. (2)-(5) to Eq. (7) rests on the sentence 'in the cumulative process, the noise will still remain multiplicative'; that is an unproved assertion rather than a circular reduction, so it is a deductive gap but not itself a circularity. The main circular element is the calibration/validation protocol: ϕt is extracted by spectral decomposition of the same empirical queue series used as the comparison target, and the remaining parameters are minimized in RMSE against that same series, with simulation started at the same initial condition. Therefore the deterministic component of the simulated trajectory reproduces the target mean by construction, and the high trajectory correlations plus the mean location of the PDF comparison are in-sample fitting artifacts. The PSD claim is additionally weakened because the Hurst exponent H controlling the fractional-Brownian spectral slope is not estimated or reported anywhere, and Eq. (8), labeled a 'square-root diffusion,' is actually an additive-noise Ornstein-Uhlenbeck process with no enforcement of γ(t) ≥ 0; these are correctness/reproducibility concerns rather than circularity. No load-bearing self-citation was found: reference [50] is used only for identifying periodic components and does not force the central result. Weighting the fitted-mean-in-validation issue against the genuinely stochastic PDF/PSD content, the central 'replicates' claim is only partially circular, giving a score of 6.
Assumptions & free parameters
free parameters (9)
- μ (mean-reversion speed of Y_t) =
fitted, value not reported beyond initial 0.3
- γ0 (initial volatility) =
fitted, initial 0.1
- κ (mean-reversion rate of γ_t) =
fitted, initial 0.1
- σγ (volatility of volatility) =
fitted, initial 0.05
- γ̄ (long-run mean volatility) =
fitted, initial 0.2
- μ_amp (seasonal trend amplitude) =
set to empirical std dev. initially; fitted
- μ_base (seasonal trend baseline) =
set to empirical mean initially; fitted
- Hurst exponent H =
not reported / not in calibration table
- Fourier harmonics for φ_t (top 12 amplitudes/phases) =
estimated from the empirical ACF/FFT of the same time series
assumptions (5)
- domain assumption Vehicle interarrival times follow a multiplicative-noise process dτ_k = μτ_k dk + στ_k dW_k (Eq 2).
- ad hoc to paper The cumulative process over a cycle preserves multiplicative noise, so Y_t obeys dY_t = μ(φ_t-Y_t)dt + γ_t Y_t dW_t^H.
- domain assumption Queue length is approximately the accumulated flow during the cycle, with leftover vehicles and green-phase arrivals absorbed by the stochastic term.
- standard math Fractional Brownian motion with H in (0,1) is a valid driver for the queue SDE, and the stochastic integral with fBm is well-defined.
- ad hoc to paper The volatility process Eq 8 dγ = κ(γ̄-γ)dt + σγ dW with γ≥0 keeps volatility nonnegative.
Cite this review
Pith. "Pith review of A Stochastic Differential Equation Framework for Modeling Queue Length Dynamics Inspired by Self-Similarity." pith.science (2026). https://pith.science/paper/OCXDMX4R
@misc{pith2026250614059,
  author       = {Pith},
  title        = {Pith review of: A Stochastic Differential Equation Framework for Modeling Queue Length Dynamics Inspired by Self-Similarity},
  year         = {2026},
  howpublished = {\url{https://pith.science/paper/OCXDMX4R}},
  note         = {Machine review of arXiv:2506.14059}
}
read the original abstract
This article develops a stochastic differential equation (SDE) for modeling the temporal evolution of queue length dynamics at signalized intersections. Inspired by the observed quasiperiodic and self-similar characteristics of the queue length dynamics, the proposed model incorporates three properties into the SDE: (i) mean reversion with periodic mean, (ii) multiplicative noise, and (iii) fractional Brownian motion. It replicates key statistical features observed in real data, including the probability distribution function (PDF) and PSD of queue lengths. To our knowledge, this is the first equation-based model for queue dynamics. The proposed approach offers a transparent, data-consistent framework that may help inform and enhance the design of black-box learning algorithms with underlying traffic physics.
Figures


Figures from the paper (4 more)


Reference graph
Works this paper leans on
-
[1]
Q. Li, Z. Liu, L. Yao, H. Li, G. Xiong, and Y . Zhang, “Traffic signal coordinated control model for long arterial based on traffic flow spatiotemporal characteristics,” Transportation Letters, pp. 1–16, 2025
work page 2025
-
[2]
Traffic state estimation near signalized intersections,
H. Maripini, A. Khadhir, and L. Vanajakshi, “Traffic state estimation near signalized intersections,” Journal of Transportation Engineering, Part A: Systems, vol. 149, no. 5, p. 03123002, 2023
work page 2023
-
[3]
Diagnosing reinforcement learning for traffic signal control,
G. Zheng, X. Zang, N. Xu, H. Wei, Z. Yu, V . Gayah, K. Xu, and Z. Li, “Diagnosing reinforcement learning for traffic signal control,” arXiv preprint arXiv:1905.04716 , 2019
arXiv 1905
-
[4]
Urban traffic flow prediction techniques: A review,
B. Medina-Salgado, E. S ´anchez-DelaCruz, P. Pozos-Parra, and J. E. Sierra, “Urban traffic flow prediction techniques: A review,” Sustainable Computing: Informatics and Systems , vol. 35, p. 100739, 2022. [Online]. Available: https://www.sciencedirect.com/science/article/pii/ S2210537922000725
work page 2022
-
[5]
Real-time queue length estimation for congested signalized intersections,
H. X. Liu, X. Wu, W. Ma, and H. Hu, “Real-time queue length estimation for congested signalized intersections,” Transportation research part C: emerging technologies, vol. 17, no. 4, pp. 412–427, 2009
work page 2009
-
[6]
Ctm based real-time queue length estimation at signalized intersection,
S. Zhao, S. Liang, H. Liu, and M. Ma, “Ctm based real-time queue length estimation at signalized intersection,” Mathematical Problems in Engineering, vol. 2015, no. 1, p. 328712, 2015
work page 2015
-
[7]
J. Yin, J. Sun, and K. Tang, “A kalman filter-based queue length estimation method with low-penetration mobile sensor data at signalized intersections,” Transportation Research Record , vol. 2672, no. 45, pp. 253–264, 2018
work page 2018
-
[8]
Multivariate time- varying kalman filter approach for cycle-based maximum queue length estimation,
W. Abewickrema, M. Yildirimoglu, and J. Kim, “Multivariate time- varying kalman filter approach for cycle-based maximum queue length estimation,” Transportation research part C: emerging technologies, vol. 154, p. 104238, 2023
work page 2023
Show all 58 references
-
[9]
Cycle maximum queue length esti- mation: An integrated deep learning and adaptive neuro-fuzzy inference system framework (october 2024),
Y . Gu, S. Razavi, and S. Habibi, “Cycle maximum queue length esti- mation: An integrated deep learning and adaptive neuro-fuzzy inference system framework (october 2024),” IEEE Access, 2024
2024
-
[10]
Real-time signal queue length prediction using long short-term memory neural network,
R. Rahman and S. Hasan, “Real-time signal queue length prediction using long short-term memory neural network,” Neural Computing and Applications, vol. 33, pp. 3311–3324, 2021
2021
-
[11]
Qtnet: Theory-based queue length prediction for urban traffic,
R. Shirakami, T. Kitahara, K. Takeuchi, and H. Kashima, “Qtnet: Theory-based queue length prediction for urban traffic,” in Proceedings of the 29th ACM SIGKDD Conference on Knowledge Discovery and Data Mining, 2023, pp. 4832–4841
2023
-
[12]
Tqam: Temporal attention for cycle-wise queue length estimation using high-resolution loop detector data,
R. Sengupta, Y . Karnati, A. Rangarajan, and S. Ranka, “Tqam: Temporal attention for cycle-wise queue length estimation using high-resolution loop detector data,” in 2021 IEEE International Intelligent Transporta- tion Systems Conference (ITSC) . IEEE, 2021, pp. 3313–3320
2021
-
[13]
Neural-attention-based deep learning architectures for modeling traffic dynamics on lane graphs,
M. A. Wright, S. F. Ehlers, and R. Horowitz, “Neural-attention-based deep learning architectures for modeling traffic dynamics on lane graphs,” in 2019 IEEE Intelligent Transportation Systems Conference (ITSC). IEEE, 2019, pp. 3898–3905
2019
-
[14]
Traffic queue length and pressure estimation for road networks with geometric deep learning algorithms,
S. F. Ehlers, “Traffic queue length and pressure estimation for road networks with geometric deep learning algorithms,” arXiv preprint arXiv:1905.03889, 2019
1905 arXiv
-
[15]
Grey models for short-term queue length predictions for adaptive traffic signal control,
G. Comert, Z. Khan, M. Rahman, and M. Chowdhury, “Grey models for short-term queue length predictions for adaptive traffic signal control,” Expert Systems with Applications , vol. 185, p. 115618, 2021
2021
-
[16]
Temporal aggregation in traffic data: implications for statistical characteristics and model choice,
E. Vlahogianni and M. Karlaftis, “Temporal aggregation in traffic data: implications for statistical characteristics and model choice,”Transporta- tion Letters, vol. 3, no. 1, pp. 37–49, 2011
2011
-
[17]
A better understanding of long-range temporal dependence of traffic flow time series,
S. Feng, X. Wang, H. Sun, Y . Zhang, and L. Li, “A better understanding of long-range temporal dependence of traffic flow time series,” Physica A: Statistical Mechanics and its Applications , vol. 492, pp. 639–650, 2018
2018
-
[18]
How long will the traffic flow time series keep efficacious to forecast the future?
P. Yuan and X. Lin, “How long will the traffic flow time series keep efficacious to forecast the future?” Physica A: Statistical Mechanics and its Applications, vol. 467, pp. 419–431, 2017
2017
-
[19]
Self-similarity in highway traffic,
E. Campari and G. Levi, “Self-similarity in highway traffic,” The European Physical Journal B-Condensed Matter and Complex Systems , vol. 25, pp. 245–251, 2002
2002
-
[20]
The 1/f fluctuation of a traffic current on an expressway,
T. Musha and H. Higuchi, “The 1/f fluctuation of a traffic current on an expressway,” Japanese Journal of Applied Physics , vol. 15, no. 7, p. 1271, 1976
1976
-
[21]
1/f noise in a traffic model,
M. Takayasu and H. Takayasu, “1/f noise in a traffic model,” fractals, vol. 1, no. 04, pp. 860–866, 1993
1993
-
[22]
Traffic flow and 1/f fluctuations,
M. Choi and H.-Y . Lee, “Traffic flow and 1/f fluctuations,” Physical Review E, vol. 52, no. 6, p. 5979, 1995
1995
-
[23]
Self-organized criticality and 1/f noise in traffic,
M. Paczuski and K. Nagel, “Self-organized criticality and 1/f noise in traffic,” in Traffic and granular flow. World Scientific Singapore, 1996, p. 73
1996
-
[24]
1/f noise in a cellular automaton model for traffic flow with open boundaries and additional connection sites,
K. Nassab, M. Schreckenberg, S. Ouaskit, and A. Boulmakoul, “1/f noise in a cellular automaton model for traffic flow with open boundaries and additional connection sites,” Physica A: Statistical Mechanics and its Applications, vol. 354, pp. 597–605, 2005
2005
-
[25]
Long-range correlations of density fluc- tuations in the kerner-klenov-wolf cellular automata three-phase traffic flow model,
J. Wu, H. Sun, and Z. Gao, “Long-range correlations of density fluc- tuations in the kerner-klenov-wolf cellular automata three-phase traffic flow model,” Physical Review E , vol. 78, no. 3, p. 036103, 2008
2008
-
[26]
Long-range correlations in vehicular traffic flow studied in the framework of kerner’s three-phase theory based on rescaled range analysis,
Y . Xue, L.-S. Jia, W.-Z. Teng, and W.-Z. Lu, “Long-range correlations in vehicular traffic flow studied in the framework of kerner’s three-phase theory based on rescaled range analysis,” Communications in Nonlinear Science and Numerical Simulation , vol. 22, no. 1-3, pp. 285–...
2015
-
[27]
The application of h ¨older exponent to traffic congestion warning,
P. Shang, Y . Lu, and S. Kama, “The application of h ¨older exponent to traffic congestion warning,” Physica A: Statistical Mechanics and its Applications, vol. 370, no. 2, pp. 769–776, 2006
2006
-
[28]
Fractal nature of highway traffic data,
P. Shang, M. Wan, and S. Kama, “Fractal nature of highway traffic data,” Computers & Mathematics with Applications , vol. 54, no. 1, pp. 107–116, 2007
2007
-
[29]
Modeling traffic flow correlation using dfa and dcca,
N. Xu, P. Shang, and S. Kamae, “Modeling traffic flow correlation using dfa and dcca,” Nonlinear Dynamics, vol. 61, pp. 207–216, 2010. 10
2010
-
[30]
Multifractal classification of road traffic flows,
X. Li and P. Shang, “Multifractal classification of road traffic flows,” Chaos, Solitons & Fractals , vol. 31, no. 5, pp. 1089–1094, 2007
2007
-
[31]
Detecting long-range correlations of traffic time series with multifractal detrended fluctuation analysis,
P. Shang, Y . Lu, and S. Kamae, “Detecting long-range correlations of traffic time series with multifractal detrended fluctuation analysis,” Chaos, Solitons & Fractals , vol. 36, no. 1, pp. 82–90, 2008
2008
-
[32]
Time-dependent hurst exponent in traffic time series,
J. Yue, P. Shang, and K. Dong, “Time-dependent hurst exponent in traffic time series,” in 2010 IEEE International Conference on Information Theory and Information Security . IEEE, 2010, pp. 744–746
2010
-
[33]
Multiscale multifractal analysis of traffic signals to uncover richer structures,
J. Wang, P. Shang, and X. Cui, “Multiscale multifractal analysis of traffic signals to uncover richer structures,” Physical Review E , vol. 89, no. 3, p. 032916, 2014
2014
-
[34]
Long-range correlation analysis of urban traffic data,
S. Peng, W. Jun-Feng, T. Tie-Qiao, and Z. Shu-Long, “Long-range correlation analysis of urban traffic data,” Chinese Physics B , vol. 19, no. 8, p. 080205, 2010
2010
-
[35]
The impor- tance of antipersistence for traffic jams,
S. M. Krause, L. Habel, T. Guhr, and M. Schreckenberg, “The impor- tance of antipersistence for traffic jams,” Europhysics Letters, vol. 118, no. 3, p. 38005, 2017
2017
-
[36]
Fractal behavior of traffic volume on urban expressway through adaptive fractal analysis,
H.-d. He, J.-l. Wang, H.-r. Wei, C. Ye, and Y . Ding, “Fractal behavior of traffic volume on urban expressway through adaptive fractal analysis,” Physica A: Statistical Mechanics and Its Applications , vol. 443, pp. 518–525, 2016
2016
-
[37]
Self-similar characteristics of vehicle arrival pattern on highways,
Q. Meng and H. L. Khoo, “Self-similar characteristics of vehicle arrival pattern on highways,” Journal of Transportation Engineering , vol. 135, no. 11, pp. 864–872, 2009
2009
-
[38]
Self-similar behavior of highway road traffic and perfor- mance analysis at toll plazas,
M. R. Perati, K. Raghavendra, H. R. Koppula, M. R. Doodipala, and R. Dasari, “Self-similar behavior of highway road traffic and perfor- mance analysis at toll plazas,” Journal of transportation engineering , vol. 138, no. 10, pp. 1233–1238, 2012
2012
-
[39]
Self-organized criticality of traffic flow: Implications for congestion management technologies,
J. A. Laval, “Self-organized criticality of traffic flow: Implications for congestion management technologies,” Transportation Research Part C: Emerging Technologies, vol. 149, p. 104056, 2023
2023
-
[40]
Modeling and forecasting the urban volume using stochastic differential equations,
R. Tahmasbi and S. M. Hashemi, “Modeling and forecasting the urban volume using stochastic differential equations,” IEEE Transactions on Intelligent Transportation Systems, vol. 15, no. 1, pp. 250–259, 2013
2013
-
[41]
Traffic flow outlier detection for smart mobility using gaussian process regression assisted stochastic differential equations,
Q. Cheng, G. Dai, B. Ru, Z. Liu, W. Ma, H. Liu, and Z. Gu, “Traffic flow outlier detection for smart mobility using gaussian process regression assisted stochastic differential equations,” Transportation Research Part E: Logistics and Transportation Review , vol. 193, p. 103840, 2025
2025
-
[42]
The retrieval of intra- day trend and its influence on traffic prediction,
C. Chen, Y . Wang, L. Li, J. Hu, and Z. Zhang, “The retrieval of intra- day trend and its influence on traffic prediction,”Transportation research part C: emerging technologies , vol. 22, pp. 103–118, 2012
2012
-
[43]
A hybrid short-term traffic flow forecasting method based on spectral analysis and statistical volatil- ity model,
Y . Zhang, Y . Zhang, and A. Haghani, “A hybrid short-term traffic flow forecasting method based on spectral analysis and statistical volatil- ity model,” Transportation Research Part C: Emerging Technologies , vol. 43, pp. 65–78, 2014
2014
-
[44]
Modeling traffic volatility dynamics in an urban network,
Y . Kamarianakis, A. Kanas, and P. Prastacos, “Modeling traffic volatility dynamics in an urban network,” Transportation Research Record , vol. 1923, no. 1, pp. 18–27, 2005
1923
-
[45]
Real-time prediction of seasonal heteroscedasticity in vehicular traffic flow series,
W. Huang, W. Jia, J. Guo, B. M. Williams, G. Shi, Y . Wei, and J. Cao, “Real-time prediction of seasonal heteroscedasticity in vehicular traffic flow series,” IEEE Transactions on Intelligent Transportation Systems , vol. 19, no. 10, pp. 3170–3180, 2017
2017
-
[46]
Short-term prediction of urban traffic variability: Stochastic volatility modeling approach,
T. Tsekeris and A. Stathopoulos, “Short-term prediction of urban traffic variability: Stochastic volatility modeling approach,” Journal of Trans- portation Engineering, vol. 136, no. 7, pp. 606–613, 2010
2010
-
[47]
Parameter estimation for stochastic hybrid model applied to urban traffic flow estimation,
H. Y . Sutarto, R. K. Boel, and E. Joelianto, “Parameter estimation for stochastic hybrid model applied to urban traffic flow estimation,” IET Control Theory & Applications , vol. 9, no. 11, pp. 1683–1691, 2015
2015
-
[48]
Insync traffic signal optimization catalog,
Rhythm Engineering, “Insync traffic signal optimization catalog,” https: //rhythmtraffic.com/insync/#DownloadCatalog, accessed: 2025-06-14
2025
-
[49]
Field evaluation of insync adaptive traffic signal control system in multiple environments using multiple approaches
M. S. I. Shafik, “Field evaluation of insync adaptive traffic signal control system in multiple environments using multiple approaches.”
-
[50]
Koopman-theoretic modeling of quasiperiodically driven systems: Example of signalized traffic corridor,
S. Das, S. Mustavee, S. Agarwal, and S. Hasan, “Koopman-theoretic modeling of quasiperiodically driven systems: Example of signalized traffic corridor,” IEEE Transactions on Systems, Man, and Cybernetics: Systems, vol. 53, no. 7, pp. 4466–4476, 2023
2023
-
[51]
Multiplicative point process as a model of trading activity,
V . Gontis and B. Kaulakys, “Multiplicative point process as a model of trading activity,” Physica A: Statistical Mechanics and its Applications , vol. 343, pp. 505–514, 2004
2004
-
[52]
Traffic flow modelling with point processes,
K. W. Lim, W. Wang, H. Nguyen, Y . Lee, C. Cai, and F. Chen, “Traffic flow modelling with point processes,” in Proceedings of the 23rd World Congress on Intelligent Transport Systems , 2016, pp. 1–12
2016
-
[53]
Point processes arising in vehicular traffic flow,
E. A. Brill, “Point processes arising in vehicular traffic flow,” Journal of Applied Probability , vol. 8, no. 4, pp. 809–814, 1971
1971
-
[54]
Models for generation 1/f noise,
B. Kaulakys and T. Me ˇskauskas, “Models for generation 1/f noise,” Microelectronics Reliability , vol. 40, no. 11, pp. 1781–1785, 2000. [Online]. Available: https://www.sciencedirect.com/science/article/pii/ S0026271400000858
2000
-
[55]
Modelling traffic flow fluctuations,
P. Wagner, “Modelling traffic flow fluctuations,” arXiv preprint cond- mat/0411066, 2004
2004
-
[56]
Traffic arrival pattern estimation at urban intersection using license plate recognition data,
M. Li, J. Tang, Q. Chen, and Y . Liu, “Traffic arrival pattern estimation at urban intersection using license plate recognition data,” Physica A: Statistical Mechanics and its Applications , vol. 625, p. 128995, 2023. [Online]. Available: https://www.sciencedirect.com/science/...
2023
-
[57]
Arrival processes at traffic intersections,
M. Boon, “Arrival processes at traffic intersections,” 2017
2017
-
[58]
Memory effects in microscopic traffic models and wide scattering in flow-density data,
M. Treiber and D. Helbing, “Memory effects in microscopic traffic models and wide scattering in flow-density data,” Physical Review E , vol. 68, no. 4, p. 046119, 2003. Shakib Mustavee is a Post-doctoral Researcher in the Civil, Environmental, and Construction Engi- neering (C...
2003
Reviewed August 15, 2026 · model on record in the stance chip above.
Discussion (0). Continue with ORCID to comment.