REVIEW 4 major objections 5 minor 31 references
Monitoring of Drift Patterns in Image Data
T0 review · 4 major / 5 minor · reviewed 2026-08-07 · deepseek-v4-flash
Pith's one-line read A CUSUM statistic built from oblique-axis regression tree predictions can detect changes in the gradual drift of jump location curves in image sequences, with an asymptotic normality result that gives it a principled control-limit…
desk verdict Novel ORT-CUSUM drift monitoring method with good simulations, but the theory's one-step-ahead extrapolation is only justified for linear JLCs and the paper should be upfront about that gap. read the letter →
The pith
A machine-rendered reading of the paper's core claim, the machinery that carries it, and where it could break.
The reading
What carries the argument
Oblique-axis regression tree (ORT): a decision tree that splits nodes by linear combinations of the coordinates (x,y,t), producing polytopal leaves that can track slanted jump location curves. The recursive splitting algorithm chooses splits maximizing the reduction in sum of squares; leaf-only averaging yields a jump-preserving estimate. The load-bearing mechanism is the predicted partition: the tree fitted on images up to the current time is evaluated at the next time point, and the CUSUM statistic Qtk = max(0, Qt(k−1) + n/√2(Λtk − 1) − κ) accumulates the centered, scaled prediction error.
What would settle it
Simulate an in-control sequence in which a curved JLC, such as a circle expanding at constant rate, drifts with constant velocity, run the ORT-CUSUM with m0 = 20, and check whether the empirical mean of n/√2(Λtk − 1) stays near 0 and the in-control ARL matches the nominal level; if the statistic drifts or signals prematurely, the line-segment and constant-velocity assumption is load-bearing.
Extended reading notes
Core claim
The central claim is that a CUSUM chart constructed from ORT-based prediction error can distinguish a stable drift pattern from a changed one. At each time point, an ORT is fitted to the last m0 images and its split rules are evaluated at the future time point; leaf-only averaging over the predicted leaves gives a denoised estimate of the next image. The statistic Λtk is the mean squared difference between this predicted image and the observed image, scaled by noise variance and degrees of freedom. Theorem 1 states that n/√2(Λtk − 1) converges in distribution to N(0,1) when the drift pattern is unchanged, while under a changed drift pattern the same quantity shifts by O(1)Δ², where Δ is the jump deviation associated with the change. This makes the method a drift-pattern change detector, and, when no drift is present, it also detects abrupt changes in jump location curves.
Load-bearing premise
The whole scheme hinges on the assumption that during the in-control period the jump location curves are exact straight-line segments drifting at a constant velocity, so that a tree fitted on past images remains accurate when extrapolated one step ahead to the next image.
Editorial extensions
If this is right
- A change in drift rate or drift direction of a JLC raises a CUSUM signal, typically within one to four time points in the simulations.
- In the absence of any drift, the same statistic still detects abrupt changes in jump location curves, so the method covers both gradual and step changes.
- The method ignores intensity changes that do not move JLCs, such as uniform brightness drift, which is useful in the presence of shadows or lighting effects.
- The theoretical result gives an asymptotic normal benchmark, so control limits can be set from the standard normal when the noise variance and prediction error are estimated.
- The method is designed for registered, equally spaced image sequences and can be applied to three-dimensional image arrays as well.
Reading between the lines
- The detection delay appears tied to how quickly the drift displacement becomes visible at the pixel scale; for slow drifts, several frames will be needed before the prediction error accumulates enough to signal.
- Because the estimator is consistent only when the true JLCs are line segments with constant-velocity drift during the in-control window, curved boundaries would likely bias Λtk away from 1 even under the null; a piecewise-linear approximation of curved JLCs is a natural stress test.
- The ORT splitting rule could be extended to monitor drift patterns in tensor or multi-channel images, or to include spatio-temporally correlated noise by replacing the i.i.d. Gaussian assumption with a block bootstrap calibration of control limits.
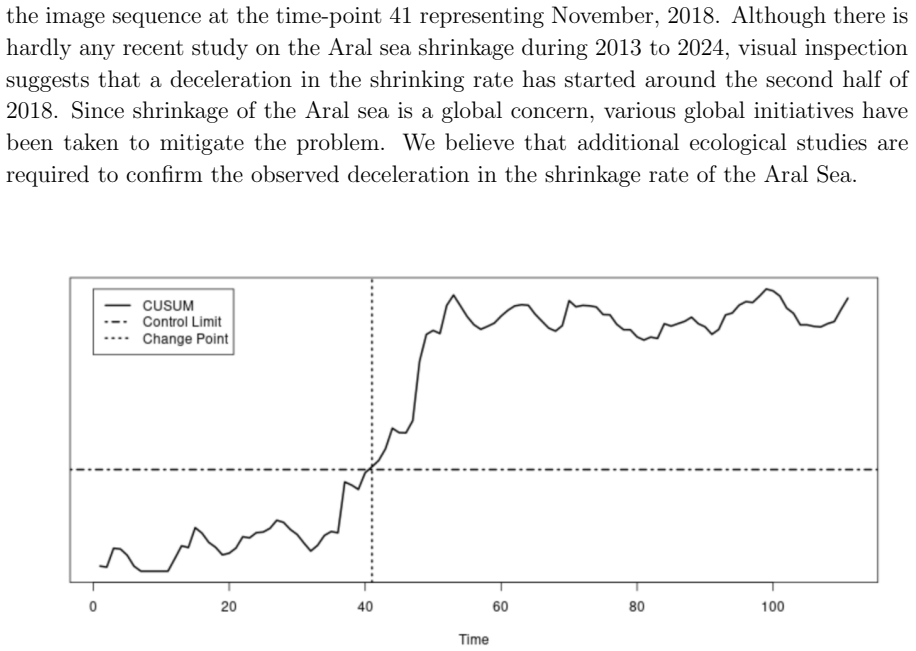
- The Aral Sea result, a signal near November 2018, gives a concrete target for ecological studies to confirm whether a deceleration in shrinkage began in the second half of 2018.
Signed reviews
Editorial analysis
A structured set of objections, weighed in public.
Referee Report
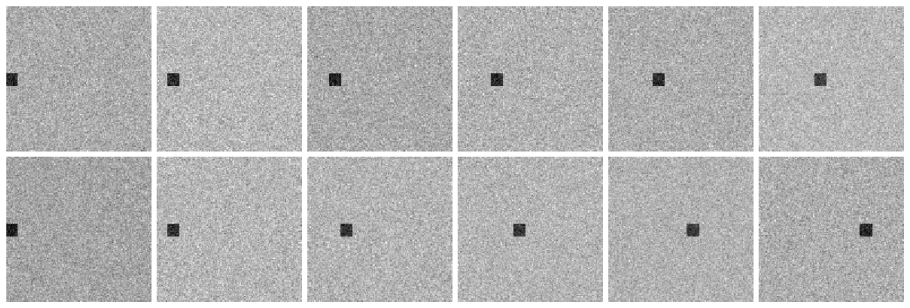
Summary. The paper proposes a sequential monitoring scheme for detecting changes in the drift pattern of jump location curves (JLCs) in image sequences. The method fits an oblique-axis regression tree (ORT) to the most recent m0 images, extrapolates the resulting partition to the next time point, computes a normalized squared prediction error Λ_tk between the observed image and the leaf-averaged prediction, and feeds n/√2(Λ_tk − 1) into a CUSUM statistic Q_tk. Theorem 1 claims that under the null hypothesis of an unchanged drift pattern Λ_tk is asymptotically standard normal after centering and scaling, while under the alternative the statistic drifts by an amount proportional to Δ². The paper reports simulations for five scenarios—straight-line JLCs with constant or doubled drift rates, a stationary JLC change, and a case where only intensities change—and compares against the methods of Bui and Apley (2018) and Koosha et al. (2017), followed by an application to Landsat images of the Aral Sea.
Significance. The problem is well motivated and largely underexplored: existing image monitoring methods are not designed for gradual drift-pattern changes, and the ORT-based CUSUM construction is a genuinely new way to combine discontinuity-preserving estimation with sequential monitoring. If Theorem 1 and the numerical comparisons are reliable, the method would be a useful addition to the SPC toolkit for image streams, with the additional advantage of still detecting abrupt JLC changes when no drift is present. The paper also makes a welcome empirical effort, reporting ARL comparisons on multiple scenarios and a real-data application. However, the theoretical foundation is currently not self-contained: the key asymptotic result is deferred to a companion preprint, and the extrapolation step that is central to the null distribution is only justified under quite restrictive conditions that the paper's own real-data example appears to violate.
major comments (4)
- [Supplementary Materials, S.1, Eqns. (S.1)–(S.3)] The null-distribution claim of Theorem 1 depends on the step 'if (x,y,t_k) ∈ int(Γ_l*) then (x,y,t_{k+1}) ∈ int(Γ_l*)' and on Eq. (S.3), both of which require that the 3-D boundary α1 x + α2 y + α3 t = c is a plane that the ORT can extrapolate exactly. This holds only when each JLC is a line segment drifting with constant velocity, as in Assumption (v) and Definition 2. For curved JLCs or nonconstant drift velocity, a leaf that is correctly assigned at t_k can cut across the true region at t_{k+1}, so the leaf average pools intensities from different constant regions and E[Λ_tk | H0] ≠ 1. Since the stated goal and the Aral Sea application (Figure 9) involve curved coastlines, the scope of Theorem 1 is narrower than the paper's central claim in Section 1.3.
- [Section 3, Theorem 1 and Supplementary Materials, S.1] The proof of Theorem 1 is only a sketch and defers the key consistency of the ORT leaf-averaging estimator to the companion preprint [Basak et al., 2025]. The supplementary text itself notes that those lemmas apply only when the evaluation time point lies within the training range, whereas the monitoring procedure predicts at t_{k+1} from data up to t_k. The extrapolation inequality (S.3) is precisely the part not covered by the companion lemmas, so the normal limit in Eq. (S.4) is not established by the cited results. The manuscript should either provide a self-contained proof of the extrapolation step under stated assumptions or restrict the theoretical claim to a regime where that step is proved.
- [Section 3, Theorem 1; Supplementary Eq. (S.4)] The derivation of the asymptotic normality treats the pixelwise residuals z_tk(x,y) = (ε + δ)² as independent noncentral χ² variables and then applies a CLT to their average, but the ORT leaf averaging induces dependence across pixels within leaves, and the number of leaves K(I_tk) appears in the denominator of Eq. (4) while the proof replaces n² − K by n² without discussing the rate of K. The claim that E_tk is bounded by 2 is also stated without justification. These steps are load-bearing for the N(0,1) centering and scaling; without a more careful treatment of dependence and leaf-count asymptotics, the theorem is not fully verified.
- [Section 4.1, Simulations 1–5] All simulations use piecewise constant images with straight-line JLCs and linear drift, so they are consistent with the restrictive conditions of Theorem 1 but do not test the method's robustness to curved JLCs or nonlinear drift. Given that the real-data application (Section 4.3) involves a curved coastline, a simulation with a curved JLC or time-varying drift velocity would directly address whether the monitoring statistic remains calibrated under the conditions the application requires.
minor comments (5)
- [Section 2.5, Eq. (5)] The text says a change in drift pattern is detected 'between the time-points tk and t(k+1)', but the statistic Q_tk is computed using the image at t_k; the indexing should be made consistent.
- [Algorithm 2] In the 'for' loop, 'Fit a tree using algorithm 2.4' should read 'using Section 2.4', and the notation T_tk_rule is introduced without being defined consistently with Trule in Section 2.4.
- [Section 4.2, Table 1] The table and surrounding text contain formatting inconsistencies such as 'Koosha-et.-al.' and unclosed parentheses in the standard deviation column; these should be cleaned up.
- [Section 4.3.1] The imputation equation omits the indicator or domain specification for t ∈ (t_i, t_{i+1}), and the interpolation formula's denominator (t_{i+1} − t_i) is written but the fraction is not typeset clearly; please clarify.
- [Section 3, Assumption (v)] Assumption (v) says 'Each JLCs is a line segment', but the earlier discussion in Section 2.3 says JLCs are piecewise linear with each linear part treated as a separate JLC; this should be reconciled explicitly.
Circularity Check
Theorem 1's null distribution is asserted to be a direct consequence of a same-author companion preprint; the key ORT-consistency lemmas are imported by self-citation rather than independently established, while the CUSUM construction and empirical evaluation remain new.
-
self citation load bearing
[Section 3 (Theorem 1) and Supplementary Materials S.1]
"The above Theorem is a direct consequence of the results provide by [Basak et al., 2025]. A sketch of the proof is provided in the Supplementary Materials... The following results are provided by [Basak et al., 2025]. Lemma 1 ... Lemma 5 ... This is due to the results provided by [Basak et al., 2025]."
Theorem 1 is the central claim: under H0, n/sqrt(2)(Lambda_tk - 1) converges to N(0,1). Its proof in S.1 is a sketch that takes as given Lemmas 1-5 of [Basak et al., 2025], a companion preprint by the same authors. Those lemmas provide the ORT leaf-averaging consistency that makes the prediction-error term delta_tk go to 0 and hence centers Lambda_tk at 1; without them the null convergence is unsupported. The manuscript neither proves the lemmas nor shows that the companion is machine-checked, code-reproduced, or externally falsifiable, so under the review standard this is a load-bearing self-citation rather than independent evidence.
full rationale
The only reduction I can exhibit is the self-citation chain behind Theorem 1. The proof of Theorem 1 in the Supplement says that the ORT consistency results are provided by [Basak et al., 2025] and then uses them to show delta_{t_{k+1}} goes to 0 under H0; this step is precisely what turns leaf-averaging residual noise into a centered normal statistic. Since that companion is by the same authors and is not independently verified in this paper, the paper's strongest theoretical claim is not self-contained. I did not count as circular the theta^2 standardization, because calibrating the denominator from in-control MSE is an ordinary control-chart normalization, not a fitted quantity renamed as a prediction. Nor did I count the linear-JLC and constant-velocity condition as circular: it is an explicit hypothesis (Assumption v) that limits the theorem's scope, which is a correctness or robustness concern rather than a definitional reduction. The empirical comparisons use external baselines and the estimator and CUSUM construction are genuinely new; hence score 4, not 6 or higher.
Assumptions & free parameters
free parameters (5)
- Allowance parameter κ =
0.9, 2.0, 0.7 in simulations; bootstrap estimate in real data
- Control limit q0 =
Calibrated to in-control ARL = 20 in simulations; Q + Φ^-1(0.95)sQ in real data
- Noise plus prediction variance θ² =
Estimated as the average in-control MSE
- Window width m0 =
20 in simulations, 24 in real data
- Tree splitting cutoff =
Unspecified
assumptions (5)
- domain assumption The true image intensity f is piecewise constant and JLCs are piecewise linear, with finitely many jump points of Lebesgue measure zero.
- domain assumption Pointwise noise is i.i.d. N(0, σ²).
- domain assumption Images are registered, resized to equal resolution, and missing images are linearly interpolated.
- ad hoc to paper The ORT leaf-averaging estimator is consistent and jump-preserving, imported from [Basak et al., 2025], and remains consistent at the extrapolated prediction time tk+1 under H0.
- domain assumption sup_i |t_{i+1} - t_i| tends to 0 as n tends to infinity.
Cite this review
Pith. "Pith review of Monitoring of Drift Patterns in Image Data." pith.science (2026). https://pith.science/paper/JQDASPNT
@misc{pith2026250614260,
  author       = {Pith},
  title        = {Pith review of: Monitoring of Drift Patterns in Image Data},
  year         = {2026},
  howpublished = {\url{https://pith.science/paper/JQDASPNT}},
  note         = {Machine review of arXiv:2506.14260}
}
read the original abstract
Sequential monitoring of images has broad applications across various domains, including climate science, ecosystem monitoring, medical diagnostics, and so forth. In many such applications, images acquired over time exhibit gradual changes, referred to as drifts, which pose significant challenges for monitoring. Rather than detecting only abrupt step changes, it is crucial to monitor and characterize these drift patterns. Despite its practical importance, the problem of drift monitoring in image sequences has received limited attention. This paper addresses this gap by proposing a novel drift monitoring method based on an oblique-axis regression tree. It is particularly effective for monitoring drift patterns in the jump location curves present in the image intensity functions. By leveraging a decision tree framework, the method captures discontinuities both in spatial image intensity and temporal progression. A key advantage of this method lies in its flexibility: in the absence of drift, it remains capable of detecting abrupt step changes. Theoretical properties and numerical performance in diverse types of simulation settings indicate its broad applicability.
Figures


Figures from the paper (7 more)



Reference graph
Works this paper leans on
-
[1]
Anderson, T. W. and Darling, D. A. (1954). A test of goodness of fit. Journal of the American statistical association , 49(268):765--769
work page 1954
- [2]
-
[3]
Breiman, L. (1984). Classification and Regression Trees . (The Wadsworth statistics / probability series). Wadsworth International Group
work page 1984
-
[4]
Bui, A. T. and Apley, D. W. (2018). A monitoring and diagnostic approach for stochastic textured surfaces. Technometrics , 60(1):1--13
work page 2018
-
[5]
Bui, A. T. and Apley, D. W. (2021). spc4sts: Statistical process control for stochastic textured surfaces in r. Journal of Quality Technology , 53(3):219--242
work page 2021
-
[6]
D., Chandak, R., and Klusowski, J
Cattaneo, M. D., Chandak, R., and Klusowski, J. M. (2024). Convergence rates of oblique regression trees for flexible function libraries. The Annals of Statistics , 52(2):466--490
work page 2024
-
[7]
Clayden, J., Modat, M., Presles, B., Anthopoulos, T., and Daga, P. (2023). RNiftyReg: Image Registration Using the 'NiftyReg' Library . R package version 2.8.1
work page 2023
-
[8]
Fang, X., Paynabar, K., and Gebraeel, N. (2019). Image-based prognostics using penalized tensor regression. Technometrics , 61(3):369--384
work page 2019
Show all 31 references
-
[9]
and Qiu, P
Feng, L. and Qiu, P. (2018). Difference detection between two images for image monitoring. Technometrics , 60(3):345--359
2018
-
[10]
He, Z., Zuo, L., Zhang, M., and Megahed, F. M. (2016). An image-based multivariate generalized likelihood ratio control chart for detecting and diagnosing multiple faults in manufactured products. International Journal of Production Research , 54(6):1771--1784
2016
-
[11]
Kang, Y. (2022). Statistical quality control using image intelligence: A sparse learning approach. Naval Research Logistics (NRL) , 69(7):996--1008
2022
-
[12]
Koosha, M., Noorossana, R., and Megahed, F. (2017). Statistical process monitoring via image data using wavelets. Quality and Reliability Engineering International , 33(8):2059--2073
2017
-
[13]
M., Wells, L
Megahed, F. M., Wells, L. J., Camelio, J. A., and Woodall, W. H. (2012). A spatiotemporal method for the monitoring of image data. Quality and Reliability Engineering International , 28(8):967--980
2012
-
[14]
M., Woodall, W
Megahed, F. M., Woodall, W. H., and Camelio, J. A. (2011). A review and perspective on control charting with image data. Journal of Quality Technology , 43(2):83--98
2011
-
[15]
Okhrin, Y., Schmid, W., and Semeniuk, I. (2020). New approaches for monitoring image data. IEEE Transactions on Image Processing , 30:921--933
2020
-
[16]
Qiu, P. (2005). Image processing and jump regression analysis . John Wiley & Sons
2005
-
[17]
Qiu, P. (2013). Introduction to statistical process control . CRC press
2013
-
[18]
Qiu, P. (2018). Jump regression, image processing, and quality control. Quality Engineering , 30(1):137--153
2018
-
[19]
Qiu, P. (2020). Big data? statistical process control can help! The American Statistician , 74(4):329--344
2020
-
[20]
and Xing, C
Qiu, P. and Xing, C. (2013). Feature based image registration using non-degenerate pixels. Signal Processing , 93(4):706--720
2013
-
[21]
and Mukherjee, P
Roy, A. and Mukherjee, P. S. (2024a). A control chart for monitoring images using jump location curves. Quality Engineering , 36(2):439--452
2024
-
[22]
and Mukherjee, P
Roy, A. and Mukherjee, P. S. (2024b). Image comparison based on local pixel clustering. Technometrics , 0(0):1--19
2024
-
[23]
and Mukherjee, P
Roy, A. and Mukherjee, P. S. (2025). Upper quantile-based cusum-type control chart for detecting small changes in image data. Journal of Applied Statistics , pages 1--16
2025
-
[24]
Su, Y., Shu, L., and Tsui, K.-L. (2011). Adaptive ewma procedures for monitoring processes subject to linear drifts. Computational statistics & data analysis , 55(10):2819--2829
2011
-
[25]
and Qiu, P
Xing, C. and Qiu, P. (2011). Intensity-based image registration by nonparametric local smoothing. IEEE Transactions on Pattern Analysis and Machine Intelligence , 33(10):2081--2092
2011
-
[26]
Yan, H., Paynabar, K., and Shi, J. (2017). Anomaly detection in images with smooth background via smooth-sparse decomposition. Technometrics , 59(1):102--114
2017
-
[27]
M., and Paynabar, K
Yang, W., Grasso, M., Colosimo, B. M., and Paynabar, K. (2023). A tensor-based hierarchical process monitoring approach for anomaly detection in additive manufacturing. Quality and Reliability Engineering International , 39(2):630--650
2023
-
[28]
and Qiu, P
Yi, F. and Qiu, P. (2022). An adaptive cusum chart for drift detection. Quality and Reliability Engineering International , 38(2):887--894
2022
-
[29]
and Qiu, P
Yi, F. and Qiu, P. (2023). Water resource surveillance for the salton sea in california by adaptive sequential monitoring of its landsat images. Journal of Agricultural, Biological and Environmental Statistics , 28(3):549--563
2023
-
[30]
Zhan, H., Liu, Y., and Xia, Y. (2024). Consistency of oblique decision tree and its boosting and random forest
2024
-
[31]
Zhen, Z., Paynabar, K., and Shi, J. (2023). Image-based feedback control using tensor analysis. Technometrics , 65(3):305--314
2023
Reviewed August 7, 2026 · model on record in the stance chip above.
Discussion (0). Continue with ORCID to comment.