Exploring MLLMs Perception of Network Visualization Principles
Pith reviewed 2026-05-19 09:07 UTC · model grok-4.3
The pith
Multimodal LLMs match trained human experts at judging stress in network layouts when given equivalent instructions.
A machine-rendered reading of the paper's core claim, the machinery that carries it, and where it could break.
Core claim
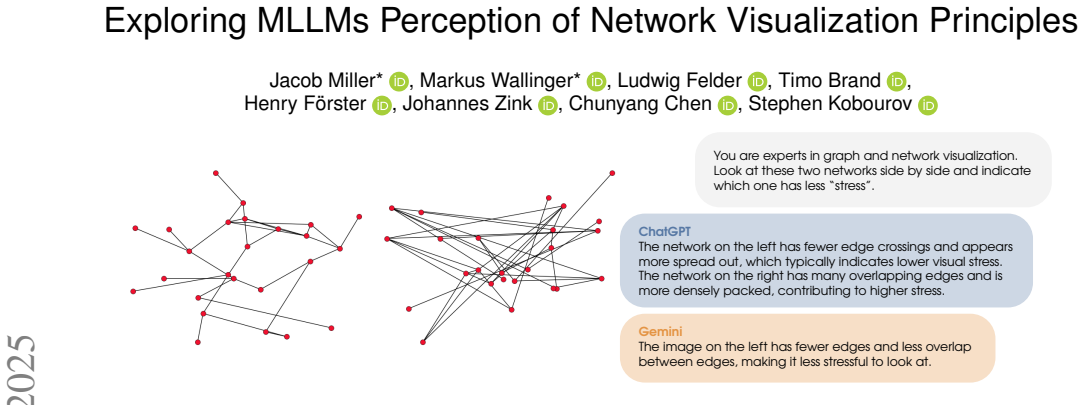
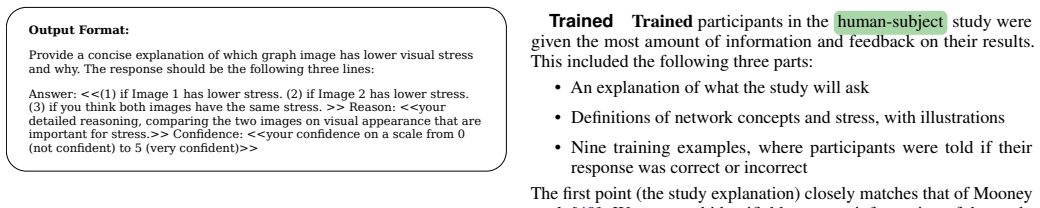
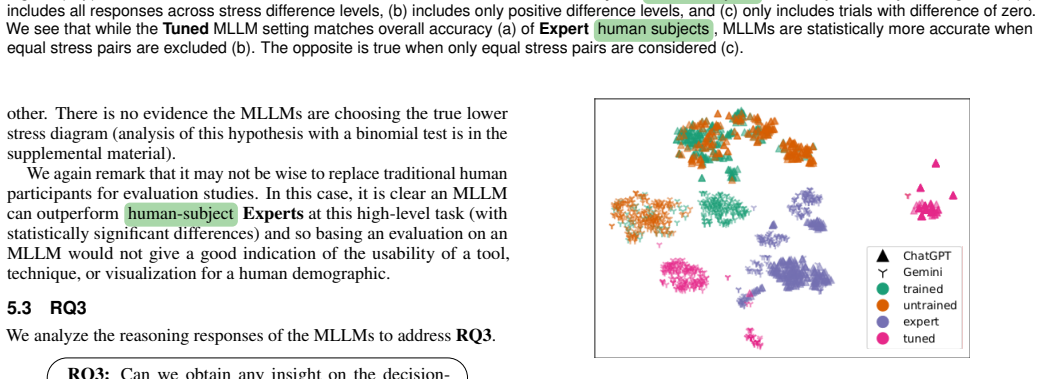
Providing MLLMs with the identical study information used for trained human participants produces accuracy in rating network layout stress that matches expert humans and exceeds untrained non-experts. The models rely on visual proxies instead of direct stress computation, and their generated explanations mirror those of human subjects.
What carries the argument
Replication of the human-subject experiment on stress perception in network layouts, using identical visual stimuli and textual instructions supplied to GPT-4o, Gemini-2.5, and Qwen2.5.
If this is right
- MLLMs can serve as scalable substitutes for human subjects when evaluating visualization quality under the same protocol.
- Deviating from the human-style prompt can produce performance that exceeds human experts in some cases.
- Model explanations of layout quality track human reasoning patterns such as node distribution and edge uniformity.
- The approach enables rapid testing of additional network visualization principles without new human recruitment.
Where Pith is reading between the lines
- The result suggests MLLMs may have acquired implicit models of visual aesthetics during training that parallel human perceptual heuristics.
- Similar methods could be applied to other visualization metrics or chart types to test the breadth of this capability.
- If confirmed across more models and tasks, it could reduce reliance on human participants for early-stage HCI experiments in visualization.
- The finding opens questions about whether the models are truly perceiving or simply pattern-matching from training data on diagrams.
Load-bearing premise
The images and instructions create a perceptual task for the models that is equivalent to the training and experience given to the human participants.
What would settle it
Showing the MLLMs a set of network layouts with pre-computed stress values and checking whether their quality rankings align more closely with the actual stress metric or with the human expert rankings from the original study.
Figures


read the original abstract
In this paper, we test whether Multimodal Large Language Models (MLLMs) can match human-subject performance in tasks involving the perception of properties in network layouts. Specifically, we replicate a human-subject experiment about perceiving quality (namely stress) in network layouts using GPT-4o, Gemini-2.5 and Qwen2.5. Our experiments show that giving MLLMs the same study information as trained human participants yields performance comparable to that of human experts and exceeds that of untrained non-experts. Additionally, we show that prompt engineering that deviates from the human-subject experiment can lead to better-than-human performance in some settings. Interestingly, like human subjects, the MLLMs seem to rely on visual proxies rather than computing the actual value of stress, indicating some sense or facsimile of perception. Explanations from the models are similar to those used by the human participants (e.g., an even distribution of nodes and uniform edge lengths).
Editorial analysis
A structured set of objections, weighed in public.
Referee Report
Summary. The paper replicates a prior human-subject study on perceiving stress in network layouts using MLLMs (GPT-4o, Gemini-2.5, Qwen2.5). It claims that supplying the models with the same study information given to trained human participants produces performance comparable to human experts and superior to untrained non-experts. The authors further report that MLLMs rely on visual proxies (e.g., node distribution and edge uniformity) rather than direct stress computation, with explanations resembling those of human participants, and that non-standard prompt engineering can yield better-than-human results in some cases.
Significance. If the central equivalence claim is substantiated with quantitative evidence, the work would contribute to understanding MLLM capabilities in visualization perception tasks within HCI, potentially informing AI-assisted network layout evaluation and reducing reliance on human subjects for certain perceptual studies. The observation that models use human-like heuristics is a useful qualitative parallel, but the absence of direct metrics comparing model outputs to the original human dataset limits the strength of the contribution at present.
major comments (2)
- [Abstract / Results] Abstract and Results sections: the claim of 'performance comparable to that of human experts' is stated without quantitative metrics, statistical tests, exact sample sizes, error distributions, confusion matrices, or correlation coefficients between MLLM ratings and the original human-subject data, leaving the central comparability assertion only weakly supported by the available text.
- [Methods] Methods: the assumption that textual instructions plus images given to the MLLMs constitute an equivalent perceptual task to the training and practice trials provided to human experts is not verified; no quantitative comparison (e.g., rating distributions or agreement measures) is reported to confirm functional equivalence rather than superficial similarity.
minor comments (2)
- [Methods] The paper would benefit from an appendix containing the exact prompts and image presentation protocol used for each MLLM to support reproducibility.
- [Methods] Clarify how 'stress' was operationalized in the model prompts versus the original human study (e.g., rating scale, number of stimuli) to allow direct comparison.
Simulated Author's Rebuttal
We thank the referee for their insightful comments, which have helped us improve the clarity and rigor of our work. We address each major comment below and indicate the revisions made to the manuscript.
read point-by-point responses
-
Referee: Abstract and Results sections: the claim of 'performance comparable to that of human experts' is stated without quantitative metrics, statistical tests, exact sample sizes, error distributions, confusion matrices, or correlation coefficients between MLLM ratings and the original human-subject data.
Authors: We acknowledge that the original manuscript could benefit from more explicit quantitative evidence. The paper compares MLLM performance to the expert and non-expert levels reported in the original human study using the same task and scales. To strengthen this, we have revised the Results section to include exact sample sizes (number of network layouts evaluated per model), mean ratings with standard deviations, and direct comparisons to the published human means. We added Pearson correlation coefficients where aggregate data allowed, and statistical significance tests for differences from expert performance. A confusion matrix for binary high/low stress classification has also been included. We note that without access to the raw per-participant human data, item-level correlations are not possible, but the aggregate metrics support the comparability claim. revision: yes
-
Referee: Methods: the assumption that textual instructions plus images given to the MLLMs constitute an equivalent perceptual task to the training and practice trials provided to human experts is not verified; no quantitative comparison (e.g., rating distributions or agreement measures) is reported to confirm functional equivalence rather than superficial similarity.
Authors: This point highlights an important distinction. We have added to the Methods and Results sections quantitative comparisons of rating distributions between MLLMs and human experts, including histograms and statistical tests for distribution similarity (e.g., Kolmogorov-Smirnov test). We also report inter-rater agreement measures such as Cronbach's alpha or ICC between model outputs and human data where feasible. The revised text clarifies that while the MLLM task is not identical to human training (lacking practice trials), the similar performance and reasoning patterns (from explanations) suggest a functional parallel. We discuss this as a limitation in the paper. revision: yes
Circularity Check
No circularity: empirical replication against external human dataset
full rationale
The paper performs an empirical replication by supplying MLLMs with the same textual instructions and network layout images used in a prior human-subject study, then directly compares performance metrics (e.g., stress perception accuracy) to the published human results. No equations, fitted parameters, or self-defined quantities are introduced that reduce the reported outcomes to author choices by construction. The central claim rests on measurement against an independent external benchmark rather than any self-referential derivation, self-citation load-bearing premise, or renaming of known results. This matches the default case of a self-contained experimental comparison with no reduction to inputs.
Axiom & Free-Parameter Ledger
axioms (1)
- domain assumption Multimodal LLMs can receive and reason over static images of network layouts in a manner comparable to human visual perception when given textual instructions.
Lean theorems connected to this paper
-
IndisputableMonolith/Cost/FunctionalEquation.leanwashburn_uniqueness_aczel unclear?
unclearRelation between the paper passage and the cited Recognition theorem.
MLLMs seem to rely on visual proxies rather than computing the actual value of stress... explanations... similar to those used by the human participants (e.g., an even distribution of nodes and uniform edge lengths)
-
IndisputableMonolith/Foundation/AlexanderDuality.leanalexander_duality_circle_linking unclear?
unclearRelation between the paper passage and the cited Recognition theorem.
replicate a human-subject experiment about perceiving quality (namely stress) in network layouts
What do these tags mean?
- matches
- The paper's claim is directly supported by a theorem in the formal canon.
- supports
- The theorem supports part of the paper's argument, but the paper may add assumptions or extra steps.
- extends
- The paper goes beyond the formal theorem; the theorem is a base layer rather than the whole result.
- uses
- The paper appears to rely on the theorem as machinery.
- contradicts
- The paper's claim conflicts with a theorem or certificate in the canon.
- unclear
- Pith found a possible connection, but the passage is too broad, indirect, or ambiguous to say the theorem truly supports the claim.
Reference graph
Works this paper leans on
-
[1]
W. Agnew, A. S. Bergman, J. Chien, M. Díaz, S. El-Sayed, J. Pittman, S. Mohamed, and K. R. McKee. The illusion of artificial inclusion. In F. F. Mueller, P. Kyburz, J. R. Williamson, C. Sas, M. L. Wilson, P. O. T. Dugas, and I. Shklovski, eds., CHI 2024, pp. 286:1–286:12. ACM, 2024. doi: 10.1145/3613904.3642703 2, 9
- [2]
-
[3]
A. Arleo, S. Miksch, and D. Archambault. Event-based dynamic graph drawing without the agonizing pain. Comput. Graph. Forum, 41(6):226– 244, 2022. doi: 10.1111/CGF.14615 3
-
[4]
M. Aubin Le Quéré, H. Schroeder, C. Randazzo, J. Gao, Z. Epstein, S. T. Perrault, D. Mimno, L. Barkhuus, and H. Li. LLMs as research tools: Applications and evaluations in HCI data work. In F. F. Mueller, P. Kyburz, J. R. Williamson, and C. Sas, eds., CHI EA 2024, pp. 479:1–479:7. ACM,
work page 2024
-
[5]
doi: 10.1145/3613905.3636301 2
-
[6]
A. Bendeck and J. T. Stasko. An empirical evaluation of the GPT-4 multimodal language model on visualization literacy tasks. IEEE Trans. Vis. Comput. Graph., 31(1):1105–1115, 2025. doi: 10.1109/TVCG.2024. 3456155 1, 2, 9
-
[8]
T. Brown, B. Mann, N. Ryder, M. Subbiah, J. D. Kaplan, P. Dhariwal, A. Neelakantan, P. Shyam, G. Sastry, A. Askell, S. Agarwal, A. Herbert- V oss, G. Krueger, T. Henighan, R. Child, A. Ramesh, D. Ziegler, J. Wu, C. Winter, C. Hesse, M. Chen, E. Sigler, M. Litwin, S. Gray, B. Chess, J. Clark, C. Berner, S. McCandlish, A. Radford, I. Sutskever, and D. Amode...
work page 2020
-
[9]
L. Chen, J. Li, X. Dong, P. Zhang, Y . Zang, Z. Chen, H. Duan, J. Wang, Y . Qiao, D. Lin, and F. Zhao. Are we on the right way for evaluating large vision-language models? In NeurIPS 2024, pp. 27056–27087. Curran Associates, Inc., 2024. 4
work page 2024
- [10]
-
[11]
M. Chimani, P. Eades, P. Eades, S. Hong, W. Huang, K. Klein, M. Marner, R. T. Smith, and B. H. Thomas. People prefer less stress and fewer crossings. In C. Duncan and A. Symvonis, eds., GD 2014, vol. 8871 of LNCS, pp. 523–524. Springer, 2014. 3
work page 2014
-
[12]
F. De Luca, M. I. Hossain, and S. G. Kobourov. Symmetry detection and classification in drawings of graphs. In D. Archambault and C. D. Tóth, eds., GD 2019, vol. 11904 of LNCS, pp. 499–513. Springer, 2019. doi: 10. 1007/978-3-030-35802-0_38 2
work page 2019
-
[13]
S. Di Bartolomeo, T. Crnovrsanin, D. Saffo, E. Puerta, C. Wilson, and C. Dunne. Evaluating graph layout algorithms: A systematic review of methods and best practices. Comput. Graph. Forum, 43(6), 2024. doi: 10. 1111/CGF.15073 3
work page 2024
-
[14]
S. Di Bartolomeo, G. Severi, V . Schetinger, and C. Dunne. Ask and you shall receive (a graph drawing): Testing ChatGPT’s potential to apply graph layout algorithms. In T. Höllt, W. Aigner, and B. Wang, eds., EuroVis 2023, pp. 79–83. Eurographics Association, 2023. doi: 10.2312/ EVS.20231047 2
work page 2023
-
[15]
P. Dragicevic. Fair statistical communication in HCI. In J. Robertson and M. Kaptein, eds., Modern Statistical Methods for HCI, pp. 291–330. Springer, Cham, 2016. doi: 10.1007/978-3-319-26633-6_13 5
-
[16]
P. Duan, J. Warner, Y . Li, and B. Hartmann. Generating automatic feedback on UI mockups with large language models. In F. F. Mueller, P. Kyburz, J. R. Williamson, C. Sas, M. L. Wilson, P. O. T. Dugas, and I. Shklovski, eds., CHI 2024, pp. 6:1–6:20. ACM, 2024. doi: 10.1145/ 3613904.3642782 2
-
[17]
A. El-Kishky, A. Wei, A. Saraiva, B. Minaiev, D. Selsam, D. Dohan, F. Song, H. Lightman, I. C. Gilaberte, J. Pachocki, J. Tworek, L. Kuhn, L. Kaiser, M. Chen, M. Schwarzer, M. Rohaninejad, N. McAleese, o3 con- tributors, O. Mürk, R. Garg, R. Shu, S. Sidor, V . Kosaraju, and W. Zhou. Competitive programming with large reasoning models. arXiv preprint, abs/...
-
[18]
H. Förster, F. Klesen, T. Dwyer, P. Eades, S. Hong, S. G. Kobourov, G. Liotta, K. Misue, F. Montecchiani, A. Pastukhov, and F. Schreiber. GraphTrials: Visual proofs of graph properties. In S. Felsner and K. Klein, eds., GD 2024, vol. 320 of LIPIcs, pp. 16:1–16:18. Schloss Dagstuhl,
work page 2024
-
[19]
doi: 10.4230/LIPICS.GD.2024.16 1, 3
-
[20]
E. R. Gansner, Y . Hu, and S. C. North. A maxent-stress model for graph layout. IEEE Trans. Vis. Comput. Graph., 19(6):927–940, 2013. doi: 10. 1109/TVCG.2012.299 3
work page 2013
-
[21]
E. R. Gansner, Y . Koren, and S. C. North. Graph drawing by stress majorization. In J. Pach, ed., GD 2004, vol. 3383 of LNCS, pp. 239–250. Springer, 2004. doi: 10.1007/978-3-540-31843-9_25 1, 3
-
[22]
Z. Gao, C. Jiang, J. Zhang, X. Jiang, L. Li, P. Zhao, H. Yang, Y . Huang, and J. Li. Hierarchical graph learning for protein–protein interaction. Nature Communications, 14(1):1093, 2023. doi: 10.1038/s41467-023-36736-1 2
-
[23]
L. Giovannangeli, F. Lalanne, D. Auber, R. Giot, and R. Bourqui. Deep neural network for drawing networks, (DNN )2. In H. C. Purchase and I. Rutter, eds., GD 2021, vol. 12868 of LNCS, pp. 375–390. Springer, 2021. doi: 10.1007/978-3-030-92931-2_27 2
-
[24]
F. Grötschla, J. Mathys, R. Veres, and R. Wattenhofer. CoRe-GD: A hierarchical framework for scalable graph visualization with GNNs. In ICLR 2024. OpenReview.net, 2024. doi: 10.48550/ARXIV.2402.06706 2
-
[25]
P. Hämäläinen, M. Tavast, and A. Kunnari. Evaluating large language mod- els in generating synthetic HCI research data: a case study. In A. Schmidt, K. Väänänen, T. Goyal, P. O. Kristensson, A. Peters, S. Mueller, J. R. Williamson, and M. L. Wilson, eds., CHI 2023, pp. 433:1–433:19. ACM,
work page 2023
-
[26]
doi: 10.1145/3544548.3580688 2, 9
- [27]
-
[28]
S. Hong, P. Eades, M. Torkel, Z. Wang, D. Chae, S. Hong, D. Langerenken, and H. Chafi. Multi-level graph drawing using infomap clustering. In D. Archambault and C. D. Tóth, eds., GD 2019, vol. 11904 of LNCS, pp. 139–146. Springer, 2019. doi: 10.1007/978-3-030-35802-0_11 3
-
[29]
T. Kamada and S. Kawai. An algorithm for drawing general undirected graphs. Inf. Process. Lett., 31(1):7–15, 1989. doi: 10.1016/0020-0190(89) 90102-6 3
-
[30]
M. Klammler, T. Mchedlidze, and A. Pak. Aesthetic discrimination of graph layouts. In T. Biedl and A. Kerren, eds., GD 2018, vol. 11282 of LNCS, pp. 169–184. Springer, 2018. doi: 10.1007/978-3-030-04414-5_12 2
-
[31]
J. F. Kruiger, P. E. Rauber, R. M. Martins, A. Kerren, S. G. Kobourov, and A. C. Telea. Graph layouts by t-SNE. Comput. Graph. Forum, 36(3):283– 294, 2017. doi: 10.1111/CGF.13187 1, 3
-
[32]
J. B. Kruskal. Multidimensional scaling by optimizing goodness of fit to a nonmetric hypothesis. Psychometrika, 29(1):1–27, 1964. doi: 10. 1007/BF02289565 3
work page 1964
-
[34]
S. Lee, S.-H. Kim, and B. C. Kwon. VLAT: Development of a Visu- alization Literacy Assessment Test. IEEE Trans. Vis. Comput. Graph., 23(1):551–560, 2017. doi: 10.1109/TVCG.2016.2598920 2
-
[35]
Z. Li, H. Miao, V . Pascucci, and S. Liu. Visualization literacy of mul- timodal large language models: A comparative study. arXiv preprint, abs/2407.10996, 2024. doi: 10.48550/arXiv.2407.10996 2
-
[36]
A. Liew and K. Mueller. Using large language models to generate engaging captions for data visualizations. In NLVIZ 2022, 2022. 2
work page 2022
-
[37]
L. Y . Lo and H. Qu. How good (or bad) are LLMs at detecting misleading visualizations? IEEE Trans. Vis. Comput. Graph., 31(1):1116–1125, 2025. doi: 10.1109/TVCG.2024.3456333 2
-
[38]
Y . Lu, D. Jiang, W. Chen, W. Y . Wang, Y . Choi, and B. Y . Lin. Wildvision: Evaluating vision-language models in the wild with human preferences. In NeurIPS 2024, pp. 48224–48255. Curran Associates, Inc., 2024. 4
work page 2024
-
[39]
M. R. Marner, R. T. Smith, B. H. Thomas, K. Klein, P. Eades, and S. Hong. GION: Interactively untangling large graphs on wall-sized displays. In C. A. Duncan and A. Symvonis, eds., GD 2014, vol. 8871 of LNCS, pp. 113–124. Springer, 2014. doi: 10.1007/978-3-662-45803-7_10 3
- [40]
-
[41]
T. Mchedlidze, A. Pak, and M. Klammler. Aesthetic discrimination of graph layouts. J. Graph Algorithms Appl., 23(3):525–552, 2019. doi: 10. 7155/JGAA.00501 2
work page 2019
- [42]
-
[43]
doi: 10.1007/978-3-031-49272-3_18 3
-
[44]
G. J. Mooney, H. C. Purchase, M. Wybrow, S. G. Kobourov, and J. Miller. The perception of stress in graph drawings. In S. Felsner and K. Klein, eds., GD 2024, vol. 320 of LIPIcs, pp. 21:1–21:17. Schloss Dagstuhl,
work page 2024
-
[45]
doi: 10.4230/LIPICS.GD.2024.21 1, 2, 3, 4, 5, 6, 7, 8, 9
-
[46]
Q. H. Nguyen, P. Eades, and S. Hong. On the faithfulness of graph visualizations. In S. Carpendale, W. Chen, and S. Hong, eds., PacificVis 2013, pp. 209–216. IEEE, 2013. doi: 10.1109/PACIFICVIS.2013.6596147 3
-
[47]
A. Noack. Energy models for graph clustering. J. Graph Algorithms Appl., 11(2):453–480, 2007. doi: 10.7155/JGAA.00154 1, 3
-
[48]
OpenAI prompt engineering best practices, 2024
OpenAI. OpenAI prompt engineering best practices, 2024. Accessed: 2025-03-14. 4
work page 2024
-
[49]
R. Y . Pang, H. Schroeder, K. S. Smith, S. Barocas, Z. Xiao, E. Tseng, and D. Bragg. Understanding the LLM-ification of CHI: Unpacking the impact of LLMs at CHI through a systematic literature review. In P. Toups-Dugas, B. Lee, and M. Chetty, eds., CHI 2025. ACM, 2025. to appear. doi: 10. 48550/ARXIV.2501.12557 2
-
[50]
P. Pascual-Ferrá, N. Alperstein, and D. J. Barnett. Social network analysis of COVID-19 public discourse on Twitter: implications for risk communi- cation. Disaster medicine and public health preparedness, 16(2):561–569,
-
[51]
doi: 10.1017/dmp.2020.347 2
-
[52]
L. Podo, M. Ishmal, and M. Angelini. Vi(E)va LLM! A conceptual stack for evaluating and interpreting generative AI-based visualizations. arXiv preprint, abs/2402.02167, 2024. doi: 10.48550/ARXIV.2402.02167 2
-
[53]
M. Prpa, G. M. Troiano, M. Wood, and Y . Coady. Challenges and op- portunities of LLM-based synthetic personae and data in HCI. In F. F. Mueller, P. Kyburz, J. R. Williamson, and C. Sas, eds.,CHI EA 2024, pp. 461:1–461:5. ACM, 2024. doi: 10.1145/3613905.3636293 2
-
[54]
H. C. Purchase. Metrics for graph drawing aesthetics. J. Vis. Lang. Comput., 13(5):501–516, 2002. doi: 10.1006/JVLC.2002.0232 3
-
[55]
H. C. Purchase, D. A. Carrington, and J. Allder. Empirical evaluation of aesthetics-based graph layout. Empir. Softw. Eng., 7(3):233–255, 2002. doi: 10.1023/A:1016344215610 3
-
[56]
H. C. Purchase, R. F. Cohen, and M. I. James. Validating graph drawing aesthetics. In F. Brandenburg, ed., GD 1995, vol. 1027 of LNCS, pp. 435–446. Springer, 1995. doi: 10.1007/BFB0021827 8
-
[57]
Sentence- BERT : Sentence Embeddings using S iamese BERT -Networks
N. Reimers and I. Gurevych. Sentence-BERT: Sentence embeddings using Siamese BERT-networks. In K. Inui, J. Jiang, V . Ng, and X. Wan, eds., EMNLP-IJCNLP 2019, pp. 3980–3990. Association for Computational Linguistics, 2019. doi: 10.18653/V1/D19-1410 7
-
[58]
L. Reynolds and K. McDonell. Prompt programming for large language models: Beyond the few-shot paradigm. In Y . Kitamura, A. Quigley, K. Isbister, and T. Igarashi, eds., CHI EA 2021, pp. 314:1–314:7. ACM,
work page 2021
-
[59]
doi: 10.1145/3411763.3451760 4
-
[60]
J. W. Sammon. A nonlinear mapping for data structure analysis. IEEE Trans. Computers, 18(5):401–409, 1969. doi: 10.1109/T-C.1969.222678 3
-
[61]
V . Schetinger, S. Di Bartolomeo, M. El-Assady, A. M. McNutt, M. Miller, J. P. A. Passos, and J. L. Adams. Doom or deliciousness: Challenges and opportunities for visualization in the age of generative models. Comput. Graph. Forum, 42(3):423–435, 2023. doi: 10.1111/CGF.14841 2
-
[62]
H. Shen, T. Li, T. J. Li, J. S. Park, and D. Yang. Shaping the emerging norms of using large language models in social computing research. In C. Fiesler, L. G. Terveen, M. Ames, S. R. Fussell, E. Gilbert, V . Liao, X. Ma, X. Page, M. Rouncefield, V . Singh, and P. J. Wisniewski, eds., CSCW 2023, pp. 569–571. ACM, 2023. doi: 10.1145/3584931.3606955 2
-
[63]
R. N. Shepard. The analysis of proximities: Multidimensional scaling with an unknown distance function. I. Psychometrika, 27(2):125–140,
-
[64]
doi: 10.1007/BF02289630 3
-
[65]
P. Simonetto, D. Archambault, and S. G. Kobourov. Drawing dynamic graphs without timeslices. In F. Frati and K. Ma, eds., GD 2017, vol. 10692 of LNCS, pp. 394–409. Springer, 2017. doi: 10.1007/978-3-319 -73915-1_31 3
-
[66]
J. Tang, F. Yang, J. Wu, Y . Wang, J. Zhou, X. Cai, L. Yu, and Y . Wu. A comparative study on fixed-order event sequence visualizations: Gantt, extended Gantt, and stringline charts. IEEE Trans. Vis. Comput. Graph., 30(12):7687–7701, 2024. doi: 10.1109/TVCG.2024.3358919 5
-
[67]
M. Taylor and P. Rodgers. Applying graphical design techniques to graph visualisation. In IV 2005, pp. 651–656. IEEE, 2005. doi: 10.1109/IV.2005 .19 8
-
[68]
Y . Tian, W. Cui, D. Deng, X. Yi, Y . Yang, H. Zhang, and Y . Wu. ChartGPT: Leveraging LLMs to generate charts from abstract natural language. IEEE Trans. Vis. Comput. Graph., 31(3):1731–1745, 2025. doi: 10.1109/TVCG. 2024.3368621 2
-
[69]
R. J. Tibshirani and B. Efron. An introduction to the bootstrap. Mono- graphs on statistics and applied probability, 57(1):1–436, 1993. 5
work page 1993
-
[70]
W. S. Torgerson. Multidimensional scaling: I. Theory and method. Psy- chometrika, 17(4):401–419, 1952. doi: 10.1007/BF02288916 3
-
[71]
L. van der Maaten and G. Hinton. Visualizing data using t-SNE. Journal of Machine Learning Research, 9(86):2579–2605, 2008. 7
work page 2008
- [72]
-
[73]
S. van Wageningen, T. Mchedlidze, and A. C. Telea. An experimental evaluation of viewpoint-based 3D graph drawing. Comput. Graph. Forum, 43(3), 2024. doi: 10.1111/CGF.15077 3
-
[74]
P. Vázquez. Are LLMs ready for visualization? In PacificVis 2024, pp. 343–352. IEEE, 2024. doi: 10.1109/PACIFICVIS60374.2024.00049 2
-
[75]
A. Wang, J. Morgenstern, and J. P. Dickerson. Large language models that replace human participants can harmfully misportray and flatten identity groups. Nature Machine Intelligence, 7:400–411, 2025. doi: 10.1038/ s42256-025-00986-z 9
work page 2025
-
[76]
H. W. Wang, J. Hoffswell, S. M. T. Thane, V . S. Bursztyn, and C. X. Bearfield. How aligned are human chart takeaways and LLM predictions? A case study on bar charts with varying layouts. IEEE Trans. Vis. Comput. Graph., 31(1):536–546, 2025. doi: 10.1109/TVCG.2024.3456378 2
-
[77]
L. Wang, S. Zhang, Y . Wang, E. Lim, and Y . Wang. LLM4Vis: Explainable visualization recommendation using ChatGPT. In M. Wang and I. Zitouni, eds., EMNLP 2023, pp. 675–692. Assoc. f. Comput. Linguistics, 2023. doi: 10.18653/V1/2023.EMNLP-INDUSTRY.64 2
-
[78]
X. Wang, K. Yen, Y . Hu, and H. Shen. DeepGD: A deep learning frame- work for graph drawing using GNN. IEEE Computer Graphics and Applications, 41(5):32–44, 2021. doi: 10.1109/MCG.2021.3093908 2
-
[79]
X. Wang, K. Yen, Y . Hu, and H. Shen. SmartGD: A GAN-based graph drawing framework for diverse aesthetic goals. IEEE Trans. Vis. Comput. Graph., 30(8):5666–5678, 2024. doi: 10.1109/TVCG.2023.3306356 2
-
[80]
Y . Wang, Z. Jin, Q. Wang, W. Cui, T. Ma, and H. Qu. DeepDrawing: A deep learning approach to graph drawing. IEEE Trans. Vis. Comput. Graph., 26(1):676–686, 2020. doi: 10.1109/TVCG.2019.2934798 2
-
[81]
J. Wei, X. Wang, D. Schuurmans, M. Bosma, B. Ichter, F. Xia, E. H. Chi, Q. V . Le, and D. Zhou. Chain-of-thought prompting elicits reasoning in large language models. In NeurIPS 2022, 2022. 4, 5
work page 2022
-
[82]
E. Welch and S. G. Kobourov. Measuring symmetry in drawings of graphs. Comput. Graph. Forum, 36(3):341–351, 2017. doi: 10.1111/CGF.13192 3
discussion (0)
Sign in with ORCID, Apple, or X to comment. Anyone can read and Pith papers without signing in.