REVIEW 4 major objections 5 minor 1 cited by
Self-consistent population synthesis of AGN from observational constraints in the X-rays
T0 review · 4 major / 5 minor · reviewed 2026-08-07 · deepseek-v4-flash
Pith's one-line read A self-consistent ray-traced AGN population reproduces the X-ray background and obscuration at once, and yields a 21±7% intrinsic Compton-thick fraction.
desk verdict The paper's real contribution is structural—absorption and reflection finally come from one matter distribution—but the headline 21±7% CT fraction is a model-dependent output, not yet a measured number. read the letter →
The pith
A machine-rendered reading of the paper's core claim, the machinery that carries it, and where it could break.
The reading
What carries the argument
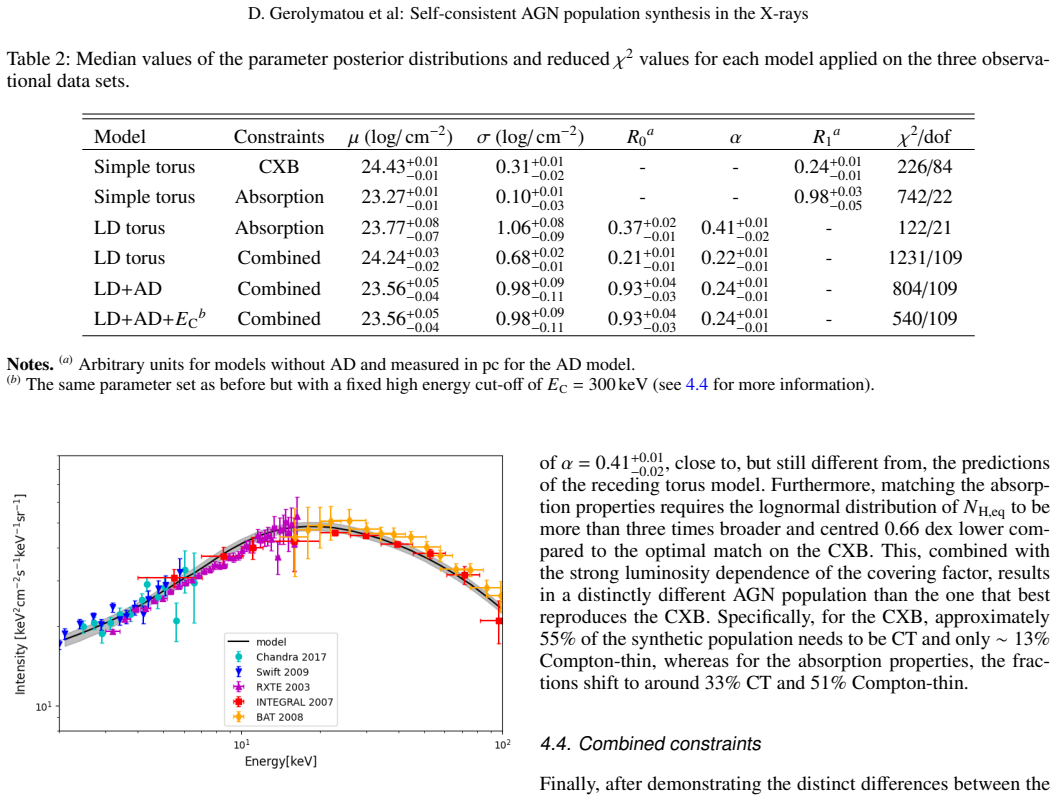
The machinery is a grid of 2–100 keV spectra computed with the ray-tracing code RefleX for a torus as a function of equatorial column density and inner-to-outer radius ratio, with a lamp-post double source above and below an accretion disk in the final model. The load-bearing identities are Eq. (4), which turns the observation angle $\theta_{\rm obs}$ into a line-of-sight $N_{\rm H}$ for a homogeneous torus, and Eq. (3), the luminosity-dependent inner radius that makes the covering factor fall with intrinsic luminosity; the slope of that relation, $\alpha$, is the parameter that carries the absorbed-fraction–luminosity trend. Simulation-based inference (SNPE) maps the four observables to posteriors over the mean and width of the lognormal equatorial-column distribution, the radius normalization, and $\alpha$.
What would settle it
A direct check is to measure line-of-sight $N_{\rm H}$ for local AGN whose torus inclination is known from infrared interferometry or polarization and test the single-valued mapping of Eq. (4). Failing that, a clumpy-torus population synthesis fitted to the same four constraints that reproduces them with a materially different intrinsic Compton-thick fraction, or a high-redshift hard-X-ray survey whose measured CT fraction disagrees with the constant 21±7% prediction, would falsify the central claim.
Extended reading notes
Core claim
The central claim is that a 'LD+AD' geometry—a cold, homogeneous dusty torus whose dust-sublimation radius scales with luminosity as $r_{\rm dust}\propto L^{\alpha}$ with fitted $\alpha=0.24\pm0.01$, joined to an optically thick accretion disk, with the line-of-sight column density set purely by inclination through Eq. (4)—simultaneously matches the cosmic X-ray background, the $N_{\rm H}$ distribution of local hard-X-ray-selected AGN, the absorbed fraction as a function of observed luminosity and redshift, and the observed trend of reflection with obscuration. Because emission, absorption, and reflection all come from the same matter distribution, the model has no free reflection parameter and no assumed intrinsic $N_{\rm H}$ distribution. The resulting intrinsic Compton-thick fraction is 21±7%, down from 50±2% when the disk is omitted, since unobscured and Compton-thin sources with the disk reflect enough to explain the 20–30 keV background peak without demanding many heavily obscured nuclei.
Load-bearing premise
The load-bearing premise is that the torus is a cold, homogeneous, non-clumpy structure, so that any line of sight through it always crosses optically thick material and the observed column is a single-valued function of viewing angle; if real tori are clumpy, the fitted luminosity slope and the derived 21±7% Compton-thick fraction could shift.
Editorial extensions
If this is right
- The cosmic X-ray background alone is a weak constraint: even a population of identical orientation-only tori reproduces it, so fitting the background cannot by itself fix the AGN population.
- Matching the absorption data forces the torus inner radius to grow roughly as $L^{0.24}$, flatter than the classical receding-torus prediction of $L^{0.5}$ and consistent with X-ray surveys.
- The accretion disk matters for reflection: dropping it raises the required intrinsic Compton-thick fraction from 21±7% to 50±2% and raises the Compton-thick contribution to the 14–195 keV background from about 7% to 28%.
- The same population reproduces the absorbed and unabsorbed X-ray luminosity functions, the Chandra, XMM-Newton, and NuSTAR number counts, and the covering-factor–luminosity trend, while overpredicting Swift/BAT 14–195 keV counts by 1–2σ.
Reading between the lines
- The homogeneous-torus assumption is the untested hinge: with a clumpy torus, $N_{\rm H}$ would scatter at fixed orientation, which could change $\alpha$ and the inferred intrinsic CT fraction; a clumpy-torus rerun of the same population synthesis is the nearest decisive experiment.
- The model's underpredicted high-redshift absorbed fraction might be cured without touching the torus by adding a galaxy-scale interstellar medium whose column density grows with redshift, as the paper hints.
- The fitted $\alpha\approx0.24$ is close to the $L^{-0.25}$ scaling predicted for clumpy tori, suggesting the luminosity dependence could be driven by the number of clouds rather than dust sublimation alone—an alternative the homogeneous model cannot distinguish.
Editorial analysis
A structured set of objections, weighed in public.
Referee Report
Summary. This paper presents a population synthesis model of AGN in the X-rays, using the ray-tracing code RefleX to self-consistently link absorption and reflection through the circumnuclear matter distribution. Three geometric models are considered: a simple homogeneous torus, a luminosity-dependent (LD) torus, and an LD torus with an accretion disk (LD+AD). Model parameters are inferred with simulation-based inference (SBI), using the cosmic X-ray background (CXB), the Swift/BAT NH distribution, and the Hasinger (2008) absorbed fraction as functions of luminosity and redshift. The claim is that the LD+AD model simultaneously reproduces all constraints, yielding a luminosity-dependent covering factor, number counts, a reflection–obscuration correlation, and an intrinsic Compton-thick fraction of 21±7%.
Significance. If the result held, the paper would be a valuable step toward physically motivated population synthesis, replacing assumed NH distributions and reflection parameters with self-consistent ray-traced models. The explicit treatment of survey selection functions and the use of SBI are strengths, as is the comparison of nested models of increasing complexity. The qualitative conclusion that a luminosity-dependent torus plus accretion disk is required to match both the CXB and absorption data is plausible and likely to survive further scrutiny. However, the quantitative claims (the CT fraction, the slope α, and the statement of 'simultaneous reproduction') are currently conditional on a homogeneous torus geometry and on a fit that is formally rejected at the statistical level.
major comments (4)
- [Table 2, §4.4] The best combined model, LD+AD, yields χ²/dof=804/109≈7.4, and even the EC=300 keV variant gives 540/109≈5.0; both are formally rejected at high confidence. The abstract's statement that the synthetic population 'simultaneously reproduces' the constraints overstates the fit quality. The paper should either report the formal rejection and adopt a model-inadequacy term (e.g., an added systematic error floor) or revise the claim to a qualitative best-match statement, since the derived CT fraction and α are conditioned on this model.
- [§3.3, §5.3, Eq. (4)] All models assume a cold, homogeneous, continuous torus for which the line-of-sight column is a deterministic function of inclination (Eq. 4). This assumption is load-bearing: the reflected spectrum, and hence the amount of CT AGN needed to match the CXB peak, is fixed by this mapping. The paper acknowledges in §5.3 that a clumpy torus 'could alter this relationship' but does not test it or bound the effect. A sensitivity analysis (e.g., injecting scatter in NH at fixed inclination, or comparing with a clumpy-torus realisation) is needed before the 21±7% CT fraction and the fitted slope α=0.24 can be regarded as robust.
- [§4.4, §5.4] The LD+AD model underpredicts the absorbed AGN fraction at high redshift by about 25%, and the paper attributes this to the lack of redshift evolution in the torus parameters. This contradicts the abstract's claim that the absorption properties are reproduced 'including their redshift and luminosity evolution.' The text should be revised to state explicitly that the luminosity dependence is reproduced while the redshift dependence is not, and the H08 integrated fraction is matched only because it is averaged over redshift.
- [§3.2, §5.4] The 'derived' intrinsic CT fraction is an output of the fitted model, not an independent measurement: the parameters (μ, σ, R0, α) are inferred using, among other data, the R17 NH distribution that includes CT bins, and the XLF is normalised to the NH<10^24 population. The paper should clarify that 21±7% is a posterior prediction conditional on the assumed geometry and XLF, and that the quoted uncertainty does not include systematic errors from the clumpy-torus or evolution assumptions.
minor comments (5)
- [§4.4] The EC=300 keV check uses the same parameter posteriors as the EC=200 keV fit rather than a new fit; clarify that this is a post-hoc evaluation, not a re-optimisation.
- [Table 2] Table 2 lists reduced χ² values for all models, several of which exceed 5; adding p-values or a discussion of why the χ² metric is used despite the formal rejection would help readers calibrate the comparisons.
- [§5.4] The ±7% uncertainty on the CT fraction should be explicitly labelled as the 68% posterior spread only, excluding the systematic effects discussed in the major comments.
- [§3.4] The weight N_XLF/(N_sample − N_CT) depends on N_CT, which is itself a function of the inferred parameters; a sentence explaining how N_CT is computed during the inference would remove ambiguity.
- [Fig. 12] The model curves are compared to observed reflection–obscuration data without applying survey selection functions; the text should state that the comparison is qualitative only, as is already hinted.
Circularity Check
No significant circularity: the model parameters are fitted to observational constraints, and the derived quantities are checked against independent data; self-citations are present but not load-bearing.
full rationale
The paper is an inference/fitting study rather than a derivation from first principles, and its central results do not reduce to their inputs by construction. The SBI posteriors are obtained from four constraints (CXB, observed NH distribution, absorbed fraction versus luminosity, and absorbed fraction versus redshift). Derived quantities such as the intrinsic CT fraction, the split XLF, the covering-factor-luminosity relation, and the reflection-obscuration correlation are deterministic functions of the fitted parameters and the assumed torus geometry, but they are not identical to the constraints. In particular, the intrinsic CT fraction is obtained by integrating the fitted parent NH,eq distribution above 10^24 cm^-2 after normalizing the LF to the NH<10^24 XLF (Sec. 3.2), and it is then compared with external local measurements rather than claimed as an independent prediction. The observed NH distribution does include Compton-thick bins, so the CT fraction is inferred from that constraint, but inference from a constraint is not circularity. The covering-factor comparison with Ricci et al. (2022) in Fig. 9 uses a dataset not used in the fit, and the number counts and reflection-obscuration trends in Figs. 11-12 are also external, making those checks genuine. Several cited inputs are authored or coauthored by the present authors (RefleX: Paltani & Ricci 2017; the R17 NH data: Ricci et al. 2017a; McKaig et al. 2022), but these are published, reproducible data or codes and are not invoked as a uniqueness theorem to exclude alternatives. The acknowledged homogeneous, non-clumpy torus assumption in Sec. 5.3 is a model limitation that affects robustness, but it is not circular because it does not define the results in terms of themselves. No step reduces by construction to its own input; only the density of self-citations warrants a minimal nonzero score.
Assumptions & free parameters
free parameters (4)
- mu (mean of log NH_eq distribution) =
23.56 (LD+AD combined, Table 2)
- sigma (scatter of log NH_eq distribution) =
0.98 (LD+AD combined)
- R0 (torus inner edge normalization) =
0.93 (LD+AD combined, in pc)
- alpha (luminosity slope of inner edge) =
0.24 (LD+AD combined)
assumptions (6)
- domain assumption The circumnuclear matter is a cold, homogeneous dusty torus, with line-of-sight column density given by Eq. (4).
- domain assumption The intrinsic equatorial column density NH_eq follows a lognormal distribution with free mean mu and scatter sigma.
- domain assumption The U03 XLF represents the intrinsic AGN population for NH < 10^24 cm^-2, and the synthetic population is normalized to it in that regime.
- domain assumption The primary X-ray emission is a power law with Gamma = 1.9 and cutoff EC = 200 or 300 keV, emitted from the torus center or from a lamp-post double source.
- domain assumption AGN obscuration arises only from the torus (and the optically thick accretion disk in LD+AD), with no host-galaxy ISM contribution.
- domain assumption The receding-torus relation rdust = R0 (L/10^44)^alpha with free R0 and alpha controls the covering factor.
Cite this review
Pith. "Pith review of Self-consistent population synthesis of AGN from observational constraints in the X-rays." pith.science (2026). https://pith.science/paper/7Y42QT4S
@misc{pith2026250614885,
  author       = {Pith},
  title        = {Pith review of: Self-consistent population synthesis of AGN from observational constraints in the X-rays},
  year         = {2026},
  howpublished = {\url{https://pith.science/paper/7Y42QT4S}},
  note         = {Machine review of arXiv:2506.14885}
}
abstract
The cosmic X-ray background (CXB) is produced by the emission of unresolved active galactic nuclei (AGN), thus providing key information about the properties of the primary and reprocessed X-ray emission components of the AGN population. Equally important, studies of individual sources provide additional constraints on the properties of AGN, such as their luminosity and obscuration. Until now, these constraints have not been self-consistently addressed by intrinsically linking emission, absorption, and reflection. Here we perform numerical simulations with the ray-tracing code, RefleX, which allows us to self-consistently model the X-ray emission of AGN with flexible geometries for the circumnuclear medium. Using the RefleX-simulated emission of an AGN population, we attempt to simultaneously reproduce the CXB and absorption properties measured in the X-rays, namely the observed fraction of $N_{\mathrm{H}}$ in bins of log($N_{\mathrm{H}}$) and the fraction of absorbed AGN, including their redshift and luminosity evolution. We sample an intrinsic X-ray luminosity function and construct gradually more complex physically motivated geometrical models. We examine how well each model can match all observational constraints using a simulation-based inference (SBI) approach. We find that, while the simple unification model can reproduce the CXB, a luminosity dependent dusty torus is needed to reproduce the absorption properties. When adding an accretion disc, the model best matches all constraints simultaneously. Our synthetic population is able to reproduce the dependence of the covering factor on luminosity, the AGN number counts from several surveys, and the observed correlation between reflection and obscuration. Finally, we derive an intrinsic Compton-thick fraction of 21$\pm$7%, consistent with local observations.
Figures


Figures from the paper (11 more)



Forward citations
Cited by 1 Pith paper
-
Unification models of Active Galactic Nuclei
Overview chapter summarizing traditional orientation-based and radiation-regulated unification models for AGN, including evolutionary aspects and changing-look AGN.
Reference graph
Works this paper leans on
-
[1]
L., Georgakakis, A., et al
Aird, J., Coil, A. L., Georgakakis, A., et al. 2015, MNRAS, 451, 1892
2015
-
[2]
2008, ApJ, 689, 666
Ajello, M., Greiner, J., Sato, G., et al. 2008, ApJ, 689, 666
2008
-
[3]
2012, A&A, 546, A98
Akylas, A., Georgakakis, A., Georgantopoulos, I., Brightman, M., & Nandra, K. 2012, A&A, 546, A98
2012
- [4]
-
[5]
T., Treister, E., Urry, C
Ananna, T. T., Treister, E., Urry, C. M., et al. 2019, ApJ, 871, 240
2019
-
[6]
T., Weigel, A
Ananna, T. T., Weigel, A. K., Trakhtenbrot, B., et al. 2022, ApJS, 261, 9
2022
-
[7]
1993, ARA&A, 31, 473
Antonucci, R. 1993, ARA&A, 31, 473
1993
-
[8]
Arnaud, K. A. 1996, in Astronomical Society of the Pacific Conference Series, V ol. 101, Astronomical Data Analysis Software and Systems V , ed. G. H. Jacoby & J. Barnes, 17 Balokovi´c, M., Harrison, F. A., Madejski, G., et al. 2020, ApJ, 905, 41
work page 1996
Show all 70 references
-
[9]
H., Tueller, J., Markwardt, C
Baumgartner, W. H., Tueller, J., Markwardt, C. B., et al. 2013, ApJS, 207, 19
2013
-
[10]
G., Gandhi, P., Buchner, J., et al
Boorman, P. G., Gandhi, P., Buchner, J., et al. 2025, ApJ, 978, 118
2025
-
[11]
Brandt, W. N. & Alexander, D. M. 2015, A&A Rev., 23, 1
2015
-
[12]
Brandt, W. N. & Yang, G. 2022, in Handbook of X-ray and Gamma-ray Astro- physics, ed. C. Bambi & A. Sangangelo, 78
2022
-
[13]
& Nandra, K
Brightman, M. & Nandra, K. 2011, MNRAS, 413, 1206
2011
-
[14]
2015, ApJ, 802, 89
Buchner, J., Georgakakis, A., Nandra, K., et al. 2015, ApJ, 802, 89
2015
-
[15]
2011, ApJ, 728, 58
Burlon, D., Ajello, M., Greiner, J., et al. 2011, ApJ, 728, 58
2011
-
[16]
2017, ApJ, 837, 19
Cappelluti, N., Li, Y ., Ricarte, A., et al. 2017, ApJ, 837, 19
2017
-
[17]
2012, MNRAS, 427, 651
Cappelluti, N., Ranalli, P., Roncarelli, M., et al. 2012, MNRAS, 427, 651
2012
-
[18]
2007, A&A, 467, 529
Churazov, E., Sunyaev, R., Revnivtsev, M., et al. 2007, A&A, 467, 529
2007
-
[19]
N., Aird, J., Evans, P
Delaney, J. N., Aird, J., Evans, P. A., et al. 2023, MNRAS, 521, 1620
2023
-
[20]
Draine, B. T. 2003, ApJ, 598, 1026
2003
-
[21]
Draper, A. R. & Ballantyne, D. R. 2009, ApJ, 707, 778
2009
-
[22]
& Walter, R
Esposito, V . & Walter, R. 2016, A&A, 590, A49
2016
-
[23]
2000, ApJ, 539, L13
Gebhardt, K., Bender, R., Bower, G., et al. 2000, ApJ, 539, L13
2000
-
[24]
1994, MNRAS, 267, 743
Ghisellini, G., Haardt, F., & Matt, G. 1994, MNRAS, 267, 743
1994
-
[25]
2007, A&A, 463, 79
Gilli, R., Comastri, A., & Hasinger, G. 2007, A&A, 463, 79
2007
-
[26]
2022, A&A, 666, A17 GRA VITY Collaboration, Dexter, J., Shangguan, J., et al
Gilli, R., Norman, C., Calura, F., et al. 2022, A&A, 666, A17 GRA VITY Collaboration, Dexter, J., Shangguan, J., et al. 2020, A&A, 635, A92
2022
-
[27]
S., Nonnenmacher, M., & Macke, J
Greenberg, D. S., Nonnenmacher, M., & Macke, J. H. 2019, arXiv e-prints, arXiv:1905.07488
2019 arXiv
-
[28]
E., Matteson, J
Gruber, D. E., Matteson, J. L., Peterson, L. E., & Jung, G. V . 1999, ApJ, 520, 124 Güver, T. & Özel, F. 2009, MNRAS, 400, 2050
1999
-
[29]
& Maraschi, L
Haardt, F. & Maraschi, L. 1991, ApJ, 380, L51
1991
-
[30]
A., Aird, J., Civano, F., et al
Harrison, F. A., Aird, J., Civano, F., et al. 2016, ApJ, 831, 185
2016
-
[31]
2008, A&A, 490, 905
Hasinger, G. 2008, A&A, 490, 905
2008
-
[32]
Hickox, R. C. & Alexander, D. M. 2018, ARA&A, 56, 625 Hönig, S. F. & Beckert, T. 2007, MNRAS, 380, 1172
2018
-
[33]
2020, A&A, 639, A51
Iwasawa, K., Comastri, A., Vignali, C., et al. 2020, A&A, 639, A51
2020
-
[34]
Kormendy, J. & Ho, L. C. 2013, ARA&A, 51, 511
2013
-
[35]
2017, ApJ, 850, 74
Koss, M., Trakhtenbrot, B., Ricci, C., et al. 2017, ApJ, 850, 74
2017
-
[36]
1991, MNRAS, 252, 586
Lawrence, A. 1991, MNRAS, 252, 586
1991
-
[37]
D., Xue, Y
Lehmer, B. D., Xue, Y . Q., Brandt, W. N., et al. 2012, ApJ, 752, 46
2012
-
[38]
2017, ApJS, 232, 8
Liu, T., Tozzi, P., Wang, J.-X., et al. 2017, ApJS, 232, 8
2017
-
[39]
2003, ApJ, 591, 1220
Lodders, K. 2003, ApJ, 591, 1220
2003
-
[40]
1998, AJ, 115, 2285
Magorrian, J., Tremaine, S., Richstone, D., et al. 1998, AJ, 115, 2285
1998
-
[41]
& Matt, G
Martocchia, A. & Matt, G. 1996, MNRAS, 282, L53 Article number, page 13 of 16 A&A proofs:manuscript no. Maindoc
1996
-
[42]
S., Carrera, F
Mateos, S., Warwick, R. S., Carrera, F. J., et al. 2008, A&A, 492, 51
2008
-
[43]
D., Wallis, C
McEwen, J. D., Wallis, C. G. R., Price, M. A., & Spurio Mancini, A. 2021, arXiv e-prints, arXiv:2111.12720
2021 arXiv
-
[44]
2022, MNRAS, 512, 2961
McKaig, J., Ricci, C., Paltani, S., & Satyapal, S. 2022, MNRAS, 512, 2961
2022
-
[45]
& Fabian, A
Miniutti, G. & Fabian, A. C. 2004, MNRAS, 349, 1435
2004
-
[46]
2009, A&A, 493, 501
Moretti, A., Pagani, C., Cusumano, G., et al. 2009, A&A, 493, 501
2009
-
[47]
M., Nikutta, R., Ivezi ´c, Ž., & Elitzur, M
Nenkova, M., Sirocky, M. M., Nikutta, R., Ivezi ´c, Ž., & Elitzur, M. 2008, ApJ, 685, 160
2008
-
[48]
& Ricci, C
Paltani, S. & Ricci, C. 2017, A&A, 607, A31
2017
-
[49]
M., et al
Paltani, S., Walter, R., McHardy, I. M., et al. 2008, A&A, 485, 707
2008
-
[50]
& Walter, R
Panagiotou, C. & Walter, R. 2019, A&A, 626, A40
2019
-
[51]
2021, A&A, 653, A162
Panagiotou, C., Walter, R., & Paltani, S. 2021, A&A, 653, A162
2021
-
[52]
A., Nandra, K., Stewart, G
Pounds, K. A., Nandra, K., Stewart, G. C., George, I. M., & Fabian, A. C. 1990, Nature, 344, 132 Ramos Almeida, C. & Ricci, C. 2017, Nature Astronomy, 1, 679
1990
-
[53]
2013, A&A, 555, A42
Ranalli, P., Comastri, A., Vignali, C., et al. 2013, A&A, 555, A42
2013
-
[54]
2003, A&A, 411, 329
Revnivtsev, M., Gilfanov, M., Sunyaev, R., Jahoda, K., & Markwardt, C. 2003, A&A, 411, 329
2003
-
[55]
T., Temple, M
Ricci, C., Ananna, T. T., Temple, M. J., et al. 2022, ApJ, 938, 67
2022
-
[56]
C., Fabian, A
Ricci, C., Ho, L. C., Fabian, A. C., et al. 2018, MNRAS, 480, 1819
2018
-
[57]
& Paltani, S
Ricci, C. & Paltani, S. 2023, ApJ, 945, 55
2023
-
[58]
J., et al
Ricci, C., Ueda, Y ., Koss, M. J., et al. 2015, ApJ, 815, L13
2015
-
[59]
Ricci, C., Walter, R., Courvoisier, T. J. L., & Paltani, S. 2011, A&A, 532, A102
2011
-
[60]
2015, MNRAS, 454, 1202
Sazonov, S., Churazov, E., & Krivonos, R. 2015, MNRAS, 454, 1202
2015
-
[61]
2023, MNRAS, 525, 4735
Tagliacozzo, D., Marinucci, A., Ursini, F., et al. 2023, MNRAS, 525, 4735
2023
-
[62]
2020, Journal of Open Source Software, 5, 2505
Tejero-Cantero, A., Boelts, J., Deistler, M., et al. 2020, Journal of Open Source Software, 5, 2505
2020
-
[63]
M., & Virani, S
Treister, E., Urry, C. M., & Virani, S. 2009, ApJ, 696, 110
2009
-
[64]
Tristram, K. R. W., Burtscher, L., Jaffe, W., et al. 2014, A&A, 563, A82
2014
-
[65]
Ueda, Y ., Akiyama, M., Hasinger, G., Miyaji, T., & Watson, M. G. 2014, ApJ, 786, 104
2014
-
[66]
2003, ApJ, 598, 886
Ueda, Y ., Akiyama, M., Ohta, K., & Miyaji, T. 2003, ApJ, 598, 886
2003
-
[67]
P., & Spaans, M
Wada, K., Papadopoulos, P. P., & Spaans, M. 2009, ApJ, 702, 63
2009
-
[68]
Wilkins, D. R. & Fabian, A. C. 2011, MNRAS, 414, 1269
2011
-
[69]
Willingale, R., Starling, R. L. C., Beardmore, A. P., Tanvir, N. R., & O’Brien, P. T. 2013, MNRAS, 431, 394
2013
-
[70]
2018, ApJ, 854, 33 Article number, page 14 of 16 D
Zappacosta, L., Comastri, A., Civano, F., et al. 2018, ApJ, 854, 33 Article number, page 14 of 16 D. Gerolymatou et al: Self-consistent AGN population synthesis in the X-rays Appendix A: SBI posteriors Fig. A.1: Parameter posteriors using the simple torus model when applied on...
2018
Reviewed August 7, 2026 · model on record in the stance chip above.
Discussion (0). Sign in to comment.