REVIEW 4 major objections 8 minor 63 references
Candidate Dark Galaxy-2: Validation and Analysis of an Almost Dark Galaxy in the Perseus Cluster
T0 review · 4 major / 8 minor · reviewed 2026-08-06 · deepseek-v4-flash
Pith's one-line read First galaxy found purely through its globular clusters.
desk verdict Likely a real galaxy, but the paper's central claim of diffuse light lacks a quantitative significance, so the physical numbers are provisional until that is nailed down. read the letter →
The pith
A machine-rendered reading of the paper's core claim, the machinery that carries it, and where it could break.
The reading
What carries the argument
The detection pipeline is a trans-dimensional Markov chain Monte Carlo point-process model that treats globular cluster positions as three overlapping point processes (intergalactic medium, bright galaxies, and UDG/dark galaxies) and outputs a posterior probability map for the location of UDG/dark galaxy centers; the diffuse-light validation proceeds by iterative PSF photometry of the four clusters, Gaussian smoothing of the cluster-subtracted image, and elliptical isophote fitting on both stacked HST and Euclid data. The globular-cluster-to-halo mass scalings, specifically $M_{\mathrm{GC}}/M_h \approx 2.9 \times 10^{-5}$ from Harris et al. (2017) and $M_h \approx 5 \times 10^9 N_{\mathrm{GC}} \, M_\odot$ from Burkert & Forbes (2020), convert the four detected clusters into a dark matter halo mass estimate, yielding the 99.94% to 99.99% dark matter fraction.
What would settle it
A targeted observation that would settle the claim: acquire deep, higher-resolution imaging or spectroscopy that can separate the diffuse component from the globular clusters' point-spread-function wings; for example, JWST/NIRCam imaging where the PSF is much narrower, or a spectrum of the diffuse light showing stellar absorption lines. If the diffuse signal disappears once accurate PSF wings are modeled, or if the detected light is shown to be an artifact of background subtraction, the central claim fails.
Extended reading notes
Core claim
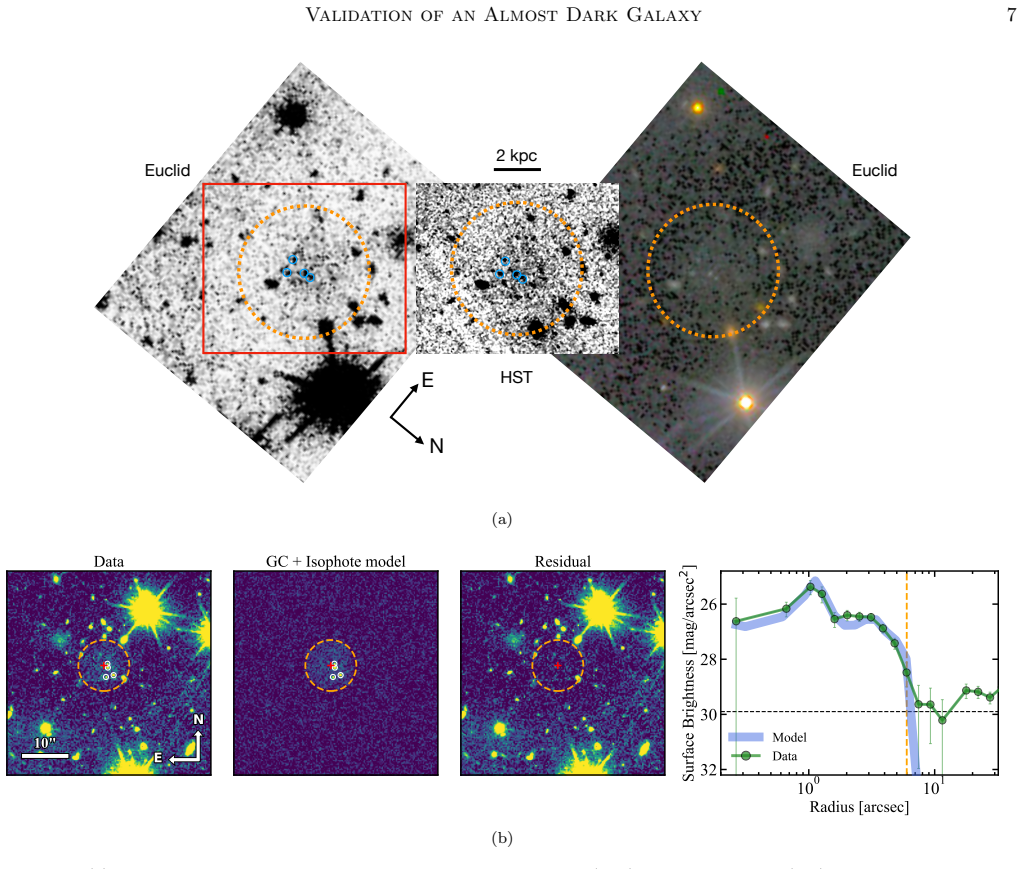
The paper claims that CDG-2 is a galaxy. The four globular clusters, spanning roughly 1.2 kpc, are not a chance clumping of intergalactic globular clusters: a Bayesian point-process analysis puts the chance probability at about $1.5 \times 10^{-5}$, and the stacked HST and Euclid images both show diffuse emission with the same morphology around the clusters. The measured mean surface brightness is about 27 mag arcsec$^{-2}$ in the Euclid band, and after subtracting the cluster point-spread functions and fitting elliptical isophotes, the residual diffuse light yields a total luminosity of $L_{V,\mathrm{gal}} = 6.2 \pm 3.0 \times 10^6\,L_\odot$. The authors present this as the first detection of a galaxy that was found through its globular cluster population alone, and they argue that the concordance of two independent data sets, together with the extremely low chance probability of the clustering, justifies calling CDG-2 an almost dark galaxy.
Load-bearing premise
The diffuse emission at about 27 mag arcsec$^{-2}$ around the four globular clusters is real galaxy light rather than residual flux from the clusters' point-spread functions or a systematic error in the local background subtraction used before isophote fitting.
Editorial extensions
If this is right
- CDG-2 is one of the faintest galaxies known to host globular clusters, with one of the highest globular-cluster light fractions ever measured (at least 16.6%, and likely ~33% if a canonical globular cluster luminosity function is assumed).
- If CDG-2 has a canonical GC luminosity function, its dark matter halo mass fraction rises to ≳99.99%, making it potentially the most dark-matter-dominated galaxy known.
- The existence of CDG-2 supports formation scenarios in which most star formation occurred in dense, massive clusters that later became globular clusters, with little diffuse star formation in the field.
- The confirmation of CDG-2 makes CDG-1, a similar globular cluster clump with no detected diffuse emission, a plausible even-more-extreme twin; if CDG-1 is a real galaxy, it could be the first object with essentially no field stars around its globular clusters.
- These objects provide testbeds for dark matter models, such as fuzzy or axionic dark matter, through the presence of compact dark matter halos that can host such extreme systems.
Reading between the lines
- The close coupling between the inferred GC light fraction and the assumed distance (Figure 4) suggests that a single radial-velocity measurement of one of the four globular clusters would sharpen the halo mass estimate dramatically; this is a concrete next step, though the paper does not spell it out as a prioritized observation.
- The same stacking-and-isophote validation strategy used here could be applied to the other globular cluster overdensities already found in Perseus, notably CDG-1, to determine whether almost dark galaxies are a population rather than a single anomaly.
- If the diffuse emission in CDG-2 is confirmed spectroscopically, the GC-overdensity search method becomes a general tool for finding galaxies that are invisible in conventional surface-brightness surveys, potentially enlarging the census of extreme dark-matter-dominated dwarfs in Euclid data.
Editorial analysis
A structured set of objections, weighed in public.
Referee Report
Summary. This manuscript reports the discovery and validation of Candidate Dark Galaxy-2 (CDG-2), a compact grouping of four globular cluster (GC) candidates in the Perseus cluster, originally found in Li et al. (2025a) using a statistical spatial-clustering analysis of GCs. The authors stack two HST/ACS images and use Euclid Early Release Observations to claim the detection of extremely faint diffuse emission (~27 mag/arcsec^2) surrounding the four GCs. They present a combined PSF-photometry and elliptical-isophote model to estimate the diffuse light, apply a mock-galaxy injection correction for flux outside the fitted isophotes, and cross-check the GC light fraction with Subaru and CFHT data. Under the assumption that the four GCs are the complete GC population, they derive a total V-band luminosity of (6.2±3.0)×10^6 L_sun and a GC light fraction of at least 16.6%; assuming a canonical GCLF raises the fraction to ~33%. They conclude that CDG-2 is the first galaxy discovered purely through its GC population and one of the most dark-matter-dominated galaxies known.
Significance. If the diffuse-emission detection holds up, this is an important result: CDG-2 would be the first galaxy confirmed through its GC population alone, and its extreme GC-to-total light ratio (16.6% or higher) would provide a strong constraint on galaxy formation scenarios in which most star formation occurs in massive, dense clusters. The statistical detection of the GC clump is well quantified (posterior/prior ~2000; chance probability ~1.5×10^-5), and the independent confirmation in Euclid data is a notable strength. The paper also benefits from a transparent description of its assumptions and from the mock-injection test in Appendix A. However, the central claim—the detection of diffuse emission—currently lacks a quantitative significance assessment, and the isophote-fitting procedure is not specified in enough detail to rule out systematic artifacts. These gaps undermine the 'exceptionally strong evidence' for a galaxy until addressed.
major comments (4)
- [Section 5, Figure 3(b)] The diffuse-emission detection is asserted as 'significant' but no signal-to-noise ratio or detection significance is reported. The quoted uncertainty M_iso = -12.3 ± 0.62 mag is the dispersion of the isophote model over 100 iterations of the same fitting pipeline, not a comparison with the local noise or with a blank-sky control. Please provide: (i) the S/N of the diffuse component in both the stacked HST and Euclid images; (ii) the residual noise statistics after background subtraction; and (iii) a control experiment (e.g., running the same PSF+isophote fit at random 'empty' positions, or injecting only the four GCs without diffuse light) to show that PSF-wing residuals and background-subtraction systematics cannot produce the detected flux.
- [Section 5] The background subtraction and isophote-fitting parameters are under-specified. The text mentions a 'SExtractor-like local background estimator' and a 6'' aperture for masking CDG-2 but does not give the background mesh size, the box size, or the criteria used to 'reject unrealistic results' when isophote centers are allowed to float. These choices directly affect the measured diffuse flux at ~27 mag/arcsec^2, which is close to the sky-noise limit. Please specify all parameters (including Gaussian smoothing scale in physical units) and demonstrate stability of the diffuse flux and GC light fraction to reasonable variations in the background scale and isophote constraints.
- [Section 5] The Subaru and CFHT cross-checks are described as supporting the 'quite robust' GC light-fraction estimate, but the manuscript provides no uncertainties or procedural details for these data, reporting only '~18%' and '~22%'. Without error bars or a description of the fitting procedure (or a reference to a companion paper), these numbers cannot be used to validate the Euclid-based result. Please either present the full analysis or temper the robustness claim.
- [Section 6.1, Figure 4] The argument that d_CDG-2 ≳35 Mpc is based on the claim that a bottom-heavy GCLF is 'rather unlikely' and 'has never been found before.' This uses the observed GC magnitude distribution to constrain the distance under an assumed GCLF, while the paper's own Section 6.3 acknowledges that dwarf-regime galaxies and UDGs may have non-canonical GCLFs. Please clarify that this distance constraint is conditional on the canonical-GCLF assumption and does not independently support the GCLF-corrected ratios.
minor comments (8)
- [Section 2] The text 'the the final measurements' contains a duplicated article; please fix.
- [Section 4] The chance probability of 1.5×10^-5 is quoted without explaining how it is computed from the posterior background counts; a more explicit description or reference would help.
- [Section 5] The filter transformation M_IE = M_V - 0.5 mag is given without a citation or SED assumption; please provide the reference and justify the offset.
- [Figure 3(b), right panel] Please define what the 'Model' and 'Data' curves represent and specify the aperture used for the radial profiles.
- [Table 1] The half-light radii for CDG-2-GCC3 and GCC4 are listed as ≲2 pc; please provide upper limits with proper uncertainty notation or a note clarifying the measurement.
- [Section 6.2] The specific frequency S_N = 345^{+323.1}_{-112.5} is reported without explanation of how the asymmetric uncertainties are derived; please clarify.
- [Software section] The list of software includes 'photoutils', which should be 'photutils'.
- [Acknowledgments] The informal sentence thanking J. Li for 'making sure that his eyes were not playing ticks on him' is out of place in a journal article; consider rewording.
Circularity Check
No circular derivation: the diffuse-emission validation rests on independent Euclid data and external scaling relations; self-citations are not load-bearing.
full rationale
The paper's central new claim is the detection of extremely faint diffuse emission around the four GCs of CDG-2. That detection is not a reduction to the input catalog or to the self-cited detection method: it is made in stacked HST images and independently in Euclid ERO data with matched morphology, which is an external benchmark. The GC-overdensity calculation uses the authors' published point-process model (Li et al. 2025a) and the new DOLPHOT catalog (Li et al. 2025b), but these establish only the prior target; they do not by construction produce the measured diffuse flux or its morphology. The quoted physical quantities (L_V,gal, GC light fraction, dark matter fraction) come from measured GC photometry, isophote fitting, a mock-injection recovery correction, and external mass-to-light and GC-to-halo relations; no fitted parameter is renamed as a prediction. The mock galaxy injection does reproduce the observed surface brightness profile, but it is used as a calibration of light loss in isophote fitting, not as evidence that the diffuse emission exists. The lack of an explicit signal-to-noise ratio or blank-sky control for the diffuse detection is a statistical robustness concern, not a circularity. The self-citations in the detection chain are non-load-bearing for the verification step, so the circularity score is low.
Assumptions & free parameters
free parameters (1)
- Mock galaxy injection parameters =
M*=10^7.4 Msun, [Fe/H]=-1, age=9 Gyr, n=0.5, eps=0.05, R_eff=1.5 kpc
assumptions (7)
- domain assumption Distance to CDG-2 is 75 Mpc (Perseus cluster distance)
- domain assumption The four point sources are genuine globular clusters
- domain assumption Canonical GCLF (M_TO=26.3 mag, sigma=1.1) applies for GCLF-corrected estimates
- domain assumption Mass-to-light ratios M/L_V = 2 (field) and 1.6 (GCs)
- domain assumption GC-to-halo mass relations (Harris et al. 2017; Burkert & Forbes 2020) apply to CDG-2
- domain assumption Statistical detection model (Li et al. 2025a) correctly models GC point processes
- domain assumption Isophote fitting and PSF photometry correctly separate GC and diffuse light
Cite this review
Pith. "Pith review of Candidate Dark Galaxy-2: Validation and Analysis of an Almost Dark Galaxy in the Perseus Cluster." pith.science (2026). https://pith.science/paper/L3LZODTR
@misc{pith2026250615644,
  author       = {Pith},
  title        = {Pith review of: Candidate Dark Galaxy-2: Validation and Analysis of an Almost Dark Galaxy in the Perseus Cluster},
  year         = {2026},
  howpublished = {\url{https://pith.science/paper/L3LZODTR}},
  note         = {Machine review of arXiv:2506.15644}
}
abstract
Candidate Dark Galaxy-2 (CDG-2) is a potential dark galaxy consisting of four globular clusters (GCs) in the Perseus cluster, first identified in Li et al. (2025) through a sophisticated statistical method. The method searched for over-densities of GCs from a \textit{Hubble Space Telescope} (\textit{HST}) survey targeting Perseus. Using the same \textit{HST} images and the new imaging data from the \textit{Euclid} survey, we report the detection of extremely faint but significant diffuse emission around the four GCs of CDG-2. We thus have exceptionally strong evidence that CDG-2 is a galaxy. This is the first galaxy detected purely through its GC population. Under the conservative assumption that the four GCs make up the entire GC population, preliminary analysis shows that CDG-2 has a total luminosity of $L_{V, \mathrm{gal}}= 6.2\pm{3.0} \times 10^6 L_{\odot}$ and a minimum GC luminosity of $L_{V, \mathrm{GC}}= 1.03\pm{0.2}\times 10^6 L_{\odot}$. Our results indicate that CDG-2 is one of the faintest galaxies having associated GCs, while at least $\sim 16.6\%$ of its light is contained in its GC population. This ratio is likely to be much higher ($\sim 33\%$) if CDG-2 has a canonical GC luminosity function (GCLF). In addition, if the previously observed GC-to-halo mass relations apply to CDG-2, it would have a minimum dark matter halo mass fraction of $99.94\%$ to $99.98\%$. If it has a canonical GCLF, then the dark matter halo mass fraction is $\gtrsim 99.99\%$. Therefore, CDG-2 may be the most GC dominated galaxy and potentially one of the most dark matter dominated galaxies ever discovered.
Figures


Figures from the paper (3 more)


Reference graph
Works this paper leans on
-
[1]
Abraham, R. G., & van Dokkum, P. G. 2014, PASP, 126, 55, doi: 10.1086/674875
doi:10.1086/674875 2014
-
[2]
C., Monachesi, A., Agnello, A., & White, S
Amorisco, N. C., Monachesi, A., Agnello, A., & White, S. D. M. 2018, MNRAS, 475, 4235, doi: 10.1093/mnras/sty116
-
[3]
Beasley, M. A., Romanowsky, A. J., Pota, V., et al. 2016, The Astrophysical Journal Letters, 819, L20, doi: 10.3847/2041-8205/819/2/L20
-
[4]
Blakeslee, J. P. 1997, ApJL, 481, L59, doi: 10.1086/310653
doi:10.1086/310653 1997
-
[5]
2020, ApJ, 904, 161, doi: 10.3847/1538-4357/abb242
Burkert, A. 2020, ApJ, 904, 161, doi: 10.3847/1538-4357/abb242
-
[6]
Burkert, A., & Forbes, D. A. 2020, AJ, 159, 56, doi: 10.3847/1538-3881/ab5b0e
-
[7]
Choi, J., Dotter, A., Conroy, C., et al. 2016, ApJ, 823, 102, doi: 10.3847/0004-637X/823/2/102 V alidation of an Almost Dark Galaxy13 Data Mock Injected Model 10 1 100 101 Radius [arcsec] 26 28 30 32Surface Brightness [mag/arcsec2] Mock (Model) Mock (Injected) Data (GC masked) Figure 6.Injection test on the Euclid data with a mock UDG. Purple dashed circl...
-
[8]
C., Bertin, E., Bolzonella, M., et al
Cuillandre, J. C., Bertin, E., Bolzonella, M., et al. 2024, Submitted to A&A. https://arxiv.org/abs/2405.13496
Show all 63 references
-
[9]
2019, The Astrophysical Journal, 875, 155, doi: 10.3847/1538-4357/ab14f3
Danieli, S., & van Dokkum, P. 2019, The Astrophysical Journal, 875, 155, doi: 10.3847/1538-4357/ab14f3
2019 doi
-
[10]
2020, ApJL, 895, L4, doi: 10.3847/2041-8213/ab8dc4
Danieli, S., van Dokkum, P., Abraham, R., et al. 2020, ApJL, 895, L4, doi: 10.3847/2041-8213/ab8dc4
2020 doi
-
[11]
2022, ApJL, 927, L28, doi: 10.3847/2041-8213/ac590a
Danieli, S., van Dokkum, P., Trujillo-Gomez, S., et al. 2022, ApJL, 927, L28, doi: 10.3847/2041-8213/ac590a
2022 doi
-
[12]
2016, DOLPHOT: Stellar photometry, Astrophysics Source Code Library, record ascl:1608.013
Dolphin, A. 2016, DOLPHOT: Stellar photometry, Astrophysics Source Code Library, record ascl:1608.013
2016
-
[13]
Dolphin, A. E. 2000, PASP, 112, 1383, doi: 10.1086/316630
2000 doi
-
[14]
2016, ApJSS, 222, 8, doi: 10.3847/0067-0049/222/1/8
Dotter, A. 2016, ApJSS, 222, 8, doi: 10.3847/0067-0049/222/1/8
2016 doi
-
[15]
E., Jones, M
Fielder, C. E., Jones, M. G., Sand, D. J., et al. 2023, The Astrophysical Journal Letters, 954, L39
2023
-
[16]
A., Alabi, A., Romanowsky, A
Forbes, D. A., Alabi, A., Romanowsky, A. J., Brodie, J. P., & Arimoto, N. 2020, MNRAS, 492, 487, doi: 10.1093/MNRAS/STAA180
2020 doi
-
[17]
A., Buzzo, M
Forbes, D. A., Buzzo, M. L., Ferre-Mateu, A., et al. 2024, MNRAS, 536, 1217, doi: 10.1093/mnras/stae2675
2024 doi
-
[18]
A., Dullo, B
Forbes, D. A., Dullo, B. T., Gannon, J., et al. 2020, MNRAS, 494, 5293, doi: 10.1093/mnras/staa1111
2020 doi
-
[19]
A., & Gannon, J
Forbes, D. A., & Gannon, J. 2024, Monthly Notices of the Royal Astronomical Society, 528, 608
2024
-
[20]
A., Gannon, J., Couch, W
Forbes, D. A., Gannon, J., Couch, W. J., et al. 2019, AAP, 626, A66, doi: 10.1051/0004-6361/201935499
2019 doi
-
[21]
A., Gannon, J., Couch, W
Forbes, D. A., Gannon, J., Couch, W. J., et al. 2019, Astronomy & Astrophysics, 626, A66
2019
-
[22]
A., Gannon, J
Forbes, D. A., Gannon, J. S., Romanowsky, A. J., et al. 2020, MNRAS, 500, 1279, doi: 10.1093/mnras/staa3289
2020 doi
-
[23]
S., Ferré-Mateu, A., Forbes, D
Gannon, J. S., Ferré-Mateu, A., Forbes, D. A., et al. 2024, MNRAS, 531, 1856, doi: 10.1093/mnras/stae1287
2024 doi
-
[24]
P., & Danieli, S
Greco, J. P., & Danieli, S. 2022, The Astrophysical Journal, 941, 26
2022
-
[25]
A., Gannon, J
Haacke, L., Forbes, D. A., Gannon, J. S., et al. 2025, MNRAS, 539, 674, doi: 10.1093/mnras/staf559
2025 doi
-
[26]
Harris, W. E. 2023, ApJ, 265, 9, doi: 10.3847/1538-4365/acab5c
2023 doi
-
[27]
E., Blakeslee, J
Harris, W. E., Blakeslee, J. P., & Harris, G. L. H. 2017, ApJ, 836, 67, doi: 10.3847/1538-4357/836/1/67
2017 doi
-
[28]
E., Harris, G
Harris, W. E., Harris, G. L. H., & Alessi, M. 2013, ApJ, 772, 82, doi: 10.1088/0004-637X/772/2/82
2013 doi
-
[29]
E., Brown, R
Harris, W. E., Brown, R. A., Durrell, P. R., et al. 2020, ApJ, 890, 105, doi: 10.3847/1538-4357/ab6992
2020 doi
-
[30]
2000, Phys
Hu, W., Barkana, R., & Gruzinov, A. 2000, Phys. Rev. Lett., 85, 1158, doi: 10.1103/PHYSREVLETT.85.1158
2000 doi
-
[31]
P., Tremaine, S., & Witten, E
Hui, L., Ostriker, J. P., Tremaine, S., & Witten, E. 2017, Phys. Rev. D, 95, 043541, doi: 10.1103/PHYSREVD.95.043541
2017 doi
-
[32]
Romanowsky, A. J. 2019, ApJ, 887, 92, doi: 10.3847/1538-4357/ab536c
2019 doi
-
[33]
R., Romanowsky, A
Janssens, S. R., Romanowsky, A. J., Abraham, R., et al. 2022, MNRAS, 517, 858871, doi: 10.1093/mnras/stac2717
2022 doi
-
[34]
R., Forbes, D
Janssens, S. R., Forbes, D. A., Romanowsky, A. J., et al. 2024, MNRAS, 534, 783, doi: 10.1093/mnras/stae2137 Jord´ an, A., McLaughlin, D. E., Cˆ ot´ e, P., et al. 2007, ApJS, 171, 101, doi: 10.1086/516840
2024 doi
-
[35]
C., & Evans, N
Kennicutt, R. C., & Evans, N. J. 2012, Annual Review of Astronomy and Astrophysics, 50, 531608, doi: 10.1146/annurev-astro-081811-125610
2012 doi
-
[36]
2001, MNRAS, 322, 231, doi: 10.1046/j.1365-8711.2001.04022.x
Kroupa, P. 2001, MNRAS, 322, 231, doi: 10.1046/j.1365-8711.2001.04022.x
2001
-
[37]
Larsen, S. S. 1999, A&AS, 139, 393, doi: 10.1051/aas:1999509 14Li et al
1999 doi
-
[38]
Abraham, R. G. 2025a, The Annals of Applied Statistics, 19, 261 , doi: 10.1214/24-AOAS1958
-
[39]
M., Brown, P
Li, D., Eadie, G. M., Brown, P. E., et al. 2025b, ApJ, 984, 147, doi: 10.3847/1538-4357/adc71f
-
[40]
D., Eadie, G
Li, D. D., Eadie, G. M., Abraham, R., et al. 2022, ApJ, 935, 3, doi: 10.3847/1538-4357/AC7B22
2022 doi
-
[41]
W., Cˆ ot´ e, P., et al
Lim, S., Peng, E. W., Cˆ ot´ e, P., et al. 2018, ApJ, 862, 82, doi: 10.3847/1538-4357/AACB81
2018 doi
-
[42]
W., et al
Lim, S., Cˆ ot´ e, P., Peng, E. W., et al. 2020, ApJ, 899, 69, doi: 10.3847/1538-4357/ABA433
2020 doi
-
[43]
R., Cuillandre, J
Marleau, F. R., Cuillandre, J. C., Cantiello, M., et al. 2024, Submitted to A&A. https://arxiv.org/abs/2405.13502
2024
-
[44]
2021, A&A, 654, A105, doi: 10.1051/0004-6361/202141432 Mart ´ ınez-Delgado, D., L¨ asker, R., Sharina, M., et al
Marleau, Francine R., Habas, Rebecca, Poulain, M´ elina, et al. 2021, A&A, 654, A105, doi: 10.1051/0004-6361/202141432 Mart ´ ınez-Delgado, D., L¨ asker, R., Sharina, M., et al. 2016, AJ, 151, 96, doi: 10.3847/0004-6256/151/4/96
2021 doi
-
[45]
C., Durrell, P
Mihos, J. C., Durrell, P. R., Ferrarese, L., et al. 2015, ApJL, 809, L21, doi: 10.1088/2041-8205/809/2/L21
2015 doi
- [46]
-
[47]
2018, PASJ, 70, S1, doi: 10.1093/pasj/psx063
Miyazaki, S., Komiyama, Y., Kawanomoto, S., et al. 2018, PASJ, 70, S1, doi: 10.1093/pasj/psx063
2018 doi
-
[48]
L., Stetson, P
Monelli, M., Hidalgo, S. L., Stetson, P. B., et al. 2010, ApJ, 720, 1225, doi: 10.1088/0004-637X/720/2/1225
2010 doi
-
[49]
R., Marleau, F
Mueller, O., Durrell, P. R., Marleau, F. R., et al. 2021, The Astrophysical Journal, 923, 9 M¨ uller, Oliver, Fahrion, Katja, Rejkuba, Marina, et al. 2021, A&A, 645, A92, doi: 10.1051/0004-6361/202039359
2021 doi
-
[50]
Okamoto, S., Arimoto, N., Ferguson, A. M. N., et al. 2019, ApJ, 884, 128, doi: 10.3847/1538-4357/ab44a7
2019 doi
- [51]
-
[52]
W., Jord´ an, A., Cˆ ot´ e, P., et al
Peng, E. W., Jord´ an, A., Cˆ ot´ e, P., et al. 2008, ApJ, 681, 197, doi: 10.1086/587951 Rom´ an, J., Beasley, M. A., Ruiz-Lara, T., & Valls-Gabaud, D. 2019, MNRAS, 486, 823, doi: 10.1093/mnras/stz835 Rom´ an, Javier, Castilla, Aida, & Pascual-Granado, Javier. 2021, A&A, 656, ...
2008 doi
-
[53]
2024, A&A
Saifollahi, T., Voggel, K., Lanon, A., et al. 2024, A&A. https://arxiv.org/abs/2405.13500
2024
-
[54]
2021, ApJ, 909, 179, doi: 10.3847/1538-4357/abdd29
Shen, Z., van Dokkum, P., & Danieli, S. 2021, ApJ, 909, 179, doi: 10.3847/1538-4357/abdd29
2021 doi
-
[55]
Stetson, P. B. 1987, PASP, 99, 191, doi: 10.1086/131977
1987 doi
- [56]
-
[57]
V., Lim, S., et al
Toloba, E., Sales, L. V., Lim, S., et al. 2023, ApJ, 951, 77, doi: 10.3847/1538-4357/acd336
2023 doi
-
[58]
2021, MNRAS, 506, 4841, doi: 10.1093/mnras/stab1895 van Dokkum, P., Li, D
Reina-Campos, M. 2021, MNRAS, 506, 4841, doi: 10.1093/mnras/stab1895 van Dokkum, P., Li, D. D., Abraham, R., et al. 2024, Research Notes of the AAS, 8, 135, doi: 10.3847/2515-5172/ad4be6 van Dokkum, P., Abraham, R., Brodie, J., et al. 2016, ApJL, 828, L6, doi: 10.3847/2041-820...
2021 doi
-
[59]
W., et al
Villegas, D., Jord´ an, A., Peng, E. W., et al. 2010, ApJ, 717, 603, doi: 10.1088/0004-637x/717/2/603
2010 doi
-
[60]
G., & Pe˜ narrubia, J
Walker, M. G., & Pe˜ narrubia, J. 2011, ApJ, 742, 20, doi: 10.1088/0004-637X/742/1/20
2011 doi
-
[61]
J., et al
Wasserman, A., van Dokkum, P., Romanowsky, A. J., et al. 2019, ApJ, 885, 155, doi: 10.3847/1538-4357/ab3eb9
2019 doi
-
[62]
A., et al
Wittmann, C., Lisker, T., Tilahun, L. A., et al. 2017, MNRAS, 470, 1512, doi: 10.1093/mnras/stx1229
2017 doi
-
[63]
2016, ApJS, 225, 11, doi: 10.3847/0067-0049/225/1/11
Yagi, M., Koda, J., Komiyama, Y., & Yamanoi, H. 2016, ApJS, 225, 11, doi: 10.3847/0067-0049/225/1/11
2016 doi
Reviewed August 6, 2026 · model on record in the stance chip above.
Discussion (0). Sign in to comment.