REVIEW 4 major objections 5 minor 51 references
Detailed analysis of multi-line molecular distributions in the Seyfert galaxy NGC 1068: Possible effect of the AGN outflow to the starburst ring
T0 review · 4 major / 5 minor · reviewed 2026-08-06 · deepseek-v4-flash
Pith's one-line read A low-variance component of 13 molecular-line maps aligns with the AGN outflow and with broad line widths, suggesting the outflow reaches the starburst ring at 1–2 kpc.
desk verdict Solid PCA application with an honest but unproven outflow-ring claim; deserves review with a mandatory permutation test. read the letter →
The pith
A machine-rendered reading of the paper's core claim, the machinery that carries it, and where it could break.
The reading
What carries the argument
The central object is the PC3SB score map: the third principal component computed from 13 standardized integrated-intensity maps of molecular lines on a hexagonal cloud-scale grid covering the starburst ring, an annulus from 750 pc to 2 kpc. Standardization, subtracting each line's mean and dividing by its standard deviation, equalizes the variance across lines so that bright CO emission cannot dominate the decomposition. PCA projects each spatial grid point into a low-dimensional space whose axes are linear combinations of the line intensities, and the load-bearing diagnostic is the anticorrelation between negative PC3SB scores and the velocity dispersions of the negatively loaded lines; that correlation turns a spatial coincidence into a dynamical argument for outflow-driven broadening.
What would settle it
A decisive test would be to measure the kinematics of the southwestern ring at high resolution: if the broad CN, C2H, HCN, and CO line widths in the negative-PC3SB regions are not spatially tied to the outflow cone and do not show outflow-like acceleration along the cone axis, then the feature is more likely tracing bar-end star formation or cloud-cloud collisions than AGN outflow impact. Re-running the PCA with min-max normalization, line-ratio inputs, or no scaling would also settle whether the outflow-aligned pattern is intrinsic or a byproduct of the standardization choice.
Extended reading notes
Core claim
The central claim is that PC3SB, the third principal component of the starburst-ring maps, which retains about 2% of the variance, isolates a spatial pattern best explained by the AGN outflow interacting with molecular gas in the ring. The negative PC3SB scores fall along the known outflow direction; the lines dominating the negative coefficients are CN, C2H, and HCN, with HCO+ and CS also contributing, exactly the species expected to be enhanced or heated by an outflow; and the velocity dispersions of the negatively loaded lines anticorrelate with the negative scores, with most correlation coefficients more negative than -0.5 and C18O the exception. The paper is careful that this component may contain several physical signals and that it overlaps the bar-end, but it concludes that one coherent interpretation is outflow compression of the ring gas. It also claims that PC1 approximates the H2 column density, that PC2OA separates the circumnuclear disk from the starburst ring, and that PC2SB separates starburst-dominated from shock-dominated gas.
Load-bearing premise
The load-bearing premise is that standardizing each line map by variance is the physically appropriate scaling; when the maps are instead rescaled to a fixed 0–1 range, the southwest–northeast contrast in PC3SB weakens and the analogous component in the overall region becomes dominated by the bar-end rather than the outflow.
Editorial extensions
If this is right
- AGN outflows can influence molecular gas at radii of 1 to 2 kpc, extending the known scale of such interactions beyond the central kiloparsec.
- Principal components that retain only about 2% of the variance can still carry a physically interpretable signal, so truncating at PC1 or PC2 would discard the outflow signature.
- Multi-line PCA can separate overlapping components of column density, chemical state, and feedback in galaxies with both an AGN and a starburst ring.
- The anticorrelation between a low-variance PC score and line velocity dispersion offers a transferable kinematic test for outflow-cloud interactions in other galaxies.
Reading between the lines
- Beyond the paper, the prominence of the outflow-aligned feature under standardization suggests it may partly encode dynamic-range differences between bright CO and faint dense-gas tracers; re-running the analysis on line ratios or with explicit intensity scaling would separate that effect from an intrinsic ISM structure.
- A natural prediction is that other nearby Seyfert galaxies with millimeter-wave line maps will show low-variance components aligned with their radio or X-ray outflow axes, loaded on CN, C2H, and HCN, and correlated with broad line widths.
- If the interaction is real, the southwestern ring should show independent corroborating signs, such as enhanced dust temperature, SiO or HNCO shock emission, or elevated CN/CO and C2H/CO ratios, which existing or future observations could test.
Editorial analysis
A structured set of objections, weighed in public.
Referee Report
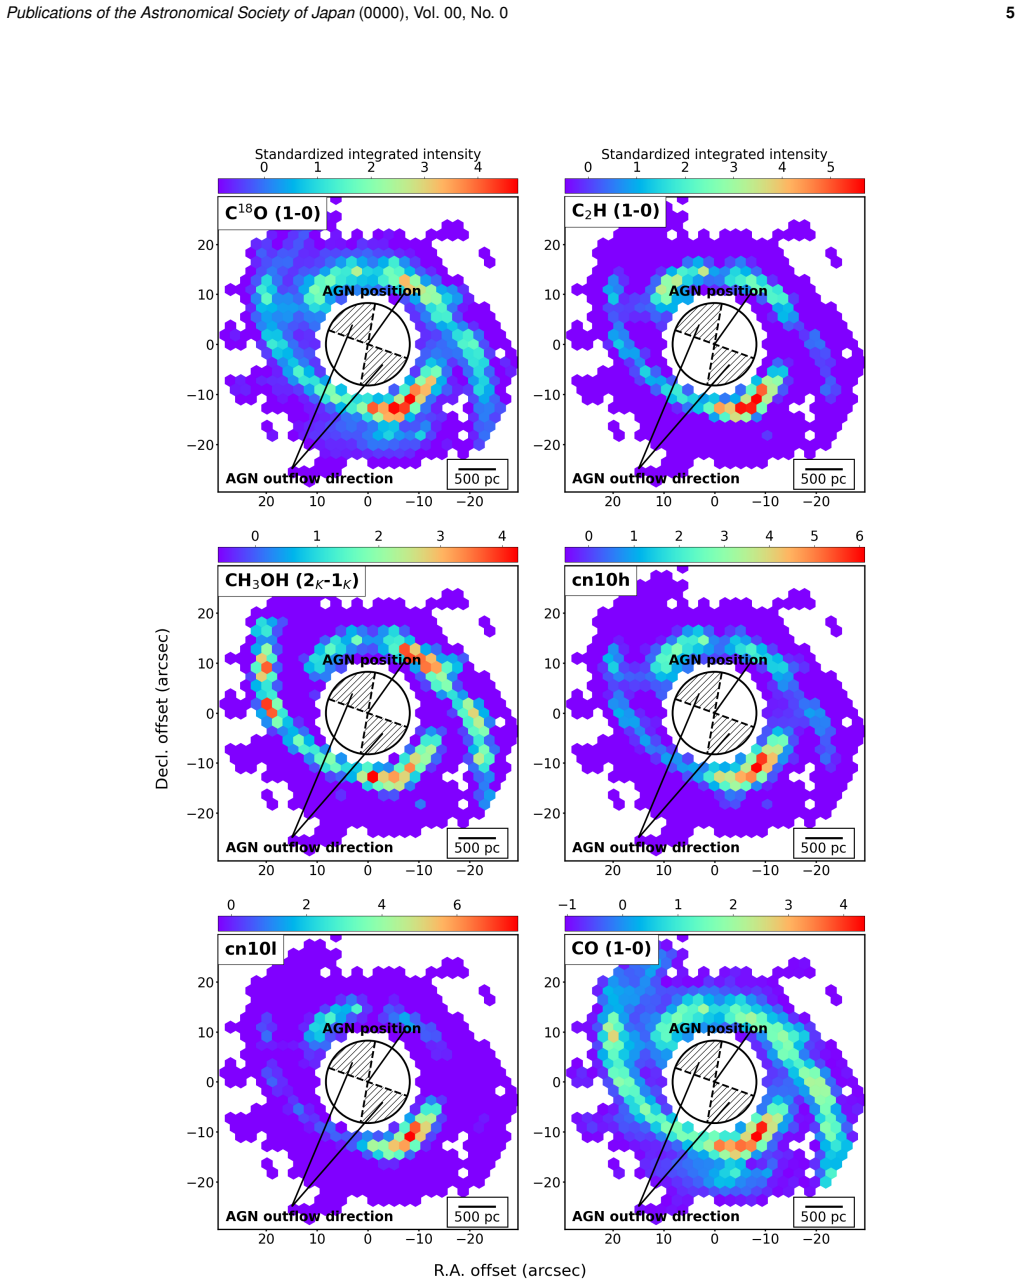
Summary. This paper applies principal component analysis (PCA) to ALMA Band 3 integrated intensity maps of 13 molecular lines toward the Seyfert galaxy NGC 1068, separately for an overall central region within about 2 kpc and for the starburst ring between 750 pc and 2 kpc. The authors standardize each line map to zero mean and unit variance, use the scikit-learn PCA implementation, and assign coefficient errors by Monte Carlo perturbation of the noise. They interpret PC1 as an approximate H2 column density tracer, PC2 as a density/chemical contrast between the circumnuclear disk and the starburst ring, and, as the central claim, PC3SB negative scores as a possible signature of interaction between the AGN outflow and gas in the starburst ring. This interpretation is supported by the spatial coincidence of negative scores with the AGN outflow direction, by the loading of CN, C2H, HCN, HCO+, CS, and CO isotopologues on those scores, and by an anti-correlation between negative scores and the velocity dispersions of several lines (Table 5). An appendix repeats the analysis with min-max normalization and reports notable differences in the PC3OA and PC3SB maps.
Significance. If the central claim holds, it would extend the influence of the AGN outflow in NGC 1068 from the central kiloparsec to the starburst ring at about 1–2 kpc, and it would demonstrate that low-variance PCA components of multi-line maps can reveal physically meaningful structure in a galaxy hosting both an AGN and a starburst ring. The paper has clear strengths: the data processing is described in detail, the analysis uses a uniform PHANGS-ALMA pipeline with a common grid and mask, the Monte Carlo error bars on the PCA coefficients are a useful addition, and the PC2OA interpretation is checked against lines not used in the PCA (Table 4). The velocity-dispersion test in Table 5 is a genuine external check. However, the central claim currently rests on a component that explains only about 2% of the variance, whose spatial pattern is sensitive to the scaling choice, and for which no null model or quantitative alignment test is provided.
major comments (4)
- [Appendix, Figs. 13(d), 14] The robustness of the central claim to the choice of scaling is not established. The appendix states that with min-max normalization the PC3SB negative-score contrast between the southwestern and northeastern parts of the ring becomes less pronounced, and that the PC3OA negative scores primarily extract the bar-end rather than the AGN outflow (Figs. 13d and 14). This is load-bearing because standardization is an arbitrary preprocessing choice; the outflow-aligned PC3SB feature may reflect the scaling rather than an intrinsic ISM structure. Please quantify the southwest–northeast contrast under both scalings and under additional choices (for example, median/RMS normalization), give a physical justification for the chosen scaling, or substantially temper the central claim.
- [Sec. 2.3, Fig. 9(a)] No null model is presented for PC3SB. The Monte Carlo analysis in Sec. 2.3 perturbs each pixel by its noise and shows that the coefficient signs are stable against random noise, but it does not test whether a principal component with only about 2% of the variance and with a spatially coherent pattern would arise from 13 independent maps with the same spatial autocorrelation. The SB ring region contains only 482 hexagons smoothed to 150 pc (Sec. 2.1), so the effective number of independent samples is much smaller than 482. Please add a permutation or surrogate test that destroys the spatial correspondence between the line maps while preserving each map’s autocorrelation, and report the null distributions of the PC3 variance fraction, the overlap of negative scores with the outflow cone, and the Table 5 correlations.
- [Sec. 4.2.3, Fig. 9(d)] The spatial alignment of the negative scores with the AGN outflow is assessed only visually. Because this alignment is the primary spatial evidence for the interaction claim, a quantitative statistic is needed: for example, the fraction of negative-score pixels inside the outflow cone compared with a random control, or a two-dimensional cross-correlation with an outflow mask. The acknowledged overlap with the bar-end region should also be separated or explicitly modeled, since the bar-end is a plausible alternative origin for the negative scores.
- [Table 5, Sec. 4.2.3] The anti-correlation between PC3SB negative scores and line velocity dispersions is reported without uncertainties and without correction for spatial autocorrelation. With correlation coefficients between about –0.26 and –0.65 across nine lines, and with multiple comparisons, these values are not sufficient to establish the claimed effect by themselves. Please provide bootstrap or jackknife confidence intervals, account for the effective number of independent spatial samples, and report the correlation over all ring pixels rather than only over the negative-score-selected pixels, to avoid selection effects.
minor comments (5)
- [Figure captions 2, 4, 5] The captions contain the typo “usd” for “used”; please correct this.
- [Table 4 heading] The word “Talbe” in the table heading should be “Table”.
- [Table 5 header] The column header for Table 5 is garbled: the labels for the two CN hyperfine components and for C2H are not cleanly aligned with the data columns, so the reader cannot tell which transition corresponds to which coefficient. Please reformat the table.
- [Sec. 4.2.3] The text refers to “C2H (N=11/2-01/2)”, but Table 5 lists simply “C2H”; please use consistent notation for all lines.
- [Abstract and Sec. 4.2.2] The phrase “have a possibility to reconstruct” is awkward and should be rewritten as “may reconstruct”; also, “collisions between molecular molecular clouds” in Sec. 4.2.2 repeats “molecular”.
Circularity Check
No significant circularity: PC3SB interpretation is a descriptive PCA result cross-checked against external tracer calibrations and independent velocity-dispersion data.
full rationale
The paper is descriptive rather than derivational: it applies PCA to 13 standardized integrated-intensity maps (Section 2.2) and interprets the resulting score maps using tracer assignments cited from prior literature. The central PC3SB claim—that the negative-score pattern is consistent with AGN outflow interaction—is not forced by construction. The negative scores are a linear combination of the input intensities, while the supporting velocity-dispersion anti-correlation in Section 4.2.3 and Table 5 uses measurements not entering the PCA, so the check is external to the derived component. The AGN outflow geometry is anchored to independent references (Das et al. 2006; Mingozzi et al. 2019). The self-citation to Saito et al. (2022b), which shares co-authors, is used as a prior chemical calibration for CN/C2H enhancement by UV/AGN outflow, but the same association is also supported by García-Burillo et al. (2017), and it is not the sole evidence for the interaction claim. The scaling sensitivity shown in the Appendix weakens the robustness of low-variance PCs, but that is a statistical concern, not a circularity in the derivation. No fitted parameter is renamed as a prediction, and no quantity is defined in terms of the conclusion it is used to support.
Assumptions & free parameters
free parameters (4)
- S/N threshold for CO mask =
4
- Minimum detected grid count =
60
- Integration velocity range =
+/-300 km/s
- Spatial grid scale =
150 pc
assumptions (4)
- domain assumption PCA assumes linear relationships and independent samples; each hexagon is treated as one molecular cloud with no spatial correlation.
- domain assumption Standardization (zero mean, unit variance per line) is the appropriate scaling for comparing lines.
- domain assumption Velocity dispersion broadening of molecular lines indicates interaction or shock rather than rotation, optical depth, or hyperfine structure.
- domain assumption Literature tracer assignments, including CN and C2H enhancement by AGN outflow and CH3OH as a shock tracer, are correct.
Cite this review
Pith. "Pith review of Detailed analysis of multi-line molecular distributions in the Seyfert galaxy NGC 1068: Possible effect of the AGN outflow to the starburst ring." pith.science (2026). https://pith.science/paper/4NZ5KDLP
@misc{pith2026250615999,
  author       = {Pith},
  title        = {Pith review of: Detailed analysis of multi-line molecular distributions in the Seyfert galaxy NGC 1068: Possible effect of the AGN outflow to the starburst ring},
  year         = {2026},
  howpublished = {\url{https://pith.science/paper/4NZ5KDLP}},
  note         = {Machine review of arXiv:2506.15999}
}
abstract
We apply principal component analysis (PCA) to the integrated intensity maps of 13 molecular lines of the nearby type-2 Seyfert galaxy NGC 1068 obtained by Atacama Large Millimeter/sub-millimeter Array (ALMA) to objectively visualize the features of its center, (1) within a radius of about 2 kpc ($\sim$ 27".5; hereafter the "overall region") and (2) the ring shaped starburst region between 750 pc ($\sim$ 10") and 2 kpc ($\sim$ 27".5) of the galaxy (hereafter the "SB ring region"). PCA is a powerful unsupervised machine learning technique that extracts key information through dimensionality reduction. The PCA results for the overall region have a possibility to reconstruct a map representing the approximate H$_2$ column density and difference of volume density and/or chemical composition between the circumnuclear disk (CND) and the starburst ring (SB ring). Additionally, the PCA results for the SB ring region have a possibility to reconstruct a map representing the approximate H$_2$ column density and distinction between starburst dominated region and shock dominated region. Furthermore, the PCA results for the SB ring region indicate a possible interaction between the Active Galactic Nucleus (AGN) outflow and gas in the SB ring. Although further investigation is required, we suggest that the AGN outflow interacts with gas in the SB ring, as this feature is consistent with the direction of the AGN outflow and is contributed by CN, C$_2$H and HCN, which are known to be enhanced by the AGN outflow. These results demonstrate that PCA can effectively extract features even for galaxies with complex structures, such as AGN + SB ring. This study also implies that PCA has the potential to uncover previously unrecognized phenomena by visualizing latent structures in multi-line data.
Figures


Figures from the paper (11 more)


Reference graph
Works this paper leans on
-
[1]
and Neri, R., 2012, A & A, 537A, 44
Henkel, C., Costagliola, F. and Neri, R., 2012, A & A, 537A, 44
work page 2012
-
[2]
Aladro, R., et al., 2013, A & A, 549, 39
work page 2013
-
[3]
Aladro, R., et al., 2015, A & A, 579, 101 Astropy Collaboration, Robitaille, T. P., Tollerud, E. J., et al. 2013, A&A, 558, A33 Astropy Collaboration, Price-Whelan, A. M., Sip ˝ocz, B. M., et al. 2018, AJ, 156, 123
work page 2015
-
[4]
Boger, G. I. and Sternberg, A., 2005, ApJ, 632, 1
work page 2005
-
[5]
Das, V ., Crenshaw, D. M., Kraemer, S. B., & Deo, R. P. 2006, AJ, 132, 620
work page 2006
- [6]
-
[7]
P., Schlemmer, S., Schilke, P., Stutzki, J., & Müller, H
Endres, C. P., Schlemmer, S., Schilke, P., Stutzki, J., & Müller, H. S. 2016, JMoSp, 327, 95
work page 2016
-
[8]
Flower, D. R., & Pineau des Forêts, G. 2012, MNRAS, 421, 2786
work page 2012
Show all 51 references
-
[9]
and Bachiller, R., 1993, A & A, 276, 473
Fuente, A., Martin-Pintado, J., Cernicharo, J. and Bachiller, R., 1993, A & A, 276, 473
1993
-
[10]
2014, A &A, 567, A125 García-Burillo, S., et al., 2017, A & A, 608, 56
Garay, G., Lizano, S., 1999, PASP, 111, 1049 García-Burillo, S., et al., 2010, A & A, 519, A2 García-Burillo, S., Combes, F., Usero, A., et al. 2014, A &A, 567, A125 García-Burillo, S., et al., 2017, A & A, 608, 56
1999
-
[11]
Ginard, D., et al., 2015, A & A, 578, 49
2015
-
[12]
2019, radio- astro-tools/spectralcube: Release v0.4.5, v0.4, Zenodo, doi: 10.5281/zenodo.35586145
Ginsburg, A., Koch, E., Robitaille, T., et al. 2019, radio- astro-tools/spectralcube: Release v0.4.5, v0.4, Zenodo, doi: 10.5281/zenodo.35586145
2019 doi
-
[13]
and Hirota, A., 2019, ApJ, 884, 2
Harada, N., Sakamoto, K., Martín, S., Watanabe, Y ., Aladro, R. and Hirota, A., 2019, ApJ, 884, 2
2019
-
[14]
Harada, N., et al., 2024, ApJ, 271, 38
2024
-
[15]
and Wakelam, V ., 2010, ApJ, 721, 1570
Harada, N., Herbst, E. and Wakelam, V ., 2010, ApJ, 721, 1570
2010
-
[16]
and Herbst, E., 2013, ApJ, 765, 108
Harada, N., Thompson, T, A. and Herbst, E., 2013, ApJ, 765, 108
2013
-
[17]
R., Millman, K
Harris, C. R., Millman, K. J., van der Walt, S. J., et al. 2020, Natur, 585, 357
2020
-
[18]
Y ., et al., 2023, A & A, 675, 151
Huang, K. Y ., et al., 2023, A & A, 675, 151
2023
-
[19]
Y ., Viti, S., 2023, Faraday Discussions, 245, 181
Huang, K. Y ., Viti, S., 2023, Faraday Discussions, 245, 181
2023
-
[20]
2009, AJ, 137, 3581
Imanishi, M., Nakanishi, K., Tamura, Y ., & Peng, C.-H. 2009, AJ, 137, 3581
2009
-
[21]
2013, Publications of the Astronomical Society of Japan, 65, 100
Izumi, T., et al. 2013, Publications of the Astronomical Society of Japan, 65, 100
2013
-
[22]
Menten, Karl M., 2017, A & A, 605L, 5
2017
-
[23]
and Dalgarno, A., 1996, A & A, 306, 21 Martín, S., et al., 2021, A & A, 656, 46
Lepp, S. and Dalgarno, A., 1996, A & A, 306, 21 Martín, S., et al., 2021, A & A, 656, 46
1996
-
[24]
S., and Turner, J
Meier, D. S., and Turner, J. L., 2005, ApJ, 618, 259
2005
-
[25]
and Spaans, M., 2005, A & A, 436, 397
Meijerink, R. and Spaans, M., 2005, A & A, 436, 397
2005
-
[26]
Mingozzi, M., Cresci, G., Venturi, G., et al., 2019, A & A, 622, A146
2019
-
[27]
P., Waters, B., Schiebel, D., Young, W., & Golap, K
McMullin, J. P., Waters, B., Schiebel, D., Young, W., & Golap, K. 2007, in ASP Conf. Ser. 376, Astronomical Data Analysis Software and Systems XVI, ed. R. A. Shaw, F. Hill, & D. J. Bell (San Francisco, CA: ASP),127
2007
-
[28]
Nakajima, Y ., et al., 2024, ApJ, 974, 243
2024
-
[29]
Nakajima, T., et al., 2015, PASJ, 67, 8
2015
-
[30]
and Herbst, E., 2018, PASJ, 70, 7
Nakajima, T., Takano, S., Kohno, K., Harada, N. and Herbst, E., 2018, PASJ, 70, 7
2018
-
[31]
Nakajima, T., et al., 2023, ApJ, 955, 1
2023
-
[32]
Okoda, Y ., Oya, Y ., Abe, S., Komaki, A., Watanabe, Y ., and Yamamoto, S., 2021, 923, 168
2021
-
[33]
1901, The London, Edinburgh, and Dublin Philosophical Magazine and Journal of Science, 2, 559
Pearson, K. 1901, The London, Edinburgh, and Dublin Philosophical Magazine and Journal of Science, 2, 559
1901
-
[34]
2011, JMLR, 12, 2825
Pedregosa, F., Varoquaux, G., Gramfort, A., et al. 2011, JMLR, 12, 2825
2011
-
[35]
J., Tafalla, M., Gueth, F., Bachiller, R
Rico-Villas, F., et al., 2021, MNRAS, 502, 3021 Rodríguez-Fernández, N. J., Tafalla, M., Gueth, F., Bachiller, R. 2010, A & A, 516, 98
2021
-
[36]
L., Colbert, E
Roy, A. L., Colbert, E. J. M., Wilson, A. S., & Ulvestad, J. S., 1998, ApJ, 504, 147
1998
-
[37]
2017, ApJ, 834, 6
Saito, T., et al. 2017, ApJ, 834, 6
2017
-
[38]
2022, ApJL, 927, L32
Saito, T., et al. 2022, ApJL, 927, L32
2022
-
[39]
Saito, T., et al., 2022, ApJ, 935, 2
2022
-
[40]
S., Wiedner, M
Sakamoto, K., Aalto, S., Evans, A. S., Wiedner, M. C., and Wilner, D. J. 2010, ApJ, 725, L228 Sánchez-García, M., 2022, A & A, 660, 83
2010
-
[41]
Scourfield, M., et al., 2020, MNRAS, 496, 4
2020
-
[42]
Z., Matthews, K., Carico, D
Scoville, N. Z., Matthews, K., Carico, D. P. and Sanders, D. B., 1988, ApJ, 327, 61
1988
-
[43]
Takano, S., et al., 2014, PASJ, 66, 4
2014
-
[44]
2018, ApJS, 236, 40
Tanaka, K., Nagai, M., Kamegai, K., Iino, T., and Sakai, T. 2018, ApJS, 236, 40
2018
-
[45]
Tanaka, K., et al., 2024, ApJ, 961, 18
2024
-
[46]
Tosaki, T., et al., 2017, PASJ, 69, 18
2017
-
[47]
Tsai, M., Hwang, C., Matsushita, S., Baker, A. J. and Espada, D., 2012, ApJ, 746, 129
2012
-
[48]
2020, NatMe, 17, 261
Virtanen, P., Gommers, R., Oliphant, T., et al. 2020, NatMe, 17, 261
2020
-
[49]
Wang, J., Zhang, Zhi-Yu, Qiu, J., Shi, Y ., Zhang, Jiangshui and Fang, M., 2014, ApJ, 796, 57
2014
-
[50]
and Kouchi, A., 2003, ApJ, 588, 121
Watanabe, N., Shiraki, T. and Kouchi, A., 2003, ApJ, 588, 121
2003
-
[51]
Xie, J., et al., 2023, ApJ, 949, 89
2023
Reviewed August 6, 2026 · model on record in the stance chip above.
Discussion (0). Continue with ORCID to comment.