REVIEW 3 major objections 5 minor 62 references
Evidence for a steeper SMBH-Bulge mass relationship extended to low masses using TDE host galaxies
T0 review · 3 major / 5 minor · reviewed 2026-08-06 · deepseek-v4-flash
Pith's one-line read The paper claims that the supermassive black hole–bulge mass relation, extended to 10^5–10^8 solar masses with 40 TDE hosts, is steeper than high-mass calibrations, with slope 1.34 ± 0.03 versus 1.16 and 1.05.
desk verdict New TDE plateau masses give a real low-mass correlation, but the central claim that the steepening is intrinsic is not secure because the forward model omits TDE rate weighting. read the letter →
The pith
A machine-rendered reading of the paper's core claim, the machinery that carries it, and where it could break.
The reading
What carries the argument
The argument rests on three mechanisms: (1) the late-time UV/optical plateau of a TDE, whose luminosity scales as $L_{\rm plat}\propto M_{\rm BH}^{2/3}$ and is used to derive each black hole mass; (2) Prospector spectral energy distribution fits with a non-parametric star formation history, converted to bulge masses through PSF/Kron bulge-to-total ratios; and (3) a forward model that draws host galaxies from a Schechter mass function, applies the Hills mass limit and a 19.5-mag survey cut, and simulates the observed TDE population under different assumed scaling relations. The forward model is the part that separates selection effects from intrinsic slope.
What would settle it
Obtain stellar-kinematic or gas-dynamical black hole masses for the TDE host galaxies and refit the TDE+KH13 relation; if the slope falls back to roughly 1.16, the plateau mass model was the source of the steepening.
Extended reading notes
Core claim
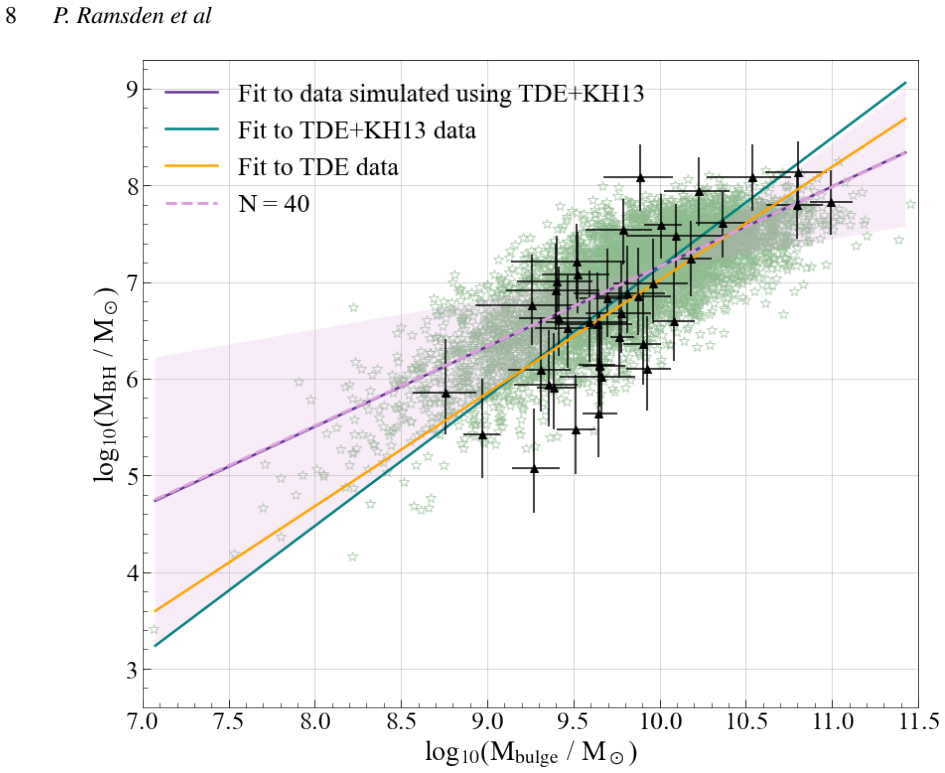
The central discovery claimed is that tidal disruption events can anchor the low-mass end of the supermassive black hole–bulge mass relation, and that when they are combined with high-mass samples the single power-law slope steepens to 1.34 ± 0.03, compared with 1.16 ± 0.08 (Kormendy & Ho 2013) and 1.05 ± 0.11 (McConnell & Ma 2013). The TDE-only relation is shallower, 1.17 ± 0.10, but forward modelling shows this flattening is fully consistent with the combination of the Hills mass limit and Malmquist bias; those same selection effects cannot reproduce the observed steepening of the combined relation. The paper therefore concludes that, if a single power law describes the whole $10^{5}$–$10^{10}$ solar mass range, it must be steeper than previous high-mass calibrations, with the caveat that the evidence is at the 2-$\sigma$ level.
Load-bearing premise
The load-bearing premise is that all 40 black hole masses from the late-time plateau model are unbiased at $10^{5}$–$10^{8}$ solar masses, with no hidden dependence on host galaxy properties; if plateau luminosity also depends on the host, both the flattening and steepening could be artifacts.
Editorial extensions
If this is right
- A single power-law extrapolated from high-mass calibrations under-predicts black hole masses in the 10^5–10^8 solar mass range if the combined slope of 1.34 is correct.
- The observed flattening of the TDE-only sample is a selection artifact, so deeper or corrected TDE samples can still be used to measure the low-mass slope.
- With an LSST-like survey limit of 23.5 mag, the forward model predicts the recovered TDE slope rises from 0.83 to 1.07, much closer to the input relation.
- A larger TDE sample can distinguish a single steeper power law from a power-law break at low mass, which would point to different black hole growth channels.
Reading between the lines
- A decisive test this paper does not run is to replace plateau masses with dynamical masses for a subset of TDE hosts; if the combined slope drops back near 1.16, the plateau calibration was imposing the steepening.
- If the steepening is real, low-mass black holes are under-massive relative to their bulges compared with the high-mass relation, which would favour seeding and growth histories that lag behind bulge assembly.
- The forward-modelling machinery could be inverted: instead of assuming a relation and predicting the observed sample, future LSST data could be fit directly with selection effects marginalised out, yielding a bias-corrected slope.
Editorial analysis
A structured set of objections, weighed in public.
Referee Report
Summary. The paper derives bulge masses for 40 TDE host galaxies using Prospector SED fits and pairs them with black hole masses from the late-time plateau emission model of Mummery et al. (2024). The TDE-only sample shows a significant correlation (Spearman 0.65, p<0.001) with power-law slope 1.17±0.10; combining with 67 galaxies from Kormendy & Ho (2013) gives slope 1.34±0.03, which is steeper than the KH13 and McConnell & Ma (2013) calibrations at about the 2σ level. The authors build a forward model including Hills-mass and Malmquist selection effects and find that these can reproduce the flattening of the TDE-only relation but cannot reproduce the steepening. They conclude that, if a single power law describes the relation, it must be steeper when extended to low masses, while explicitly acknowledging that the evidence is marginal.
Significance. If substantiated, this would be an important extension of the SMBH-bulge relation to the 1e5–1e8 Msun regime, with implications for black hole seeding and growth. The paper's strengths include careful SED fitting with non-parametric star formation histories, explicit robustness checks (Appendix A with Prospector-refitted KH13 total masses; the +0.1 dex B/T offset test), bootstrapping with perturbation, and an honest discussion of the 2σ significance and the need for larger samples. The forward model is a useful framework and gives falsifiable predictions for LSST. However, the central claim depends on the completeness of the selection model and on the calibration of the plateau-derived BH masses, and both of these need further support before the steepening can be considered established.
major comments (3)
- [Section 4.1, Eqs. (4)–(8)] The forward model omits any TDE rate weighting. It samples host galaxies from the Schechter function, draws BH masses from an input relation, and then applies only the Hills-mass cut and a single 19.5 mag peak-luminosity cut. This implicitly assumes every galaxy with M_BH below the Hills mass has the same probability of producing a detected TDE. The theoretical TDE rate depends on M_BH and on nuclear stellar density through loss-cone refilling (e.g., Stone & Metzger 2016); a rate that increases toward lower M_BH would preferentially populate the observed sample at low M_BH for fixed M_bulge, producing the offset seen in Fig. 3 and the steeper combined slope without any change to the true relation. Because the conclusion in Section 4.2 that the steepening cannot be accounted for is based on this model, the central claim is not yet secure. I ask for a sensitivity test that includes a rate-weighting term (e.g., rate ∝ M_BH^{-γ} or a density-dependent prescription) and a discussion of how the heterogeneous survey depths behind the single 19.5 mag cut affect the result.
- [Section 3 and Table 1] All 40 BH masses are taken from Mummery et al. (2024), whose plateau model assumes L_plat ∝ M_BH^(2/3). The manuscript does not validate these masses against independent estimates (e.g., dynamical or reverberation masses) for any TDE host. If the plateau luminosity also depends on host properties—through the fallback rate, disk alignment, or contaminating host light—then the derived M_BH values could inherit a correlation with M_bulge, producing both the flattening and the steepening. This is load-bearing because every downstream fit uses these masses. I request a calibration check on a subset, or at least a demonstration that the plateau masses are consistent with independent scaling relations using the Greene et al. (2020) sample already discussed in Appendix A.
- [Section 3.2 and Table 3] The claimed steepening compares Eq. (3) with the KH13 and MM13 relations, but the two samples use different bulge-mass estimation methods: TDE bulges come from PSF/Kron decomposition of Prospector stellar masses, while the KH13 bulge masses are taken from published decompositions. The +0.1 dex B/T offset test in Section 2.3 is narrower than a full cross-calibration, and although the Appendix A total-mass test is reassuring, it does not directly address possible systematic offsets in the bulge-mass scale between the two samples. Please either re-derive bulge masses for the KH13 galaxies with the same pipeline, or quantify how large a bulge-mass offset would be needed to reconcile Eq. (3) with the KH13 and MM13 slopes. Without such a check, a modest methodological offset could masquerade as a steepening.
minor comments (5)
- [Appendix A, Eqs. (A1)–(A2)] These equations are labeled as bulge-mass relations in the text but are fits to total stellar mass; please replace the M_bulge notation with M_star to avoid confusion.
- [Table A1 note] The normalization relation appears to have its mass variables swapped: the printed form (M_BH/10^11 Msun) = α (M_bulge/10^9 Msun)^β is dimensionally inconsistent; it should presumably be (M_BH/10^9 Msun) = α (M_star/10^11 Msun)^β.
- [Section 4.2, Eq. (9)] The uncertainty on the simulated slope in Eq. (9) is not quoted, so the claimed agreement 'to within ~3σ' cannot be evaluated; please provide the scatter or confidence interval from the 10,000 realizations.
- [Section 2.3] The sentence 'If any unphysical (B/T)g ratio are derived' has a subject-verb agreement error; it should read 'If any unphysical (B/T)g ratios are derived'.
- [References] The Häring & Rix reference is dated 2014 in the bibliography but should be 2004, and the Kroupa IMF used in Eq. (5) needs a citation to the original work (e.g., Kroupa 2001).
Circularity Check
Central steepening claim is not definitionally circular, but the forward model contains a self-referential validation loop when it feeds the TDE+KH13 fit back into the simulation and then 'recovers' the same TDEs.
-
fitted input called prediction
[Section 4.2, Forward Modelling of TDEs, Eq 3 and Figure 4]
"Therefore, we consider the steeper combined TDE+KH13 relationship derived in Eq 3, and use this for forward modelling. We note that this relationship includes the observed TDE sample that has already been impacted by both the Hills and Malmquist biases... It can be seen in Fig 4 that when we use the TDE+KH13 relationship in our simulation, the observed TDE sample is successfully recovered and the relative flatness in the TDE-only sample is accounted for."
Equation 3 is the power-law fit to the union of the 40 observed TDE points and the KH13 high-mass sample. Inserting that fitted relation as the parent distribution in the forward model and then reporting that the simulated, selected population 'successfully recovers' the observed TDE sample is a self-consistency check rather than an independent prediction: the central locus of the simulated cloud is pinned by the input relation, which was itself forced through the same TDE points. The demonstration that Hills/Malmquist cuts flatten the simulated slope (Eq 9, beta = 0.83) is not fully forced and is a separate, weaker claim; moreover, the central 'steepening cannot be explained' conclusion comes from the earlier simulations using the independent KH13 and MM13 input relations (Fig 3).
full rationale
The paper's core result—that TDE host black holes sit systematically below extrapolations of the Kormendy & Ho (2013) and McConnell & Ma (2013) relations, requiring a steeper combined slope—is not circular by construction. The black hole masses come from the Mummery et al. (2024) late-time plateau model, whose input physics (L_plateau proportional to M_BH^(2/3)) is independent of host bulge mass; the bulge masses come from independent Prospector SED fits. Thus the measured TDE-only correlation and the offset from the high-mass calibrations have genuine empirical content. The heavy reliance on same-group calibrations (all 40 M_BH values, the Hills-mass formula, and the peak-luminosity relation of Eq 8) raises model-dependence and external-validity concerns, but that is a correctness risk, not circularity, because those cited results are not defined in terms of the target slope and are testable outside this paper. The one concrete circular step is in Section 4.2: the forward model is run with Eq 3, a relation fitted to the very TDEs the simulation is then said to 'successfully recover.' That recovery is essentially guaranteed by the input, so it cannot independently validate the steepened relation. However, the flattening inference and the central steepening claim do not reduce entirely to this loop, because the decisive comparison against literature relations is made separately. I therefore assign a partial circularity score of 4 rather than a higher score.
Assumptions & free parameters
free parameters (6)
- Peak luminosity versus black hole mass relation (Eq 8) =
log10(nu L_nu,peak) = log10(M_BH/M_sun) - 6.52, scatter 0.53 dex
- Survey limiting magnitude =
19.5 mag in g-band (LSST scenario: 23.5 mag)
- Distance sampling prior =
P(D) proportional to D^2 for 0 < D < 1000 Mpc
- Host galaxy stellar mass function =
Phi* = 12.16e-4 Mpc^-3, M* = 11.22, alpha = -1.29
- Bulge-to-total mass ratio table =
Average (B/T)_g for nine stellar mass bins (Stone et al. 2018)
- Black hole spin treatment =
a = 0 (fiducial) or flat prior in [-1, 1]
assumptions (6)
- domain assumption Late-time plateau luminosity scales as L_plat proportional to M_BH^(2/3) over the TDE black hole mass range
- domain assumption The spin-modified Hills mass formula determines which black holes can produce observable TDEs
- domain assumption TDE host bulges have the same average (B/T) as the general galaxy population at a given stellar mass
- domain assumption Peak g-band luminosity tracks black hole mass as in Eq 8, with plateau luminosity about 1% of peak
- domain assumption Prospector stellar masses for TDE hosts are directly comparable to the KH13 galaxy bulge masses
- standard math Standard chi-square minimization with the Nukers scatter estimator yields unbiased slope and intercept
Cite this review
Pith. "Pith review of Evidence for a steeper SMBH-Bulge mass relationship extended to low masses using TDE host galaxies." pith.science (2026). https://pith.science/paper/CSRHHPIM
@misc{pith2026250616155,
  author       = {Pith},
  title        = {Pith review of: Evidence for a steeper SMBH-Bulge mass relationship extended to low masses using TDE host galaxies},
  year         = {2026},
  howpublished = {\url{https://pith.science/paper/CSRHHPIM}},
  note         = {Machine review of arXiv:2506.16155}
}
abstract
Tidal disruption events (TDEs) are excellent tools for probing low mass supermassive black holes (SMBHs) that may otherwise remain undetected. Here, we present an extended SMBH--Bulge mass scaling relationship using these lower mass TDE black holes and their host galaxies. Bulge masses are derived using Prospector fits to UV-MIR spectral energy distributions for the hosts of 40 TDEs that have a detected late-time UV/optical plateau emission, from which a SMBH mass is derived. Overall, we find that TDE plateaus are a successful method for probing BH scaling relations. We combine the observed TDE sample with a higher mass SMBH sample and extend the known relationship, recovering a steeper slope ($m = 1.34 \pm 0.03$) than current literature estimates, which focus on the high mass regime. For the TDE only sample, we measure an equally significant but shallower relationship with a power-law slope of $m = 1.17 \pm 0.10$ and significance $<0.001$. Forward modelling is used to determine whether known selection effects can explain both the comparatively flatter TDE only relation and the overall steepening across the full SMBH mass range. We find that the flattening at TDE masses can be accounted for, however the steepening can not. It appears that if a single slope extends for the whole BH mass range, it must be steeper to include the TDE population.
Figures


Figures from the paper (3 more)


Reference graph
Works this paper leans on
-
[1]
write newline
" write newline "" before.all 'output.state := FUNCTION fin.entry write newline FUNCTION new.block output.state before.all = 'skip after.block 'output.state := if FUNCTION new.sentence output.state after.block = 'skip output.state before.all = 'skip after.sentence 'output.state := if if FUNCTION not #0 #1 if FUNCTION and 'skip pop #0 if FUNCTION or pop #1...
-
[2]
Bentz M. C., et al., 2013, @doi [ ] 10.1088/0004-637X/767/2/149 , https://ui.adsabs.harvard.edu/abs/2013ApJ...767..149B 767, 149
-
[3]
Bianco F. B., et al., 2021, @doi [The Astrophysical Journal Supplement Series] 10.3847/1538-4365/ac3e72 , 258, 1
-
[4]
Bricman K., Gomboc A., 2020, @doi [The Astrophysical Journal] 10.3847/1538-4357/ab6989 , 890, 73
-
[5]
Chambers K., 2006, in Ryan S., ed., The Advanced Maui Optical and Space Surveillance Technologies Conference. p. E39
work page 2006
-
[6]
Conroy C., Gunn J. E., White M., 2009, @doi [The Astrophysical Journal] https://doi.org/10.1088/0004-637X/699/1/486 , 699, 486
-
[7]
A., 2014, arXiv: Instrumentation and Methods for Astrophysics
Curran P. A., 2014, arXiv: Instrumentation and Methods for Astrophysics
work page 2014
-
[8]
Ferrarese L., Merritt D., 2000, @doi [ ] 10.1086/312838 , https://ui.adsabs.harvard.edu/abs/2000ApJ...539L...9F 539, L9
doi:10.1086/312838 2000
Show all 62 references
-
[9]
B., Drory N., 2008, @doi [The Astronomical Journal] https://doi.org/10.1088/0004-6256/136/2/773 , 136, 773
Fisher D. B., Drory N., 2008, @doi [The Astronomical Journal] https://doi.org/10.1088/0004-6256/136/2/773 , 136, 773
2008 doi
-
[10]
Gebhardt K., et al., 2000, @doi [ ] 10.1086/312840 , https://ui.adsabs.harvard.edu/abs/2000ApJ...539L..13G 539, L13
2000 doi
-
[11]
E., et al., 2016, @doi [ ] 10.3847/2041-8205/826/2/L32 , https://ui.adsabs.harvard.edu/abs/2016ApJ...826L..32G 826, L32
Greene J. E., et al., 2016, @doi [ ] 10.3847/2041-8205/826/2/L32 , https://ui.adsabs.harvard.edu/abs/2016ApJ...826L..32G 826, L32
2016 doi
-
[12]
E., Strader J., Ho L
Greene J. E., Strader J., Ho L. C., 2020, @doi [ ] 10.1146/annurev-astro-032620-021835 , https://ui.adsabs.harvard.edu/abs/2020ARA&A..58..257G 58, 257
2020 doi
-
[13]
G \"u ltekin K., et al., 2009, @doi [ ] 10.1088/0004-637X/698/1/198 , https://ui.adsabs.harvard.edu/abs/2009ApJ...698..198G 698, 198
2009 doi
-
[14]
Hammerstein E., et al., 2022, @doi [The Astrophysical Journal] 10.3847/1538-4357/aca283 , 942, 9
2022 doi
-
[15]
G., 1975, @doi [Nature] https://doi.org/10.1038/254295a0 , 254, 295–298
Hills J. G., 1975, @doi [Nature] https://doi.org/10.1038/254295a0 , 254, 295–298
1975 doi
-
[16]
L., 2008, The Dark Energy Camera (DECam) ( @eprint arXiv 0810.3600 ), https://arxiv.org/abs/0810.3600
Honscheid K., DePoy D. L., 2008, The Dark Energy Camera (DECam) ( @eprint arXiv 0810.3600 ), https://arxiv.org/abs/0810.3600
2008 arXiv
-
[17]
Hu J., 2008, @doi [Monthly Notices of the Royal Astronomical Society] https://doi.org/10.1111/j.1365-2966.2008.13195.x , 386, 2242–2252
2008
-
[18]
Hung T., et al., 2017, @doi [The Astrophysical Journal] https://doi.org/10.3847/1538-4357/aa7337 , 842, 29
2017 doi
-
[19]
Häring N., Rix H.-W., 2014, @doi [The Astrophysical Journal] 10.1086/383567 , 487, L89–L92
2014 doi
-
[20]
Ivezi \'c Z ., et al., 2019, @doi [ ] 10.3847/1538-4357/ab042c , https://ui.adsabs.harvard.edu/abs/2019ApJ...873..111I 873, 111
2019 doi
-
[21]
E., Ho L
Jiang Y.-F., Greene J. E., Ho L. C., 2011, @doi [ ] 10.1088/2041-8205/737/2/L45 , https://ui.adsabs.harvard.edu/abs/2011ApJ...737L..45J 737, L45
2011 doi
-
[22]
Kesden M., 2012, @doi [Phys. Rev. D] 10.1103/PhysRevD.85.024037 , 85, 024037
2012 doi
-
[23]
Kippenhahn R., Weigert A., 1990, Stellar Structure and Evolution
1990
-
[24]
C., 2013, @doi [Annual Review of Astronomy and Astrophysics] https://doi.org/10.1146/annurev-astro-082708-101811 , 51, 511
Kormendy J., Ho L. C., 2013, @doi [Annual Review of Astronomy and Astrophysics] https://doi.org/10.1146/annurev-astro-082708-101811 , 51, 511
2013 doi
-
[25]
Kormendy J., Kennicutt Jr. R. C., 2004, @doi [ ] 10.1146/annurev.astro.42.053102.134024 , https://ui.adsabs.harvard.edu/abs/2004ARA&A..42..603K 42, 603
2004
-
[26]
Krajnovi \'c D., et al., 2018, @doi [ ] 10.1093/mnras/sty778 , https://ui.adsabs.harvard.edu/abs/2018MNRAS.477.3030K 477, 3030
2018 doi
-
[27]
H., Townes C
Lacy J. H., Townes C. H., 1982, @doi [The Astrophysical Journal] 10.1086/160402 , 262, 120
1982 doi
-
[28]
D., Conroy C., van Dokkum P
Leja J., Johnson B. D., Conroy C., van Dokkum P. G., Byler N., 2017, @doi [The Astrophysical Journal] https://doi.org/10.3847/1538-4357/aa5ffe , 837, 170
2017 doi
-
[29]
C., Johnson B
Leja J., Carnall A. C., Johnson B. D., Conroy C., Speagle J. S., 2019, @doi [The Astrophysical Journal] 10.3847/1538-4357/ab133c , 876, 3
2019 doi
-
[30]
Magorrian J., et al., 1998, @doi [ ] 10.1086/300353 , https://ui.adsabs.harvard.edu/abs/1998AJ....115.2285M 115, 2285
1998 doi
-
[31]
C., et al., 2005, @doi [ ] 10.1086/426387 , https://ui.adsabs.harvard.edu/abs/2005ApJ...619L...1M 619, L1
Martin D. C., et al., 2005, @doi [ ] 10.1086/426387 , https://ui.adsabs.harvard.edu/abs/2005ApJ...619L...1M 619, L1
2005 doi
-
[32]
J., Ma C.-P., 2013, @doi [ ] 10.1088/0004-637X/764/2/184 , https://ui.adsabs.harvard.edu/abs/2013ApJ...764..184M 764, 184
McConnell N. J., Ma C.-P., 2013, @doi [ ] 10.1088/0004-637X/764/2/184 , https://ui.adsabs.harvard.edu/abs/2013ApJ...764..184M 764, 184
2013 doi
-
[33]
Mockler B., Guillochon J., Ramirez-Ruiz E., 2019, @doi [The Astrophysical Journal] https://doi.org/10.3847/1538-4357/ab010f , 872, 151
2019 doi
-
[34]
Mummery A., 2024, @doi [ ] 10.1093/mnras/stad3636 , https://ui.adsabs.harvard.edu/abs/2024MNRAS.527.6233M 527, 6233
2024 doi
-
[35]
A., 2020, @doi [Monthly Notices of the Royal Astronomical Society] 10.1093/mnras/staa192 , 492, 5655
Mummery A., Balbus S. A., 2020, @doi [Monthly Notices of the Royal Astronomical Society] 10.1093/mnras/staa192 , 492, 5655
2020 doi
-
[36]
Mummery A., van Velzen S., Nathan E., Ingram A., Hammerstein E., Fraser-Taliente L., Balbus S., 2024, @doi [ ] 10.1093/mnras/stad3001 , https://ui.adsabs.harvard.edu/abs/2024MNRAS.527.2452M 527, 2452
2024 doi
-
[37]
Muzzin A., et al., 2013, @doi [ ] 10.1088/0004-637X/777/1/18 , https://ui.adsabs.harvard.edu/abs/2013ApJ...777...18M 777, 18
2013 doi
-
[38]
D., et al., 2019, @doi [The Astrophysical Journal] 10.3847/1538-4357/aafe7a , 872, 104
Nguyen D. D., et al., 2019, @doi [The Astrophysical Journal] 10.3847/1538-4357/aafe7a , 872, 104
2019 doi
-
[39]
J., 2022, arXiv e-prints, https://ui.adsabs.harvard.edu/abs/2022arXiv220102649N p
Nicholl M., Lanning D., Ramsden P., Mockler B., Lawrence A., Short P., Ridley E. J., 2022, arXiv e-prints, https://ui.adsabs.harvard.edu/abs/2022arXiv220102649N p. arXiv:2201.02649
2022 arXiv
-
[40]
S., 1989, in Morris M., ed., IAU Symposium Vol
Phinney E. S., 1989, in Morris M., ed., IAU Symposium Vol. 136, The Center of the Galaxy. p. 543
1989
-
[41]
M., Shiokawa H., 2015, @doi [ApJ] 10.1088/0004-637X/806/2/164 , https://ui.adsabs.harvard.edu/abs/2015ApJ...806..164P 806, 164
Piran T., Svirski G., Krolik J., Cheng R. M., Shiokawa H., 2015, @doi [ApJ] 10.1088/0004-637X/806/2/164 , https://ui.adsabs.harvard.edu/abs/2015ApJ...806..164P 806, 164
2015 doi
-
[42]
L., 2022, @doi [Monthly Notices of the Royal Astronomical Society] 10.1093/mnras/stac1810 , 515, 1146
Ramsden P., Lanning D., Nicholl M., McGee S. L., 2022, @doi [Monthly Notices of the Royal Astronomical Society] 10.1093/mnras/stac1810 , 515, 1146
2022 doi
-
[43]
Rees M., 1988, @doi [Nature] https://doi.org/10.1038/333523a0 , 333, 523–528
1988 doi
-
[44]
E., Volonteri M., 2015, @doi [The Astrophysical Journal] 10.1088/0004-637x/813/2/82 , 813, 82
Reines A. E., Volonteri M., 2015, @doi [The Astrophysical Journal] 10.1088/0004-637x/813/2/82 , 813, 82
2015 doi
-
[45]
Robotham A. S. G., Taranu D. S., Tobar R., Moffett A., Driver S. P., 2017, @doi [ ] 10.1093/mnras/stw3039 , https://ui.adsabs.harvard.edu/abs/2017MNRAS.466.1513R 466, 1513
2017 doi
-
[46]
Roth N., Kasen D., Guillochon J., Ramirez-Ruiz E., 2016, @doi [The Astrophysical Journal] 10.3847/0004-637x/827/1/3 , 827, 3
2016 doi
-
[47]
Ryu T., Krolik J., Piran T., 2020, @doi [ ] 10.3847/1538-4357/abbf4d , https://ui.adsabs.harvard.edu/abs/2020ApJ...904...73R 904, 73
2020 doi
-
[48]
Sazonov S., et al., 2021, @doi [ ] 10.1093/mnras/stab2843 , https://ui.adsabs.harvard.edu/abs/2021MNRAS.508.3820S 508, 3820
2021 doi
-
[49]
Schechter P., 1976, @doi [ ] 10.1086/154079 , https://ui.adsabs.harvard.edu/abs/1976ApJ...203..297S 203, 297
1976 doi
-
[50]
F., Meisner A
Schlafly E. F., Meisner A. M., Green G. M., 2019, @doi [The Astrophysical Journal Supplement Series] 10.3847/1538-4365/aafbea , 240, 30
2019 doi
-
[51]
E., Greene J
Schutte Z., Reines A. E., Greene J. E., 2019, @doi [The Astrophysical Journal] 10.3847/1538-4357/ab35dd , 887, 245
2019 doi
-
[52]
F., et al., 2006, @doi [ ] 10.1086/498708 , https://ui.adsabs.harvard.edu/abs/2006AJ....131.1163S 131, 1163
Skrutskie M. F., et al., 2006, @doi [ ] 10.1086/498708 , https://ui.adsabs.harvard.edu/abs/2006AJ....131.1163S 131, 1163
2006 doi
-
[53]
C., Generozov A., Vasiliev E., Metzger B
Stone N. C., Generozov A., Vasiliev E., Metzger B. D., 2018, @doi [Monthly Notices of the Royal Astronomical Society] https://doi.org/10.1093/mnras/sty2045 , 480, 5060–5077
2018 doi
-
[54]
A., de Zeeuw P
Thater S., Krajnović D., Cappellari M., Davis T. A., de Zeeuw P. T., McDermid R. M., Sarzi M., 2019, @doi [Astronomy & Astrophysics] 10.1051/0004-6361/201834808 , 625, A62
2019 doi
-
[55]
Tremaine S., et al., 2002, @doi [ ] 10.1086/341002 , https://ui.adsabs.harvard.edu/abs/2002ApJ...574..740T 574, 740
2002 doi
-
[56]
C., van Velzen S., Jonker P
Wevers T., Stone N. C., van Velzen S., Jonker P. G., Hung T., Auchettl K., Gezari S., Onori F., 2019, @doi [Monthly Notices of the Royal Astronomical Society] 10.1093/mnras/stz1602 , 487, 4136
2019 doi
-
[57]
L., et al., 2010, @doi [ ] 10.1088/0004-6256/140/6/1868 , https://ui.adsabs.harvard.edu/abs/2010AJ....140.1868W 140, 1868
Wright E. L., et al., 2010, @doi [ ] 10.1088/0004-6256/140/6/1868 , https://ui.adsabs.harvard.edu/abs/2010AJ....140.1868W 140, 1868
2010 doi
-
[58]
Yao Y., et al., 2023, Tidal Disruption Event Demographics with the Zwicky Transient Facility: Volumetric Rates, Luminosity Function, and Implications for the Local Black Hole Mass Function ( @eprint arXiv 2303.06523 ), https://arxiv.org/abs/2303.06523
2023 arXiv
-
[59]
G., et al., 2000, @doi [ ] 10.1086/301513 , https://ui.adsabs.harvard.edu/abs/2000AJ....120.1579Y 120, 1579
York D. G., et al., 2000, @doi [ ] 10.1086/301513 , https://ui.adsabs.harvard.edu/abs/2000AJ....120.1579Y 120, 1579
2000 doi
-
[60]
van Velzen S., 2018, @doi [The Astrophysical Journal] https://doi.org/10.3847/1538-4357/aa998e , 852, 72
2018 doi
-
[61]
van Velzen S., et al., 2011, @doi [The Astrophysical Journal] 10.1088/0004-637X/741/2/73 , https://ui.adsabs.harvard.edu/abs/2011ApJ...741...73V 741, 73
2011 doi
-
[62]
van Velzen S., Holoien T. W. S., Onori F., Hung T., Arcavi I., 2020, @doi [ ] 10.1007/s11214-020-00753-z , https://ui.adsabs.harvard.edu/abs/2020SSRv..216..124V 216, 124
2020 doi
Reviewed August 6, 2026 · model on record in the stance chip above.
Discussion (0). Sign in to comment.