REVIEW 4 major objections 5 minor 54 references
Cosmic-ray and Interstellar Gas Properties in the Solar Neighborhood Revealed by Diffuse Gamma Rays
T0 review · 4 major / 5 minor · reviewed 2026-08-06 · deepseek-v4-flash
Pith's one-line read Decomposing the 21 cm HI line into narrow and broad components removes the apparent excess of local cosmic-ray emissivity and brings gamma-ray results in line with direct measurements.
desk verdict A careful, mostly convincing analysis that likely resolves the long-standing local gamma-ray emissivity discrepancy, but the unquantified IC/isotropic degeneracy needs attention before the CR gradient claim is fully trusted. read the letter →
The pith
A machine-rendered reading of the paper's core claim, the machinery that carries it, and where it could break.
The reading
What carries the argument
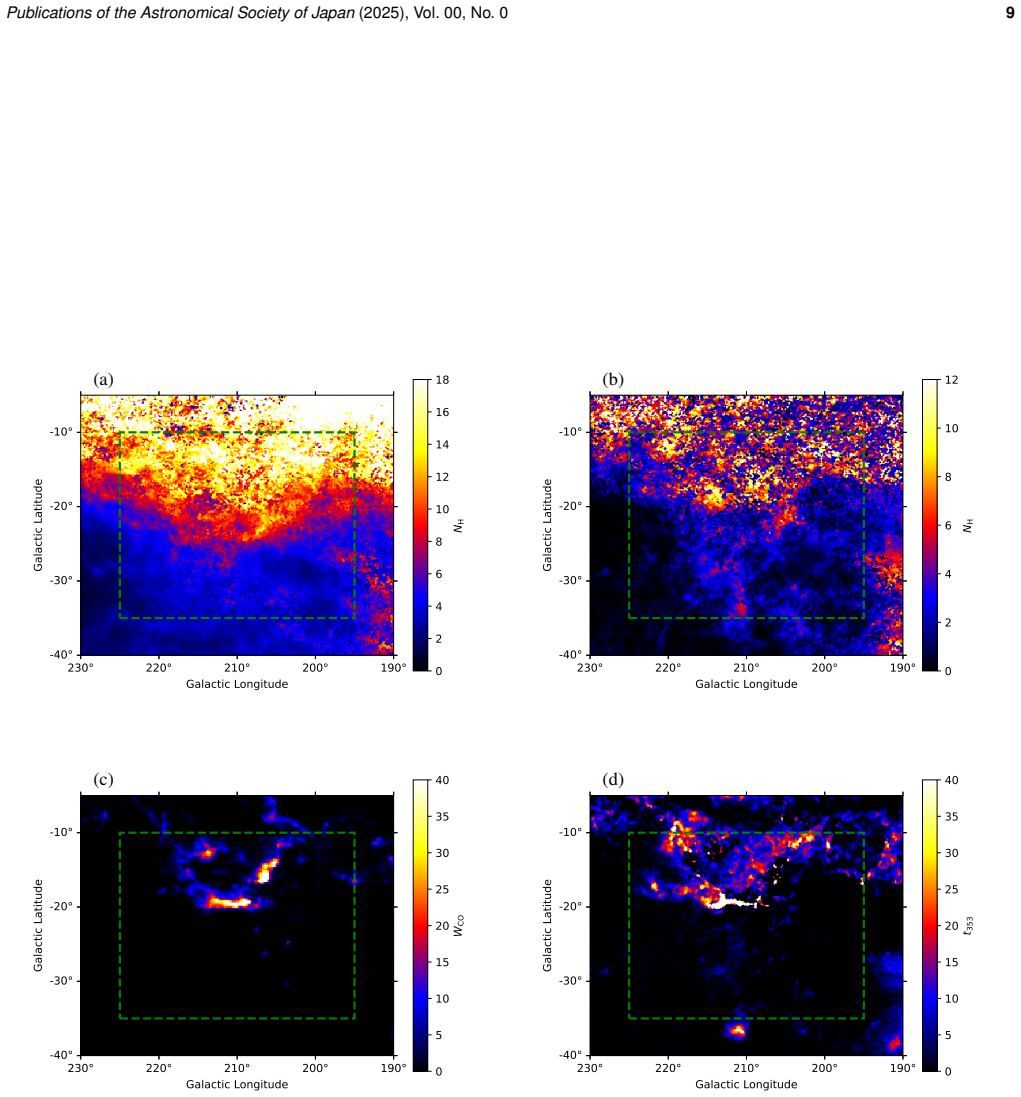
The central object is the template-fit model of Equation (1), in which the observed gamma-ray intensity is a sum of gas-phase templates (non-local, narrow, and broad HI; CO; residual dust) multiplied by a common energy-dependent emissivity per H atom, plus inverse-Compton, isotropic, and point-source components. The decisive mechanism is the HI line-width separation: components with Doppler temperature below 1000 K are treated as optically thick and corrected by a fitted scale factor, while broader components are treated as optically thin and set the cosmic-ray normalization. The residual dust-emission map, formed by fitting Planck dust templates with HI and CO templates and keeping the leftover, is interpreted as CO-dark H2; its proportionality to gas column is assumed and then tested against gamma-rays by comparing $ au_{353}$, radiance, and revised $ au_{353}$ versions.
What would settle it
A direct test would be a 21 cm absorption measurement of the broad HI components in one of the five regions: if their optical depth exceeds roughly 0.1, the optically thin column is underestimated and the apparent agreement with directly measured cosmic rays would be an artifact. A second check is to repeat the Cep/Pol fit with the non-local HI velocity boundary shifted by a few km/s; if the claimed ~10% inner-Galaxy gradient moves or disappears, that gradient is not robust.
Extended reading notes
Core claim
The central discovery is that the gamma-ray emissivity per H atom of the broad, optically thin HI component matches the prediction from directly measured cosmic-ray spectra at Earth in all five regions once narrow HI is allowed to be optically thick. This removes the discrepancy that had supported either enhanced local CR intensities or systematically underestimated gas columns. The paper also reports a ~10% emissivity gradient across ~500 pc toward the inner Galaxy, and finds that the ratio of CO-dark H2 to CO-bright H2 anticorrelates with cloud mass, with low-mass clouds around $10^3$ solar masses having ratios of 5-10. These results are obtained by decomposing the ISM into five phases: non-local HI, narrow-line optically thick HI, broad-line optically thin HI, CO-bright H2, and CO-dark H2 traced by residual dust emission.
Load-bearing premise
The load-bearing premise is that the residual dust-emission map is proportional to the amount of CO-dark H2, and that the broad HI gas is transparent enough for its gamma-ray glow to measure the cosmic-ray intensity; the paper itself notes the first proportionality is not granted.
Editorial extensions
If this is right
- If the paper is right, earlier gamma-ray estimates of the local cosmic-ray intensity and gas column built on uniform-$T_s$ HI templates are biased high by 5-30%.
- The agreement with directly measured CR spectra means gamma-ray emissivity of optically thin HI can serve as a cross-check for cosmic-ray intensity independent of propagation models.
- The ~10% inner-Galaxy rise over ~500 pc is compatible with standard CR propagation, so nearby clouds sample a modest CR gradient rather than a flat local intensity.
- The CO-dark-to-CO-bright H2 ratio of 5-10 in small clouds means CO luminosity seriously undercounts molecular mass in low-mass clouds.
- Studies of cosmic-ray sources that use CO-traced cloud masses must include CO-dark H2 or they will overestimate the energy budget of the accelerator.
Reading between the lines
- A natural extension is to apply the same narrow/broad HI decomposition to other nearby high-latitude clouds; if the emissivity stays flat and the CO-dark ratio continues to rise toward low masses, the pattern is a general ISM property rather than a property of these five regions.
- The results imply that the local cosmic-ray excess reported by some uniform-$T_s$ analyses may not be a real spectral feature, which would weaken claims of a local CR source or gradient based on those analyses.
- If the CO-dark H2/CO-bright H2 anti-correlation holds in lower-metallicity or more diffuse clouds, it could connect to extragalactic CO conversion factors, where small, weakly shielded clouds dominate.
- The assumed proportionality of the residual dust map could be tested directly by comparing the gamma-ray-derived CO-dark column with independent dust extinction maps in the same regions; a linear correlation would confirm the template.
Editorial analysis
A structured set of objections, weighed in public.
Referee Report
Summary. This paper analyzes 15 years of Fermi-LAT gamma-ray data (0.1–25.6 GeV) toward five nearby molecular cloud regions (MBM/Pegasus, R CrA, Chamaeleon, Cep/Pol, Orion). The authors construct ISM templates from a Gaussian decomposition of the HI 21-cm line into non-local, narrow (optically thick), and broad (optically thin) components, from CO line emission, and from a residual Planck dust-emission template interpreted as CO-dark H2. A binned maximum-likelihood fit of Eq. (1) decomposes the gamma-ray intensity into gas components (each normalized by C_HI,i, C_CO, C_dust), an IC template, an isotropic background, point sources, and, for R CrA, a Fermi-bubble template. The main claims are: (i) narrow HI is optically thick; (ii) the gamma-ray emissivity per H atom of broad HI agrees with the model based on directly measured CR spectra at Earth, with a possible ~10% decrease toward the inner Galaxy over ~500 pc; and (iii) the CO-dark-to-CO-bright H2 ratio anti-correlates with cloud mass, reaching 5–10 for ~1000 M_sun clouds. The abstract and Section 5 present these as the principal results.
Significance. If the central claim holds, the paper resolves a long-standing discrepancy in which uniform-T_s analyses inferred excess gamma-ray emissivity relative to directly measured CR spectra, and it provides a new, consistent way to separate optically thin HI, optically thick HI, and CO-dark H2 over a range of cloud masses. The analysis is thorough in several respects: it uses 15 years of LAT data with the latest response functions, tests three dust templates and three IC models, applies iterative template construction with outlier rejection, and explicitly cross-checks spin-temperature corrections. The acknowledgment of limitations (e.g., the proportionality assumption for D_em,res, and the possible contribution of non-local HI to the Cep/Pol dip) is welcome. However, the key CR-intensity result rests on the broad-HI normalization being unbiased by the unconstrained IC/isotropic templates, and the secondary ISM claims depend on a dust-to-gas scaling that is acknowledged to be not granted. These points need quantitative treatment before the paper can be accepted.
major comments (4)
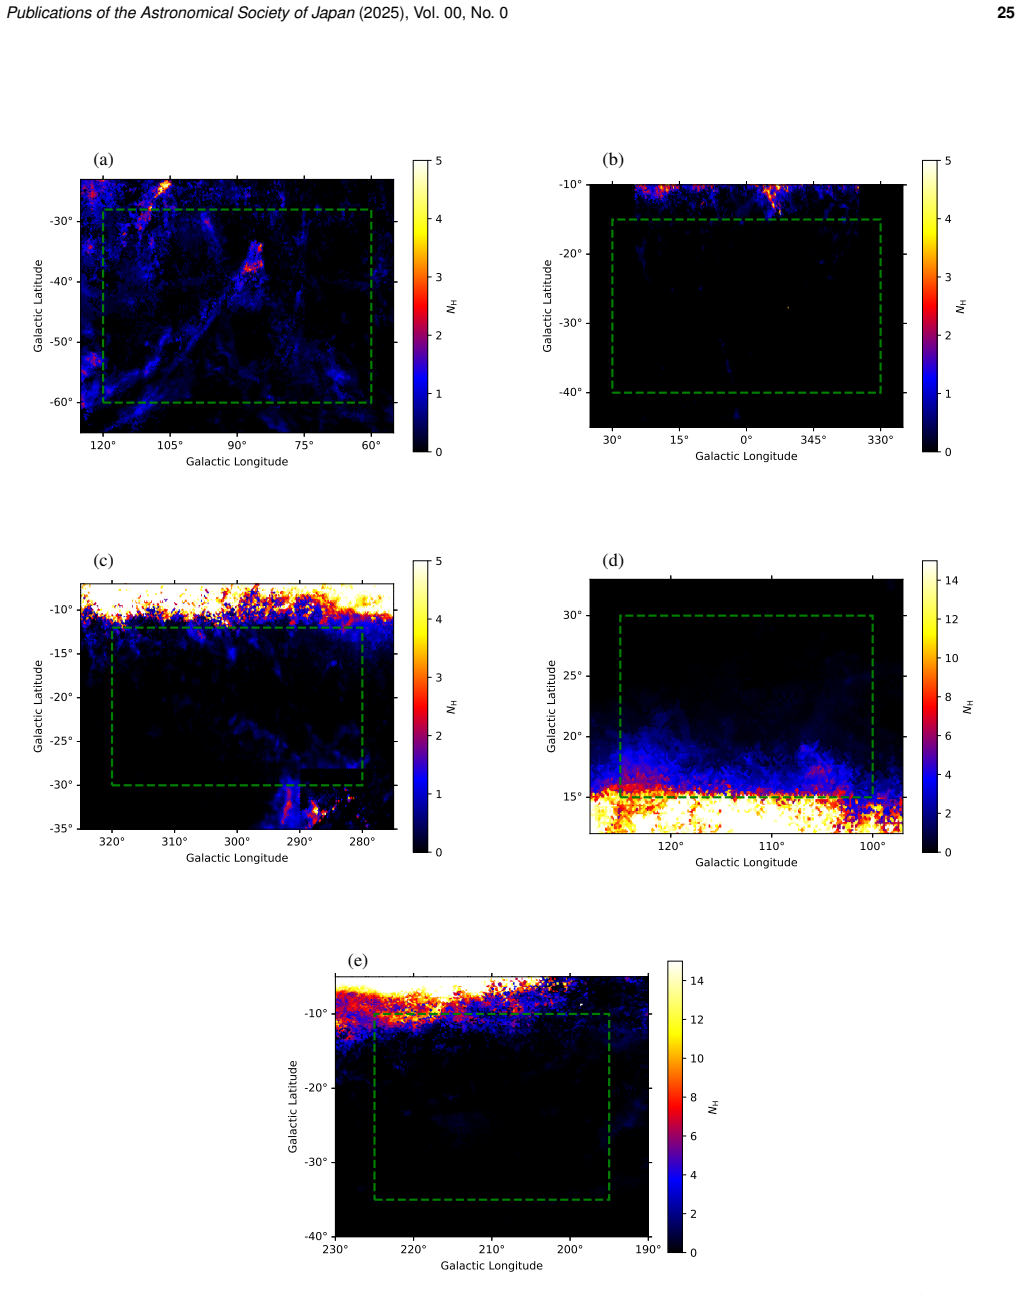
- [§2.2.4, Eq. (1); Tables 4–5; §4.1] The fit treats C_IC and C_iso as independent free parameters in each ROI and each energy band. The best-fit values vary dramatically across the five ROIs: C_IC = 0 in Orion (Table 5) versus 3.4–4.3 in Cep/Pol (Table 4), with intermediate values in MBM/Pegasus, R CrA, and Chamaeleon; C_iso is fixed to 0 in Cep/Pol but reaches ~1.6–1.7 in Orion. Because the IC and isotropic templates are smooth, they can absorb large-scale spatial structure not captured by the gas templates, including gas correlated with broad HI. Since broad HI is the anchor for the claimed CR-model agreement and the ~10% gradient, the quoted ~4% systematic uncertainty (Section 4.1) does not cover this degeneracy. I ask the authors to quantify the impact: for example, by profiling C_IC and C_iso with physically motivated priors, by joint fitting with a single IC normalization shared across ROIs, or by explicitly propagating the observed C_IC/C_iso excursions into the derived emissivities and their errors.
- [§2.2.2; Table 6; Fig. 13] The residual gas template D_em,res is assumed to be proportional to the CO-dark H2 column density, and the paper explicitly states that this is 'not granted.' The nonlinearity of the tau_353-to-column ratio with density (Remy et al. 2017) can directly bias the CO-dark H2 column densities in Table 6 and the anti-correlation in Fig. 13, which is a secondary but load-bearing result. The authors should estimate the size of this bias, for example by using a density-dependent dust-to-gas factor or by cross-checking against an independent tracer such as reddening or extinction in a subset of regions.
- [§4.1; Fig. 12] The claimed ~10% gradient of the CR intensity with Galactocentric radius is based on five emissivity points, one of which (Cep/Pol) is a marked outlier attributed by the authors to non-local HI contamination. No statistical significance is given for the trend, and the error bars do not include the IC/iso degeneracy discussed above. The authors should either present a fit to the trend with a significance estimate that includes systematic uncertainties, or explicitly label the gradient as tentative and model-dependent.
- [Tables 4 and 5 captions] C_iso is fixed to 0 for the Cep/Pol region and C_IC is fixed to 0 for the Orion region because the best-fit values were 'very small.' Setting parameters to zero on the basis of an unconstrained fit can bias the remaining coefficients, particularly C_HI,2. Please show that the unconstrained best-fit values are consistent with zero within uncertainties and demonstrate that fixing them does not change C_HI,2 by more than the quoted statistical errors, or treat this choice as an additional systematic uncertainty.
minor comments (5)
- [§2.2.1] The velocity-boundary description contains unit errors: '|v_LSR| is decreased above 15° to -100 K km s^-1' and 'increased by 30 K km s^-1' should read km s^-1, not K km s^-1. Also, the sentence beginning 'Similarly, v_LSR is decreased...' appears to be missing a subject for the region name.
- [Table 6] In the Orion row, the broad-HI entry reads '57,2' instead of '57.2'; this typo should be corrected.
- [Abstract and §2.1] The spelling 'Camaeleon' appears in the ROI definition and in the abstract/body inconsistently with 'Chamaeleon' used elsewhere; please harmonize.
- [References] The reference 'Panooulou, G. V.' should be 'Panopoulou, G. V.'; also, 'diredtly' in Section 1 and 'devided' in Section 2.3 are typos.
- [Fig. 12] The figure caption states that the Orion point is shifted horizontally for clarity, but it is not obvious in the figure how the shift is indicated; please add a note or an explicit offset marker.
Circularity Check
No circularity found: the claimed CR-emissivity agreement is a genuine cross-check because the adopted emissivity model q_gamma is constructed from independent directly measured CR spectra, not from the Fermi-LAT data being fit, and the flagged limitations are modeling assumptions rather than self-referential reductions.
full rationale
The central derivation chain is: (i) build gas templates from HI-line decomposition, Planck dust, and CO; (ii) fit Equation (1) with free normalizations C_HI,i, C_CO, C_dust, C_IC, C_iso; and (iii) compare the resulting broad-HI emissivity, C_HI,2 times q_gamma, with q_gamma itself. Step (iii) is a consistency test, not a reduction: C_HI,2 is left free by construction and is not forced to unity, and the reported values do deviate region-to-region (e.g., MBM/Pegasus local C_HI,1+2 around 1.0-1.12 versus Cep/Pol around 0.88-1.01 across energy bins). The model q_gamma is cited from Mizuno et al. (2022), but the paper states it is 'based on directly-measured CR spectra (Maurin et al. 2014), hadronic interaction models (AAfrag; Kachelriess et al. 2019), and an electron/positron bremsstrahlung model (Orlando 2018)', i.e., independent of the present gamma-ray fits. The paper explicitly flags the residual-gas-template assumption in Section 2.2.2: 'we assumed the D_em,res map is proportional to the residual gas distribution, which is not granted'; this is an honest limitation about template linearity that could bias CO-dark H2 estimates, but D_em,res is constructed from dust data, not from the gamma-ray emissivity it later calibrates, so it is not a self-referential circular step. Similarly, the large ROI-dependent C_IC/C_iso variations (e.g., C_IC around 3.4-4.3 in Cep/Pol and fixed to 0 in Orion) represent a fitting degeneracy and a systematic-uncertainty concern, not a reduction of a predicted quantity to its input. No load-bearing claim reduces to a self-citation, and no uniqueness theorem or ansatz is imported from the authors' prior work to forbid alternatives. The paper is self-contained against external benchmarks (previous emissivity results and the CR-based model), so no circularity is identified.
Assumptions & free parameters
free parameters (4)
- Narrow-HI correction factors per region =
1.27 (MBM), 1.12 (R CrA), 1.21 (Chamaeleon), 1.61 (Cep/Pol), 1.41 (Orion)
- Dust template selection thresholds T_d,th and f_broad-HI,th =
T_d,th = 19.0-20.5 K, f_broad-HI,th = 0.8
- Velocity boundaries separating local and non-local HI =
e.g., -30 to +20 km/s for MBM, -15 to +15 for R CrA and Chamaeleon, -8+ for Cep/Pol, -10 to +25 for Orion
- Spin temperatures T_s in cross-check =
50-90 K depending on region
assumptions (5)
- domain assumption Gamma-ray production cross section is independent of the chemical and thermodynamic state of the ISM gas, and the ISM is optically thin to gamma rays.
- domain assumption HI linewidth decomposition into narrow (T_D < 1000 K) and broad components traces optically thick and optically thin HI, respectively.
- ad hoc to paper Residual dust emission D_em,res is proportional to the CO-dark H2 gas column density.
- domain assumption The adopted gamma-ray emissivity model q_gamma, based on locally measured CR spectra, is valid with the same spectral shape in all five regions.
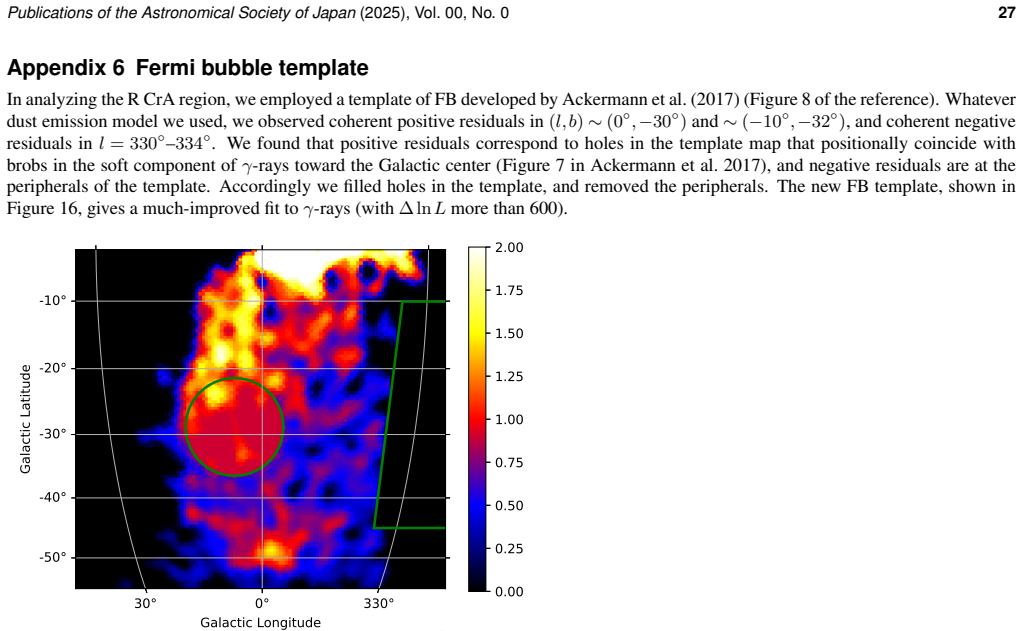
- domain assumption The Fermi bubble template (Ackermann et al. 2017, modified) correctly represents the R CrA background.
Cite this review
Pith. "Pith review of Cosmic-ray and Interstellar Gas Properties in the Solar Neighborhood Revealed by Diffuse Gamma Rays." pith.science (2026). https://pith.science/paper/QMITX66Y
@misc{pith2026250616252,
  author       = {Pith},
  title        = {Pith review of: Cosmic-ray and Interstellar Gas Properties in the Solar Neighborhood Revealed by Diffuse Gamma Rays},
  year         = {2026},
  howpublished = {\url{https://pith.science/paper/QMITX66Y}},
  note         = {Machine review of arXiv:2506.16252}
}
abstract
To investigate the interstellar medium (ISM) and Galactic cosmic rays (CRs) in the solar neighborhood, we analyzed ${\gamma}$-ray data by Fermi Large Area Telescope (LAT) for five nearby molecular cloud regions. Our data includes the MBM/Pegasus region (MBM~53, 54, 55 clouds and Pegasus loop), R CrA region (R Coronae Australis clouds), Chamaeleon region (Chamaeleon clouds), Cep/Pol region (Cepheus and Polaris flare), and Orion region (Orion clouds). The ISM templates are constructed by a component decomposition of the 21~cm {\HI} line, the Planck dust emission model, and the carbon monoxide (CO) 2.6~mm line. Through $\gamma$-ray data analysis the ISM gas is successfully decomposed into non-local {\HI}, narrow-line and optically thick {\HI}, broad-line and optically thin {\HI}, CO-bright {\Htwo}, and CO-dark {\Htwo} for all five regions. CR intensities evaluated by the ${\gamma}$-ray emissivity of broad {\HI} agree well with a model based on directly-measured CR spectra at the Earth, with a gradient giving a higher CR intensity toward the inner Galaxy at the 10\% level in ${\sim}$ 500~pc. The ratio of CO-dark {\Htwo} to CO-bright {\Htwo} anti-correlates with the {\Htwo} mass traced by the CO 2.6~mm line, and reaches 5--10 for small systems of ${\sim}$1000 solar mass.
Figures


Figures from the paper (14 more)




Reference graph
Works this paper leans on
-
[1]
A., Ackermann, M., Ajello, M., et al
Abdo, A. A., Ackermann, M., Ajello, M., et al. 2009, Astropart. Phys., 32, 193
work page 2009
-
[2]
2022, ApJS, 260, 53
Abdollahi, S., Acero, F., Baldini, L., et al. 2022, ApJS, 260, 53
2022
-
[3]
Ackermann, M. et al. 2017, ApJ, 840, 43
work page 2017
-
[4]
Amenomori, M. et al. 2021, Nature Astronomy, 5, 460
work page 2021
-
[5]
B., Abdo, A
Atwood, W. B., Abdo, A. A., Ackermann, M., et al. 2009, ApJ, 697, 1071
2009
-
[6]
B., Albert, L., Baldini, L., et al
Atwood, W. B., Albert, L., Baldini, L., et al. 2013, arXiv:1303.3514
arXiv 2013
-
[7]
Bloemen, J. B. G. M. et al. 1984, A&A, 139, 37
work page 1984
- [8]
Show all 54 references
-
[9]
2015, ApJ, 806, 240
Casandjian, J.-M. 2015, ApJ, 806, 240
2015
-
[10]
Casandjian, J.-M. et al. 2022, ApJ, 940, 116
2022
-
[11]
M., et al
Dame, T. M., et al. 1987, ApJ, 332, 706
1987
-
[12]
M., Hartmann, D., & Thaddeus, P
Dame, T. M., Hartmann, D., & Thaddeus, P. 2001, ApJ, 547, 792
2001
-
[13]
Dame, T. M. 2011, arXiv:1101.1499
2011 arXiv
-
[14]
M., & Lockman, F
Dickey, J. M., & Lockman, F. J. 1990, ARA&A, 28, 215
1990
-
[15]
Ferriere, K. M. 2001, Rev. Mod. Phys., 73, 1031
2001
-
[16]
2015, ApJ, 798, 6
Fukui, Y ., Torii, K., Onishi, T., et al. 2015, ApJ, 798, 6
2015
-
[17]
2014, ApJ, 796, 59 Galli P
Fukui, Y ., Okamoto, R., Kaji, et al. 2014, ApJ, 796, 59 Galli P. A. B., Bouy H., Olivares J. et al. 2020, A&A, 634 98 Górski, K. M., Hivon, E., Banday, A. J., et al. 2005, ApJ, 622, 759
2014
-
[18]
A., Casandjian, J.-M., & Terrier, R
Grenier, I. A., Casandjian, J.-M., & Terrier, R. 2005, Science, 307, 1292
2005
-
[19]
A., Black, J
Grenier, I. A., Black, J. H., & Strong, A. W. 2015, ARA&A, 53, 199
2015
-
[20]
2019, ApJ, 884, 130 HI4PI Collaboration 2016, A&A, 594, 116
Hayashi, K., Mizuno, T., Fukui, Y ., et al. 2019, ApJ, 884, 130 HI4PI Collaboration 2016, A&A, 594, 116
2019
-
[21]
V ., & Ostapchenko, S
Kachelriess, M., Moskalenko, I. V ., & Ostapchenko, S. 2019, Computer Physics Communications, 245, 106846
2019
-
[22]
W., & Kerp, J
Kalberla, P.M. W., & Kerp, J. 2009, ARA&A, 47, 27
2009
-
[23]
W., & Haud, U
Kalberla, P.M. W., & Haud, U. 2018, A&A, 619, 58
2018
-
[24]
W., Kerp, J., & Haud, U
Kalberla, P.M. W., Kerp, J., & Haud, U. 2020, A&A, 639, 26
2020
-
[25]
2006, ApJ, 638, 225
Kothes, R., et al. 2006, ApJ, 638, 225
2006
-
[26]
L., et al
Luhman, K. L., et al. 2008, in Handbook of Star Forming Regions, V olume II: THe Southern Sky, V ol. 5, ed. B. Reipurth (San Francisco, SA: ASP), 169
2008
-
[27]
R., Bertsch, D
Mattox, J. R., Bertsch, D. L., Chiang, J., et al. 1996, ApJ, 461, 396
1996
-
[28]
2014, A&A, 569, 32
Maurin, D., Melot, F., & Taillet, R. 2014, A&A, 569, 32
2014
-
[29]
2001, PASJ, 53, 1071
Mizuno, A., et al. 2001, PASJ, 53, 1071
2001
-
[30]
2016, ApJ, 833, 278
Mizuno, T., Abdollahi, S., Fukui, Y ., et al. 2016, ApJ, 833, 278
2016
-
[31]
2022, ApJ, 935, 97
Mizuno, T., et al. 2022, ApJ, 935, 97
2022
-
[32]
V ., Porter, T., Strong W
Moskalenko, I. V ., Porter, T., Strong W. 2006, ApJL, 640, 155
2006
-
[33]
M., Peek, J.E
Murray, C. M., Peek, J.E. G., Lee, M.-Y ., et al. 2018, ApJ, 862, 131
2018
-
[34]
2015, ApJS, 216, 18
Nishimura, A., et al. 2015, ApJS, 216, 18
2015
-
[35]
2018, MNRAS, 475, 2724
Orlando, E. 2018, MNRAS, 475, 2724
2018
-
[36]
V ., et al
Panooulou, G. V ., et al. 2016, MNRAS, 462, 1517
2016
-
[37]
A., et al
Perrot, C. A., et al. 2003, A&A, 404, 519 Planck Collaboration XIX 2011, A&A, 536, 19 Planck Collaboration XI 2014, A&A, 571, 11 Planck Collaboration XXVIII 2015, A&A, 582, 31
2003
-
[38]
A., Jóhannesson, G., Moskalenko, I
Porter, T. A., Jóhannesson, G., Moskalenko, I. V . 2017, ApJ, 846, 23
2017
-
[39]
T., Bon-Chul, K., & Carl, H
Reach, W. T., Bon-Chul, K., & Carl, H. 1994, ApJ, 429, 672
1994
-
[40]
2017, A&A, 601, 78
Remy, Q., et al. 2017, A&A, 601, 78
2017
-
[41]
2018, A&A, 611, 51
Remy, Q., et al. 2018, A&A, 611, 51
2018
-
[42]
J., Finkbeiner, D
Schlegel, D. J., Finkbeiner, D. P., & Davis, M. 1998, ApJ, 500, 525
1998
-
[43]
J., et al
Smith, R. J., et al. 2014, MNRAS, 441, 1628
2014
-
[44]
W., & Moskalenko, I
Strong, A. W., & Moskalenko, I. 1998, ApJ, 509, 212
1998
-
[45]
W., Moskalenko, I.V ., & Ptuskin, V
Strong, A. W., Moskalenko, I.V ., & Ptuskin, V . S. 2007, ARA&A, 57, 285
2007
-
[46]
2010, ApJ724, 1044
Su, M., et al. 2010, ApJ724, 1044
2010
-
[47]
Tachihara, K. et al. 2024, ApJ, 968, 131
2024
-
[49]
G., Hollenbach, D., & McKee, C
Wolfire, M. G., Hollenbach, D., & McKee, C. F. 2010, ApJ, 716, 1191
2010
-
[50]
2006, ApJ, 642, 307
Yamamoto, H., Kawamura, A., Tachihara, K., et al. 2006, ApJ, 642, 307
2006
-
[51]
2014, A&A, 566, 142
Yang, R.-z., et al. 2014, A&A, 566, 142
2014
-
[52]
2004, A&A, 422, 553
Yusifov, I., & Kücük, I. 2004, A&A, 422, 553
2004
-
[53]
Wakker, B. P. 2001, ApJS, 136, 463
2001
-
[54]
E., Hobbs, L
Welty, D. E., Hobbs, L. M., & Penprase, B. E. 1989, ApJ, 346, 232
1989
-
[55]
A., et al
Wilson, B. A., et al. 2005, A&A, 430, 523
2005
Reviewed August 6, 2026 · model on record in the stance chip above.
Discussion (0). Continue with ORCID to comment.