REVIEW 4 major objections 6 minor 63 references
A Method for Rapid Area Prioritisation in Flood Disaster Response
T0 review · 4 major / 6 minor · reviewed 2026-08-06 · deepseek-v4-flash
Pith's one-line read PrioReMap turns a flood polygon into rescue priority zones.
desk verdict The novelty is in the assembly, not the parts, and the unpublished expert CPT is the one thing that has to be fixed before the prioritisation map can be trusted. read the letter →
The pith
A machine-rendered reading of the paper's core claim, the machinery that carries it, and where it could break.
The reading
What carries the argument
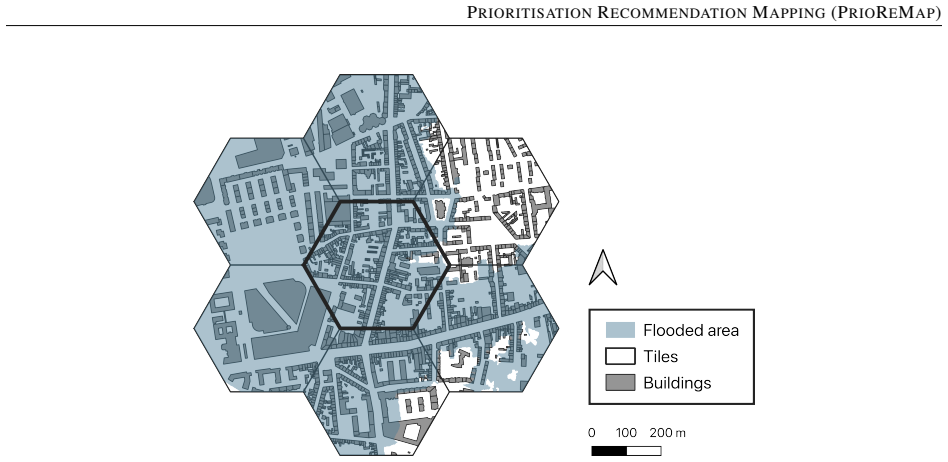
The load-bearing object is the tile-specific Bayesian network whose target node is Risk of People in Need of Assistance, with states None, Low, Medium, and High. Its three direct parents are Density of Exposed Buildings, Presence of Exposed Care Facilities, and Accessibility of Unexposed Areas, where the latter is itself a deterministic combination of Accessibility of Immediate Unexposed Areas and Accessibility of Remote Unexposed Areas. The network is duplicated per hex tile and driven by GIS models: building and care-facility overlays give hard evidence, local flood coverage gives soft evidence for immediate accessibility, and a Dijkstra routing on the flooded road network gives hard evidence for remote accessibility. The engine of the prioritisation is the Probability Distribution Criticality (PDC) score, $PDC=\sum_i w_i P(s_i)$, which folds the entire posterior over the four risk states into a single number; k-means clustering then turns that number into priority classes. All of this is prepared before the flood so that during the event only the flood polygon has to be updated and propagated through the fixed models.
What would settle it
Re-run the Cologne case study with a second set of 96 CPT values elicited from another expert panel under the same three qualitative principles, and compare the High Priority tile sets; a large change in the set indicates the method is not stable to the unstated probabilities. Alternatively, compare the four priority classes against actual rescue-demand records or damage reports from a comparable real flood to see whether the top classes capture where help was really needed.
Extended reading notes
Core claim
The central claim is that area prioritisation in a flood can be reduced to a fixed Bayesian network plus a scalar weighting rule, so that the response phase needs only a new flood layer and no re-modelling. The target node, Risk of People in Need of Assistance, has four states (None, Low, Medium, High) and is influenced by the density of exposed buildings, exposed care facilities, and accessibility of unexposed areas, split into immediate and remote. Each hex tile runs its own copy of the network, with leaf nodes fed by GIS overlays (buildings and care facilities vs. flood extent, local flood coverage as soft evidence, and road-network routing to safe destinations as hard evidence). The posterior distribution is compressed by the Probability Distribution Criticality value, $PDC=\sum_{i=1}^{4} w_i P(s_i)$ with weights $0$, $1/3$, $2/3$, $1$, and k-means clustering assigns tiles to High Priority, Priority, Exposed, or Safe. The discovery, as the paper states it, is that this pipeline delivers transparent, reproducible recommendations without live damage observations.
Load-bearing premise
The 96 probabilities in the conditional probability table for the target node are expert judgement, not data, and the numeric values are not given; if different experts filled in the same qualitative rules, the priority recommendations could change materially.
Editorial extensions
If this is right
- Responders can obtain a recommendation from just a flood-extent polygon, because the GIS models and the network are prebuilt and the only runtime input is the current flood layer.
- Using the full probability distribution means two tiles with the same High-risk probability can still be ranked differently if their remaining probability mass sits in different states, as the paper's motivating example shows for Medium versus Low.
- High-priority areas can appear away from the river's course: the Cologne case study finds a nine-tile high-priority cluster roughly 2.5 km from the Rhine, driven by exposure and accessibility rather than proximity to the channel.
- Three leaf-node constellations produce the High Priority class: an exposed care facility, a high density of exposed buildings, or medium exposed-building density combined with limited immediate and remote accessibility.
- Changing the percentile thresholds for building density or the PDC weights shifts the number of tiles in each class, giving end users a transparent parameter to align the map with their operational preferences.
Reading between the lines
- Because the 96 CPT probabilities are not published and no sensitivity analysis is run, the stability of the priority classes across plausible expert judgements is untested; re-eliciting those numbers would be the natural next experiment.
- The equal-spacing PDC weights treat the gap from None to Low as no more important than the gap from Medium to High; a utility-shaped weighting that penalises High risk disproportionately could change tile rankings, especially near the class boundaries.
- The architecture implies a time-series extension: feeding successive flood snapshots through the prebuilt network would produce priority maps that show how the highest-risk areas move as the flood progresses, and those maps could be validated against actual rescue requests.
- Since remote accessibility is computed on a road network with flooded segments removed, the method will misjudge tiles where flood depth, not just extent, blocks roads; if depth data became available cheaply, both the routing model and the accessibility node would need refinement.
Editorial analysis
A structured set of objections, weighed in public.
Referee Report
Summary. The paper proposes PrioReMap, a decision support method for area prioritisation in flood disaster response. The method combines a GIS-informed Bayesian network (BN) with a state-weighting scheme and clustering to translate the probability distribution of a target node, Risk of People in Need of Assistance, into four prioritisation categories (High Priority, Priority, Exposed, Safe). The BN is constructed in the preparedness phase, and during an event, tile-specific GIS models (exposed building density, exposed care facilities, immediate and remote accessibility) provide evidence to the BN. The prioritisation uses a Probability Distribution Criticality (PDC) value (Eq. 1) that weighs the target-node states, followed by k-means clustering. The method is illustrated on a simulated 500-year flood scenario in Cologne, Germany, using OpenStreetMap and HQ500 flood extent data. The paper's central claim is that PrioReMap provides rapid and transparent recommendations by shifting preparation to the preparedness phase and by presenting a concise output map.
Significance. The paper addresses a real and under-served operational need: rapid, transparent area prioritisation during an ongoing flood, where existing GIS-BN models focus on strategic planning rather than response. The conceptual contribution is valuable, particularly the deliberate separation of preparedness-phase model construction from response-phase recommendation, and the attempt to base recommendations on the whole probability distribution rather than only the most severe state. The method is presented with a detailed, realistic case study that demonstrates the full data processing pipeline, including flood extent, building and care-facility overlays, road accessibility routing, and tile-level BN inference. The authors are transparent about many limitations, including data quality and the static nature of the flood snapshot. However, the evidence provided is not sufficient to establish the central claim of effective prioritisation. The conditional probability table of the target node, which is the load-bearing component of the BN, is not published, and no sensitivity analysis, baseline comparison, or validation against observed outcomes is provided.
major comments (4)
- [§4.1, Fig. 5, Table 2] The CPT of the target node Risk of People in Need of Assistance is described only by qualitative principles (i)–(iii), and the 96 numerical probabilities are not published. Since the PDC in Eq. (1) is a direct weighted sum of the target-node posterior probabilities, every prioritisation recommendation in Fig. 11 is a function of these unstated expert numbers. Two experts who both respect the stated principles could produce materially different CPTs, leading to different recommendations. The deterministic rule (iii) alone forces High whenever an exposed care facility is present, which accounts for 9 of the 32 tiles with P(High)=1 in the case study. This is a reproducibility and robustness gap. I recommend publishing the full CPT as supplementary material and adding a sensitivity analysis that shows how the prioritisation map changes under alternative, plausible CPTs consistent with the stated principles.
- [§5 and §6] The central claim that PrioReMap provides effective area prioritisation is not tested against observed outcomes or compared with simpler baselines. The case study demonstrates that the method produces a map, but it does not show that the map is more accurate, faster, or more useful than, for instance, a direct overlay of the input GIS layers or a simple additive index of building density, care-facility presence, and accessibility. Without such a comparison, or at least a structured evaluation by domain experts, the added value of the BN and the weighting/clustering steps remains unquantified. The discussion claims that the method addresses cognitive load and improves consistency, but no measurements or user study support these claims.
- [§4.3, Eq. (1)] The PDC weighting scheme is presented with fixed weights [0, 0.33, 0.66, 1] with the remark that they 'can easily be adjusted', but no analysis is provided of how the prioritisation classes depend on these weights. The equal-distance assumption is a modelling choice, not a result. Similarly, the number of k-means clusters (three active clusters plus the Safe category) is justified only 'for demonstration purposes'. Since the final categories are the direct output that a responder would act on, the method should either report the stability of the clusters under perturbations of the weights and the cluster count, or provide a principled way to set these parameters.
- [§5.1.1, §4.2] Several GIS thresholds are chosen without clear rationale or sensitivity checks: the 90th and 75th percentile cut-offs for building density, the hexagon tile size (0.114 km²), and the number and placement of routing destination locations. The authors acknowledge that percentile thresholds influence results, but they do not quantify the influence. Given that the case study is the only demonstration of the method, the robustness of the prioritisation map to these parameters should be assessed, for example by varying the percentile thresholds and tile size within reasonable ranges and reporting the resulting changes in the numbers of high-priority and priority tiles.
minor comments (6)
- [Abstract] The phrase 'aims to providing' is a grammatical error; it should be 'aims to provide'.
- [References] The reference for Pearl (1985) appears twice: once correctly as 'Judea Pearl' and once typoed as 'Judea Peal'. The latter should be corrected and merged.
- [Throughout] The paper has several formatting artefacts, e.g. 'A M ETHOD' and 'PR IOREMAP' in the title/header, and inconsistent spacing in equations and captions. These should be cleaned up.
- [§3, Fig. 2b] The caption of Fig. 2b says 'geo-data that is not bound to tight to the boundary of the cell'; the word 'tight' should be removed and the sentence rephrased.
- [§4.1] Table 2 is difficult to read because the column headers are very wide and the table layout is not clear. A transposed layout with node names in the first column and states as separate rows would be more readable.
- [§5.1.1] In the sentence about the Accessibility of Immediate Unexposed Areas, the description of 1713 tiles as 'only partly accessible' is ambiguous because the node is actually representing the percentage of non-flooded area, not a binary accessibility state. Clarify the mapping from this percentage to the soft evidence used in the BN.
Circularity Check
No significant circularity: PrioReMap's recommendations follow transparently from its stated model assumptions, GIS inputs, and Eq. (1); the unpublished CPT is a reproducibility concern, not a circular derivation.
full rationale
The derivation chain is self-contained in the sense required for circularity analysis. The BN target-node distribution is computed from the stated CPT principles (Section 4.1), the four GIS leaf-node models (Section 4.2), and standard BN inference; the recommendations are then a transparent function of the target-node posterior via Eq. (1), PDC = sum_i w_i P(s_i), with fixed weights [0, 0.33, 0.66, 1], followed by k-means clustering of PDC values (Section 4.3). No parameter is fitted to the case-study outcomes and then renamed as a prediction; the percentile thresholds for Density of Exposed Buildings and the CPT rules are declared model inputs, and the paper explicitly notes that threshold choices influence results and can be adjusted. The qualitative CPT principles (i)-(iii) are assumptions, not conclusions derived from the output, so the fact that exposed care facilities force High risk is a stated modelling rule rather than a circular 'finding'. The self-citations (Schneider et al. 2025a,b) do not carry the central claim: the 2025b accessibility model is one input component from a separate publication, and the paper does not invoke any uniqueness theorem or ansatz from that work to justify the overall PrioReMap structure. The paper's own limitation statements (Section 6: 'While this approach introduces threshold-based classifications that certainly influence the results' and 'deriving a single value ... is a sensitive task') are acknowledged robustness concerns; they do not reveal a circular step. The absence of published CPT numbers and of a sensitivity analysis is a real reproducibility and robustness gap, but it is not evidence that any equation or recommendation reduces to its own input by construction.
Assumptions & free parameters
free parameters (6)
- PDC weights =
None=0, Low=0.33, Medium=0.66, High=1
- Building density percentile thresholds =
90th and 75th percentiles
- Tile size (hexagon coverage) =
0.114 km^2 (420m max width)
- Number of k-means clusters =
3
- CPT probabilities =
96 entries, unspecified numerically
- Routing destination locations =
Unspecified multiple locations
assumptions (6)
- standard math Bayesian probability propagation is valid.
- domain assumption Risk of people in need depends on flooded building density, exposed care facilities, and accessibility as encoded in the BN.
- domain assumption Flood extent without depth is a sufficient hazard proxy for rapid response.
- domain assumption OpenStreetMap data are sufficiently accurate and complete for the case study.
- domain assumption The HQ500 simulated flood layer is representative of a rapid-mapping flood extent during an ongoing event.
- ad hoc to paper K-means clustering of PDC values yields meaningful prioritisation classes.
Cite this review
Pith. "Pith review of A Method for Rapid Area Prioritisation in Flood Disaster Response." pith.science (2026). https://pith.science/paper/LEPSMA5O
@misc{pith2026250618423,
  author       = {Pith},
  title        = {Pith review of: A Method for Rapid Area Prioritisation in Flood Disaster Response},
  year         = {2026},
  howpublished = {\url{https://pith.science/paper/LEPSMA5O}},
  note         = {Machine review of arXiv:2506.18423}
}
read the original abstract
In flood disasters, decision-makers have to rapidly prioritise the areas that need assistance based on a high volume of information. While approaches that combine GIS with Bayesian networks are generally effective in integrating multiple spatial variables and can thus reduce cognitive load, existing models in the literature are not equipped to address the time pressure and information-scape that is typical in a flood. To address the lack of a model for area prioritisation in flood disaster response, we present a novel decision support system that adheres to the time and information characteristics of an ongoing flood to infer the areas with the highest risk. This decision support system is based on a novel GIS-informed Bayesian network model that reflects the challenges of decision-making for area prioritisation. By developing the model during the preparedness phase, some of the most time-consuming aspects of the decision-making process are removed from the time-critical response phase. In this way, the proposed method aims to providing rapid and transparent area prioritisation recommendations for disaster response. To illustrate our method, we present a case study of an extreme flood scenario in Cologne, Germany.
Figures


Figures from the paper (9 more)




Reference graph
Works this paper leans on
-
[1]
Collaboration is key: Exploring the 2021 flood response for critical infrastructures in germany
Florence Catherine Nick, Nathalie Sänger, Sophie van der Heijden, and Simone Sandholz. Collaboration is key: Exploring the 2021 flood response for critical infrastructures in germany. International Journal of Disaster Risk Reduction, 91: 0 103710, June 2023. ISSN 2212-4209. doi:10.1016/j.ijdrr.2023.103710
-
[2]
A probabilistic modeling and simulation framework for power grid flood risk assessment
Panagiotis Asaridis, Daniela Molinari, Francesco Di Maio, Francesco Ballio, and Enrico Zio. A probabilistic modeling and simulation framework for power grid flood risk assessment. International Journal of Disaster Risk Reduction, 120: 0 105353, April 2025. ISSN 2212-4209. doi:10.1016/j.ijdrr.2025.105353
-
[3]
Wenchao Qi, Chao Ma, Hongshi Xu, Kai Zhao, and Zifan Chen. A comprehensive analysis method of spatial prioritization for urban flood management based on source tracking. Ecological Indicators, 135: 0 108565, February 2022. ISSN 1470-160X. doi:10.1016/j.ecolind.2022.108565
arXiv 2022
-
[4]
Costas Armenakis and N. Nirupama. Prioritization of disaster risk in a community using gis. Natural Hazards, 66 0 (1): 0 15--29, April 2012. ISSN 1573-0840. doi:10.1007/s11069-012-0167-8
-
[5]
Marc Wieland, Sebastian Schmidt, Bernd Resch, Andreas Abecker, and Sandro Martinis. Fusion of geospatial information from remote sensing and social media to prioritise rapid response actions in case of floods. Natural Hazards, January 2025. ISSN 1573-0840. doi:10.1007/s11069-025-07120-7
-
[6]
Yuwen Lu, Guofang Zhai, and Shutian Zhou. An integrated bayesian networks and geographic information system (bns-gis) approach for flood disaster risk assessment: A case study of yinchuan, china. Ecological Indicators, 166: 0 112322, September 2024. ISSN 1470-160X. doi:10.1016/j.ecolind.2024.112322
-
[7]
Andrea Mentges, Lukas Halekotte, Moritz Schneider, Tobias Demmer, and Daniel Lichte. A resilience glossary shaped by context: Reviewing resilience-related terms for critical infrastructures. International Journal of Disaster Risk Reduction, 96: 0 103893, October 2023. ISSN 2212-4209. doi:10.1016/j.ijdrr.2023.103893
arXiv 2023
-
[8]
Flood hazard mapping methods: A review
Rofiat Bunmi Mudashiru, Nuridah Sabtu, Ismail Abustan, and Waheed Balogun. Flood hazard mapping methods: A review. Journal of Hydrology, 603: 0 126846, December 2021. ISSN 0022-1694. doi:10.1016/j.jhydrol.2021.126846
Show all 63 references
-
[9]
A data-driven approach to analyse the co-evolution of urban systems through a resilience lens: A helsinki case study
Ylenia Casali, Nazli Yonca Aydin, and Tina Comes. A data-driven approach to analyse the co-evolution of urban systems through a resilience lens: A helsinki case study. Environment and Planning B: Urban Analytics and City Science, 51 0 (9): 0 2074--2091, February 2024. ISSN 239...
2024 doi
-
[10]
A systematic review on approaches and methods used for flood vulnerability assessment: framework for future research
Sufia Rehman, Mehebub Sahana, Haoyuan Hong, Haroon Sajjad, and Baharin Bin Ahmed. A systematic review on approaches and methods used for flood vulnerability assessment: framework for future research. Natural Hazards, 96 0 (2): 0 975--998, March 2019. ISSN 1573-0840. doi:10.100...
2019 doi
-
[11]
Emergency response inference mapping (erimap): A bayesian network-based method for dynamic observation processing
Moritz Schneider, Lukas Halekotte, Tina Comes, Daniel Lichte, and Frank Fiedrich. Emergency response inference mapping (erimap): A bayesian network-based method for dynamic observation processing. Reliability Engineering & System Safety, 255: 0 110640, March 2025 a . ISSN 0951...
2025
-
[12]
The rhythm of risk: Exploring spatio-temporal patterns of urban vulnerability with ambulance calls data
Mikhail Sirenko, Tina Comes, and Alexander Verbraeck. The rhythm of risk: Exploring spatio-temporal patterns of urban vulnerability with ambulance calls data. Environment and Planning B: Urban Analytics and City Science, 52 0 (4): 0 863--881, August 2024. ISSN 2399-8091. doi:1...
2024 doi
-
[13]
Improving situation awareness in crisis response teams: An experimental analysis of enriched information and centralized coordination
Bartel Van de Walle, Bert Brugghemans, and Tina Comes. Improving situation awareness in crisis response teams: An experimental analysis of enriched information and centralized coordination. International Journal of Human-Computer Studies, 95: 0 66--79, November 2016. ISSN 1071...
2016 doi
-
[14]
Ai for crisis decisions
Tina Comes. Ai for crisis decisions. Ethics and Information Technology, 26 0 (1), February 2024. ISSN 1572-8439. doi:10.1007/s10676-024-09750-0
2024 doi
-
[15]
Linking urban structure types and bayesian network modelling for an integrated flood risk assessment in data-scarce mega-cities
Veronika Zwirglmaier and Matthias Garschagen. Linking urban structure types and bayesian network modelling for an integrated flood risk assessment in data-scarce mega-cities. Urban Climate, 56: 0 102034, July 2024. ISSN 2212-0955. doi:10.1016/j.uclim.2024.102034
2024
-
[16]
Assessing urban flood disaster risk using bayesian network model and gis applications
Zening Wu, Yanxia Shen, Huiliang Wang, and Meimei Wu. Assessing urban flood disaster risk using bayesian network model and gis applications. Geomatics, Natural Hazards and Risk, 10 0 (1): 0 2163--2184, January 2019. ISSN 1947-5713. doi:10.1080/19475705.2019.1685010
2019
-
[17]
Dependent infrastructure service disruption mapping (disruptionmap): A method to assess cascading service disruptions in disaster scenarios
Moritz Schneider, Lukas Halekotte, Andrea Mentges, and Frank Fiedrich. Dependent infrastructure service disruption mapping (disruptionmap): A method to assess cascading service disruptions in disaster scenarios. Scientific Reports, 15 0 (1), February 2025 b . ISSN 2045-2322. d...
2025 doi
-
[18]
An integrated gis-bbn approach to quantify resilience of roadways network infrastructure system against flood hazard
Mrinal Kanti Sen and Subhrajit Dutta. An integrated gis-bbn approach to quantify resilience of roadways network infrastructure system against flood hazard. ASCE-ASME Journal of Risk and Uncertainty in Engineering Systems, Part A: Civil Engineering, 6 0 (4), December 2020. ISSN...
2020 doi
-
[19]
Where do the numbers come from?
M.J. Druzdzel and L.C. van der Gaag. Building probabilistic networks: " Where do the numbers come from?" guest editors' introduction. IEEE Transactions on Knowledge and Data Engineering, 12 0 (4): 0 481--486, July 2000. ISSN 1558-2191. doi:10.1109/TKDE.2000.868901
-
[20]
Roadmap towards responsible ai in crisis resilience management, 2022
Cheng-Chun Lee, Tina Comes, Megan Finn, and Ali Mostafavi. Roadmap towards responsible ai in crisis resilience management, 2022
2022
-
[21]
Bayesian networks: A model of self-activated memory for evidential reasoning
Judea Pearl. Bayesian networks: A model of self-activated memory for evidential reasoning. In Proceedings of the 7th conference of the Cognitive Science Society, University of California, Irvine, CA, USA, pages 15--17, June 1985
1985
-
[22]
A dynamic emergency decision-making method based on group decision making with uncertainty information
Jing Zheng, Yingming Wang, Kai Zhang, and Juan Liang. A dynamic emergency decision-making method based on group decision making with uncertainty information. International Journal of Disaster Risk Science, 11 0 (5): 0 667--679, October 2020. ISSN 2192-6395. doi:10.1007/s13753-...
2020 doi
-
[23]
Integrated bayesian networks with gis for electric vehicles charging site selection
Yan Zhang, Bak Koon Teoh, and Limao Zhang. Integrated bayesian networks with gis for electric vehicles charging site selection. Journal of Cleaner Production, 344: 0 131049, April 2022. ISSN 0959-6526. doi:10.1016/j.jclepro.2022.131049
2022
-
[24]
Stewart, Oz Sahin, and Abel Silva Vieira
Shahid Ali, Rodney A. Stewart, Oz Sahin, and Abel Silva Vieira. Spatial bayesian approach for socio-economic assessment of pumped hydro storage. Renewable and Sustainable Energy Reviews, 189: 0 114007, January 2024. ISSN 1364-0321. doi:10.1016/j.rser.2023.114007
2024
-
[25]
A bayesian network model for suitability evaluation of underground space development in urban areas: The case of changsha, china
Zhiwen Xu, Suhua Zhou, Chao Zhang, Minghui Yang, and Mingyi Jiang. A bayesian network model for suitability evaluation of underground space development in urban areas: The case of changsha, china. Journal of Cleaner Production, 418: 0 138135, September 2023. ISSN 0959-6526. do...
2023
-
[26]
Spatial bayesian belief networks as a planning decision tool for mapping ecosystem services trade-offs on forested landscapes
Julen Gonzalez-Redin, Sandra Luque, Laura Poggio, Ron Smith, and Alessandro Gimona. Spatial bayesian belief networks as a planning decision tool for mapping ecosystem services trade-offs on forested landscapes. Environmental Research, 144: 0 15--26, January 2016. ISSN 0013-935...
2016 doi
-
[27]
Application of bayesian networks for fire risk mapping using gis and remote sensing data
Wisdom Mdumiseni Dlamini. Application of bayesian networks for fire risk mapping using gis and remote sensing data. GeoJournal, 76 0 (3): 0 283--296, May 2010. ISSN 1572-9893. doi:10.1007/s10708-010-9362-x
2010 doi
-
[28]
Grêt-Regamey and D
A. Grêt-Regamey and D. Straub. Spatially explicit avalanche risk assessment linking bayesian networks to a gis. Natural Hazards and Earth System Sciences, 6 0 (6): 0 911--926, October 2006. ISSN 1684-9981. doi:10.5194/nhess-6-911-2006
2006 doi
-
[29]
A spatial bayesian-network approach as a decision-making tool for ecological-risk prevention in land ecosystems
Kai Guo, Xinchang Zhang, Xi Kuai, Zhifeng Wu, Yiyun Chen, and Yi Liu. A spatial bayesian-network approach as a decision-making tool for ecological-risk prevention in land ecosystems. Ecological Modelling, 419: 0 108929, March 2020. ISSN 0304-3800. doi:10.1016/j.ecolmodel.2019.108929
2020
-
[30]
Sousa, and José C
Erica Arango, Monica Santamaria, Maria Nogal, Hélder S. Sousa, and José C. Matos. Flood risk assessment for road infrastructures using bayesian networks: case study of santarem - portugal. Acta Polytechnica CTU Proceedings, 36: 0 33--46, August 2022. ISSN 2336-5382. doi:10.143...
2022 doi
-
[31]
Key disaster-causing factors chains on urban flood risk based on bayesian network
Shanqing Huang, Huimin Wang, Yejun Xu, Jingwen She, and Jing Huang. Key disaster-causing factors chains on urban flood risk based on bayesian network. Land, 10 0 (2): 0 210, February 2021. ISSN 2073-445X. doi:10.3390/land10020210
2021 doi
-
[32]
A spatial bayesian network model to assess the benefits of early warning for urban flood risk to people
Stefano Balbi, Ferdinando Villa, Vahid Mojtahed, Karin Tessa Hegetschweiler, and Carlo Giupponi. A spatial bayesian network model to assess the benefits of early warning for urban flood risk to people. Natural Hazards and Earth System Sciences, 16 0 (6): 0 1323--1337, June 201...
2016 doi
-
[33]
Identification of issues in disaster response to flooding, focusing on the time continuity between residents’ evacuation and rescue activities
Akira Matsuki and Michinori Hatayama. Identification of issues in disaster response to flooding, focusing on the time continuity between residents’ evacuation and rescue activities. International Journal of Disaster Risk Reduction, 95: 0 103841, September 2023. ISSN 2212-4209....
2023
-
[34]
Identifying decision support needs for emergency response to multiple natural hazards: an activity theory approach
Viktor Sköld Gustafsson, Tobias Andersson Granberg, Sofie Pilemalm, and Martin Waldemarsson. Identifying decision support needs for emergency response to multiple natural hazards: an activity theory approach. Natural Hazards, 120 0 (3): 0 2777--2802, November 2023. ISSN 1573-0...
2023 doi
-
[35]
Generating conditional probabilities for bayesian networks: Easing the knowledge acquisition problem, 2008
Balaram Das. Generating conditional probabilities for bayesian networks: Easing the knowledge acquisition problem, 2008
2008
-
[36]
Open and consistent geospatial data on population density, built-up and settlements to analyse human presence, societal impact and sustainability: A review of ghsl applications
Daniele Ehrlich, Sergio Freire, Michele Melchiorri, and Thomas Kemper. Open and consistent geospatial data on population density, built-up and settlements to analyse human presence, societal impact and sustainability: A review of ghsl applications. Sustainability, 13 0 (14): 0...
2021 doi
-
[37]
Yared Abayneh Abebe, Maria Pregnolato, and Sebastiaan N. Jonkman. Flood impacts on healthcare facilities and disaster preparedness – a systematic review. International Journal of Disaster Risk Reduction, 119: 0 105340, March 2025. ISSN 2212-4209. doi:10.1016/j.ijdrr.2025.105340
2025
-
[38]
An integrated metric for rapid and equitable emergency rescue during urban flash flooding events
Yitong Li, Yifan Wang, and Jie Gong. An integrated metric for rapid and equitable emergency rescue during urban flash flooding events. International Journal of Disaster Risk Reduction, 118: 0 105209, February 2025. ISSN 2212-4209. doi:10.1016/j.ijdrr.2025.105209
2025
-
[39]
Hexagonal discrete global grid systems for geospatial computing
Kevin Sahr. Hexagonal discrete global grid systems for geospatial computing. Archiwum Fotogrametrii, Kartografii i Teledetekcji, 22: 0 363--376, 2011
2011
-
[40]
Detection and mapping of the geomorphic effects of flooding using uav photogrammetry
Jakub Langhammer and Tereza Vacková. Detection and mapping of the geomorphic effects of flooding using uav photogrammetry. Pure and Applied Geophysics, 175 0 (9): 0 3223--3245, April 2018. ISSN 1420-9136. doi:10.1007/s00024-018-1874-1
2018 doi
-
[41]
Jacobs, Chloe M
Ramesh Sivanpillai, Kevin M. Jacobs, Chloe M. Mattilio, and Ela V. Piskorski. Rapid flood inundation mapping by differencing water indices from pre- and post-flood landsat images. Frontiers of Earth Science, 15 0 (1): 0 1--11, April 2020. ISSN 2095-0209. doi:10.1007/s11707-020-0818-0
2020 doi
-
[42]
Rapid mapping in support of emergency response after earthquake events
Stephanie Wegscheider, Tobias Schneiderhan, Alexander Mager, Hendrik Zwenzner, Joachim Post, and Günter Strunz. Rapid mapping in support of emergency response after earthquake events. Natural Hazards, 68 0 (1): 0 181--195, July 2013. ISSN 1573-0840. doi:10.1007/s11069-013-0589-y
2013 doi
-
[43]
Evaluating the robustness of bayesian flood mapping with sentinel-1 data: A multi-event validation study
Florian Roth, Mark Edwin Tupas, Claudio Navacchi, Jie Zhao, Wolfgang Wagner, and Bernhard Bauer-Marschallinger. Evaluating the robustness of bayesian flood mapping with sentinel-1 data: A multi-event validation study. Science of Remote Sensing, 11: 0 100210, June 2025. ISSN 26...
2025
-
[44]
Naser Lessani, and Zhenlong Li
Temitope Akinboyewa, Huan Ning, M. Naser Lessani, and Zhenlong Li. Automated floodwater depth estimation using large multimodal model for rapid flood mapping. Computational Urban Science, 4 0 (1), May 2024. ISSN 2730-6852. doi:10.1007/s43762-024-00123-3
2024 doi
-
[45]
Planet dump retrieved from https://planet.osm.org
OpenStreetMap contributors . Planet dump retrieved from https://planet.osm.org . https://www.openstreetmap.org , 2017
2017
-
[46]
High-resolution flood numerical model and dijkstra algorithm based risk avoidance routes planning
Bingyao Li, Jingming Hou, Xinghua Wang, Yongyong Ma, Donglai Li, Tian Wang, and Guangzhao Chen. High-resolution flood numerical model and dijkstra algorithm based risk avoidance routes planning. Water Resources Management, 37 0 (8): 0 3243--3258, April 2023. ISSN 1573-1650. do...
2023 doi
-
[47]
Utkarsh Gangwal, A. R. Siders, Jennifer Horney, Holly A. Michael, and Shangjia Dong. Critical facility accessibility and road criticality assessment considering flood-induced partial failure. Sustainable and Resilient Infrastructure, 8 0 (sup1): 0 337--355, November 2022. ISSN...
2022
-
[48]
Aspects of the January 1995 flood in Germany
Andreas Fink, Uwe Ulbrich, and Heinz Engel. Aspects of the January 1995 flood in Germany . Weather, 51 0 (2): 0 34--39, February 1996. ISSN 1477-8696. doi:10.1002/j.1477-8696.1996.tb06182.x
1995
-
[49]
assessment of economic flood damage
B. Merz, H. Kreibich, R. Schwarze, and A. Thieken. Review article "assessment of economic flood damage". Natural Hazards and Earth System Sciences, 10 0 (8): 0 1697--1724, August 2010. ISSN 1684-9981. doi:10.5194/nhess-10-1697-2010
2010 doi
-
[50]
Spontaneous volunteers and the flood disaster 2021 in germany: Development of social innovations in flood risk management
Marina Bier, Ramian Fathi, Christiane Stephan, Anke Kahl, Frank Fiedrich, and Alexander Fekete. Spontaneous volunteers and the flood disaster 2021 in germany: Development of social innovations in flood risk management. Journal of Flood Risk Management, July 2023. ISSN 1753-318...
2021 doi
-
[51]
Francesca Müller, Marina Bier, Samuel Tomczyk, Anke Kahl, and Frank Fiedrich. The issue of overload: A mixed methods analysis of activity-related stress and the use of mental health and psychosocial support by spontaneous volunteers during the 2021 flood in germany. Internatio...
2021
-
[52]
INSPIRE Dataset Feed: Flood risk map Layer NRW - Low probability (HQ500) , [accessed 09.04.2024]
State Agency for Nature, Environment and Consumer Protection of North Rhine-Westphalia . INSPIRE Dataset Feed: Flood risk map Layer NRW - Low probability (HQ500) , [accessed 09.04.2024]. URL https://www.gis-rest.nrw.de/atomFeed/rest/atom/182925c1-879f-4054-bd69-b6f28e05b270.html
2024
-
[53]
Critical infrastructure cascading effects
Alexander Fekete. Critical infrastructure cascading effects. Disaster resilience assessment for floods affecting city of Cologne and Rhein - Erft - Kreis . Journal of Flood Risk Management, 13 0 (2): 0 e312600, 2020. ISSN 1753-318X. doi:10.1111/jfr3.12600
2020 doi
-
[54]
Alta de Waal and Johan W. Joubert. Explainable Bayesian networks applied to transport vulnerability. Expert Systems with Applications, 209: 0 118348, December 2022. ISSN 0957-4174. doi:10.1016/j.eswa.2022.118348
2022
-
[55]
Hassall, Gordon Dailey, Joanna Zawadzka, Alice E
Kirsty L. Hassall, Gordon Dailey, Joanna Zawadzka, Alice E. Milne, Jim A. Harris, Ron Corstanje, and Andrew P. Whitmore. Facilitating the elicitation of beliefs for use in Bayesian Belief modelling. Environmental Modelling & Software, 122: 0 104539, December 2019. ISSN 1364-81...
2019
-
[56]
Morris, Jeremy E
David E. Morris, Jeremy E. Oakley, and John A. Crowe. A web-based tool for eliciting probability distributions from experts. Environmental Modelling and Software, 52: 0 1--4, February 2014. doi:10.1016/j.envsoft.2013.10.010
2014 doi
-
[57]
Bayesian networks: A model of self-activated memory for evidential reasoning
Judea Peal. Bayesian networks: A model of self-activated memory for evidential reasoning. In Proceedings of the Annual Meeting of the Cognitive Science Society, volume 7, 1985
1985
-
[58]
Do we practice what we preach? the dissonance between resilience understanding and measurement
Lukas Halekotte, Andrea Mentges, and Daniel Lichte. Do we practice what we preach? the dissonance between resilience understanding and measurement. International Journal of Disaster Risk Reduction, 118: 0 105265, February 2025. ISSN 2212-4209. doi:10.1016/j.ijdrr.2025.105265
2025
-
[59]
Systematic literature review of data quality within openstreetmap
Jasmeet Kaur, Jaiteg Singh, Sukhjit Singh Sehra, and Hardeep Singh Rai. Systematic literature review of data quality within openstreetmap. In 2017 International Conference on Next Generation Computing and Information Systems (ICNGCIS), pages 177--182. IEEE, December 2017. doi:...
2017 doi
-
[60]
A new method for the assessment of spatial accuracy and completeness of openstreetmap building footprints
Maria Antonia Brovelli and Giorgio Zamboni. A new method for the assessment of spatial accuracy and completeness of openstreetmap building footprints. ISPRS International Journal of Geo-Information, 7 0 (8): 0 289, July 2018. ISSN 2220-9964. doi:10.3390/ijgi7080289
2018 doi
-
[61]
Quality of crowdsourced geospatial building information: A global assessment of openstreetmap attributes
Filip Biljecki, Yoong Shin Chow, and Kay Lee. Quality of crowdsourced geospatial building information: A global assessment of openstreetmap attributes. Building and Environment, 237: 0 110295, June 2023. ISSN 0360-1323. doi:10.1016/j.buildenv.2023.110295
2023
-
[62]
Recommended practice: Flood mapping and damage assessment using sentinel-2 (s2) optical data, 2025
UN-SPIDER . Recommended practice: Flood mapping and damage assessment using sentinel-2 (s2) optical data, 2025. URL https://www.un-spider.org/advisory-support/recommended-practices/recommended-practice-flood-mapping-and-damage-assessment. Accessed: 2025-04-29
2025
-
[63]
INSARAG Guidelines Volume II, Manual B: Operations
UN-OCHA. INSARAG Guidelines Volume II, Manual B: Operations. United Nations Office for the Coordination of Humanitarian Affairs, Geneva, Switzerland, 2020. URL https://www.insarag.org
2020
Reviewed August 6, 2026 · model on record in the stance chip above.
Discussion (0). Continue with ORCID to comment.