REVIEW 4 major objections 6 minor 55 references
An Ejection Event Captured by VLBI During the Outburst of Swift J1727.8$-$1613
T0 review · 4 major / 6 minor · reviewed 2026-08-06 · deepseek-v4-flash
Pith's one-line read A six-hour VLBI observation caught the radio flare of black hole binary Swift J1727.8–1613 as plasma ejected at about 0.6c.
desk verdict Solid EVN observation of a bright Galactic BH transient, but the ejection speed and event claim rest on a hand-tuned model rather than a quantitative fit. read the letter →
The pith
A machine-rendered reading of the paper's core claim, the machinery that carries it, and where it could break.
The reading
What carries the argument
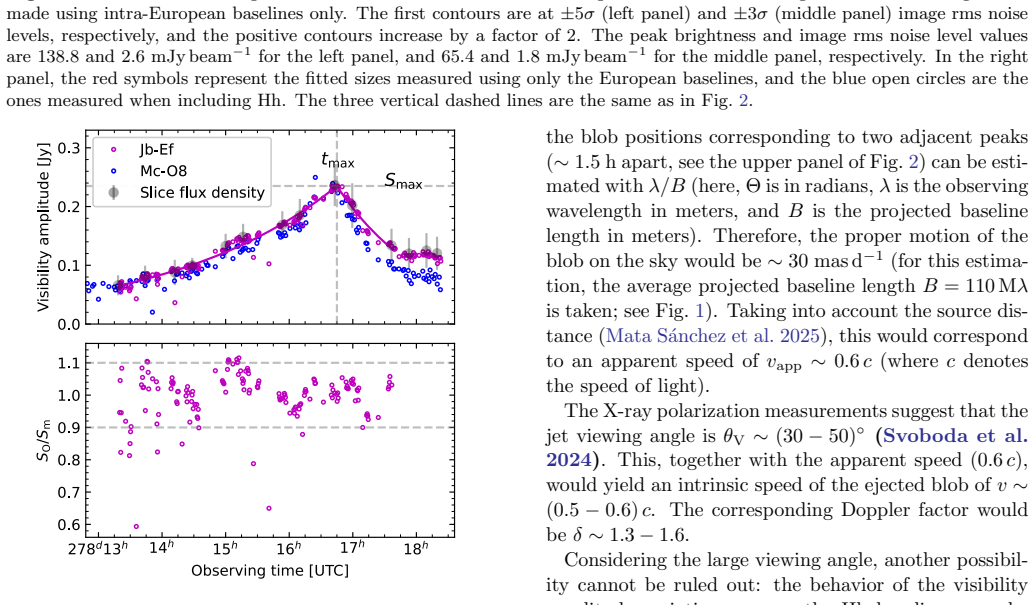
The load-bearing tool is the visibility amplitude versus time curve on the long Europe-to-South Africa baselines, where a moving blob crossing the fringe pattern produces periodic peaks separated by the fringe spacing lambda/B. The authors use the van Cittert–Zernike theorem to simulate the amplitude evolution for a two-component model (stationary core plus moving blob, or two symmetric blobs), and they fit a broken exponential to the short-baseline amplitude to extract rise and fall timescales. The oscillation period on the long baselines gives the proper motion; the final-hour linear increase of the fitted circular-Gaussian size gives the expansion speed. The apparent speed then converts to intrinsic speed and Doppler factor using the independently estimated viewing angle.
What would settle it
A second VLBI observation one or two days later that resolves the source into two components moving apart at a constant speed of about 30 mas per day would confirm the ejection; conversely, if the amplitude oscillation pattern is not reproduced with denser (u,v) coverage, or if a later epoch shows no steadily moving offset to the south, the ejection interpretation would be weakened.
Extended reading notes
Core claim
The central claim is that the radio flare observed with very long baseline interferometry on 2023 October 5 was an ejection event rather than intrinsic variability of the radio core. Two configurations fit the data: a stationary core plus one blob moving south, or two blobs moving symmetrically in opposite directions. In both cases the initial angular separation speed of the components is about 30 mas per day, corresponding to an apparent speed of about 0.6c given the 3.4 kpc distance. The paper finds that a model where the moving component's flux density rises and falls according to a broken exponential and the component separates at constant speed reproduces the observed oscillation on long baselines, while the final-hour linear expansion of the fitted Gaussian size indicates the size is dominated by component separation. It concludes that the ejection took place in the hard-intermediate state just after a radio quenching event, and that the source was in the rising phase of a larger four-day flare, so such ejections were frequent.
Load-bearing premise
The claim rests on attributing the oscillating visibility amplitudes on the long baselines to a compact blob moving across the interferometer fringes (or two symmetric blobs separating); if the oscillations came from intrinsic flux variability or a changing core structure, the derived proper motion and the ejection event would not follow.
Editorial extensions
If this is right
- If ejection events were as frequent as this observation implies, single-epoch or daily-cadence radio monitoring will underestimate time-averaged jet power; continuous monitoring is needed.
- The radio quenching leading the hard X-ray decline by roughly half a day places the disturbance near the inner edge of the hot accretion disk.
- The disappearance of the type-C quasi-periodic oscillation and the drop in fractional rms just before the ejection strengthen the link between state transitions and transient jet ejections in black hole X-ray binaries.
- The blob kinetic power of about 10^33 erg per second is orders of magnitude below the accretion power of about 10^39 erg per second, ruling out the jet as a major energy sink in this system.
Reading between the lines
- Editorial extension: The one-blob and two-blob scenarios are degenerate in visibility amplitude alone; future dual-frequency or polarimetric VLBI could break the degeneracy because the receding blob's flux ratio depends on spectral index and viewing angle.
- Editorial extension: If the fitted-size oscillation reflects interference between two components rather than jet wobbling, the same technique could be applied to other bright X-ray binaries to detect ejections that imaging would miss.
- Editorial extension: The paper's inference that the final-hour size expansion is dominated by component separation is directly testable by fitting two Gaussian components to the last few data slices rather than a single Gaussian.
Editorial analysis
A structured set of objections, weighed in public.
Referee Report
Summary. The paper presents 5 GHz EVN observations of the Galactic black hole X-ray binary Swift J1727.8-1613 obtained during a 6-hour window immediately after a radio quenching event. The visibility amplitudes show a large flare, with oscillations on the long European-to-Hartebeesthoek baselines. The authors interpret these oscillations as evidence for an ejection event: either a single blob moving south from a stationary core or two symmetric blobs moving apart, with an initial angular separation speed of about 30 mas/d, corresponding to an apparent speed of about 0.6c. They fit single circular Gaussian models to 14 time slices, report an apparent linear size expansion in the final hour, estimate blob energetics using the Fender and Bright (2019) formalism, and discuss the relation to simultaneous X-ray monitoring. The paper concludes that ejection events were frequent during the larger 4-day radio flare and that continuous radio monitoring is needed to estimate jet power correctly.
Significance. If the ejection interpretation is correct, this is a valuable short-timescale VLBI measurement of jet ejection in a bright Galactic X-ray binary, complementing the longer-term VLBI monitoring of Wood et al. (2024, 2025). The paper is careful in its data reduction, checks the calibrator stability, and provides slice-by-slice model fits with error estimates. The multi-wavelength context, including the simultaneous X-ray data and the timing relative to the VLA quenching, is useful. However, the central claim that the visibility oscillations constitute a moving blob (or two blobs) is not quantitatively established: the proper-motion estimate lacks uncertainties, the simulation is a hand-tuned consistency check rather than a fit, and no alternative no-motion model is tested. The derived speeds, Doppler factors, and energetics are all conditional on this interpretation.
major comments (4)
- [Section 4.1, Fig. 2]
- [Section 4.2, Figs. 5 and 6]
- [Section 3 and Table 1]
- [Section 4.1, energetics paragraph]
minor comments (6)
- [Abstract and Section 5] The abstract states that the data are 'consistent with an ejection event' and Section 5 says it is 'inferred to be caused by an ejection event.' Given the model degeneracy discussed in Section 4, I recommend softening these statements to 'can be interpreted as an ejection event' or 'is consistent with, but does not uniquely require, an ejection event.'
- [Section 4.1, paragraph on jet acceleration] The sentence 'However, if the jet did undergo acceleration. The minor flare could instead be attributed to an internal shock...' is incomplete and should be rewritten into a grammatically complete conditional statement.
- [Figure 2 caption] The caption states that only one IF (IF 5 at 4.927 GHz) and the baselines to Ef are shown, with data averaged over every 15 visibilities. Please clarify whether the plotted 'Hh baselines' are only Ef-Hh or an average over all European-Hh baselines, and specify the time averaging in the caption itself. A version showing multiple IFs and baselines would help demonstrate that the oscillation is not frequency- or baseline-specific.
- [Section 4.2, simulation start time] The simulation begins at the inferred ejection time of 12:15, which is before the start of the EVN observation at 12:30 and before the first data point used in the analysis. Please state the sensitivity of the simulated visibility curves to the assumed ejection time, especially because the first observed peak is described as tentative.
- [Table 1 and Table 2 notes] The notes state that when the fitted angular size is smaller than the resolution limit, the limit is used as an upper limit. Please state the numerical value of the resolution limit used for the European-only and European-plus-Hh arrays, so that the upper limits in Tables 1 and 2 can be interpreted.
- [Section 4.3, jet power underestimation] The statement that jet power 'may be (severely) underestimated' when monitoring is infrequent is qualitative. Please provide a quantitative illustration, for example a comparison of the flare amplitude and timescale seen by EVN with what a daily-cadence monitoring campaign would have measured.
Circularity Check
No significant circularity; the ejection interpretation is model-dependent, but no derived quantity is defined in terms of an assumed input or reduced to a self-citation.
full rationale
The paper's central claim is an interpretation of observed Hh-baseline visibility-amplitude oscillations as fringe crossings of a moving blob or symmetrically separating blobs. The 30 mas/d proper motion is estimated directly from the observed ~1.5 h peak spacing and the standard relation lambda/B in Section 4.1, not from a fitted parameter of the model. The broken-exponential light-curve parameters in Eq. 1 are fitted to the short Jb-Ef baseline and then used as inputs to the forward simulation in Section 4.2, but the simulation is explicitly presented as a consistency check ('simulation indicates that the one-blob scenario is viable'), not as an independent derivation of the speed. External inputs such as the distance (Mata Sanchez et al. 2025), the viewing angle (Svoboda et al. 2024), and previous VLBI proper motions of the same source (Wood et al. 2024, 2025) are independent published measurements, not outputs of this paper's model. The paper includes explicit caveats that the simple model fits cannot represent the real structure due to missing intermediate baselines, and that alternative explanations (intrinsic flux variability, changing component flux ratios) are not uniquely excluded; these are limitations on the strength of the physical interpretation, not circular reasoning. No equation in the paper reduces to a previously assumed result by construction, and no fitted quantity is renamed as a prediction. The derivation chain is therefore not circular.
Assumptions & free parameters
free parameters (5)
- Flare peak flux Smax =
235 mJy
- Flare peak time tmax =
16:45 UTC
- Rise timescale tau_rise =
0.112 +/- 0.001 days
- Fall timescale tau_fall =
0.059 +/- 0.002 days
- Simulation component fluxes and FWHMs =
varied (e.g., 40 mJy and 0.5 mas, 15 mJy and 1.0 mas, etc.)
assumptions (5)
- domain assumption The source distance is 3.4 +/- 0.3 kpc (Mata Sanchez et al. 2025).
- domain assumption The jet viewing angle is 30-50 degrees (Svoboda et al. 2024).
- domain assumption The jet is oriented north-south on the sky.
- domain assumption The Fender and Bright (2019) parameterization of blob energetics is valid for this source.
- ad hoc to paper The visibility amplitude oscillations on the Hartebeesthoek baselines are caused by a moving blob or symmetric blobs, not by other variability.
Cite this review
Pith. "Pith review of An Ejection Event Captured by VLBI During the Outburst of Swift J1727.8$-$1613." pith.science (2026). https://pith.science/paper/N7Q6JV5E
@misc{pith2026250618817,
  author       = {Pith},
  title        = {Pith review of: An Ejection Event Captured by VLBI During the Outburst of Swift J1727.8$-$1613},
  year         = {2026},
  howpublished = {\url{https://pith.science/paper/N7Q6JV5E}},
  note         = {Machine review of arXiv:2506.18817}
}
abstract
We observed a newly-discovered Galactic black hole X-ray binary Swift J1727.8$-$1613 with the European Very Long Baseline Interferometry Network (EVN) at 5 GHz. The observation was conducted immediately following a radio quenching event detected by the Karl G. Jansky Very Large Array (VLA). The visibility amplitude evolution over time reveals a large-amplitude radio flare and is consistent with an ejection event. The data can be interpreted either as a stationary component (i.e., the radio core) and a moving blob, or as two blobs moving away from the core symmetrically in opposite directions. The initial angular separation speed of the two components was estimated to 30 mas d^{-1}. We respectively fitted a single circular Gaussian model component to each of 14 sliced visibility datasets. For the case of including only European baselines, during the final hour of the EVN observation, the fitted sizes exhibited linear expansion, indicating that the measured sizes were dominated by the angular separation of the two components. The 6-h EVN observation took place in a rising phase of an even larger 4-day-long radio flare, implying that the ejection events were quite frequent and therefore continuous radio monitoring is necessary to correctly estimate the power of the transient jet. Combined with X-ray monitoring data, the radio quenching and subsequent flares/ejections were likely driven by instabilities in the inner hot accretion disk.
Figures


Figures from the paper (4 more)


Reference graph
Works this paper leans on
-
[1]
The angular sizes are shown in Fig
T able 2.The source parameters of Swift J1727.8−1613 with European and Hh antennas Slice Time [d]S ν [mJy]θ[mas] Slice Time [d]S ν [mJy]θ[mas] 1 0.55451 66±16 0.90±0.15 8 0.67361 186±28 1.12±0.10 2 0.57222 81±18 0.83±0.12 9 0.69652 233±37 1.07±0.10 3 0.59166 85±24 1.10±0.21 10 0.70798 200±39 0.95±0.12 4 0.60312 100±13 1.11±0.07 11 0.73368 127±31 1.00±0.17...
work page 2023
-
[2]
2023, A&A, 675, A199, doi: 10.1051/0004-6361/202346522
Avakyan, A., Neumann, M., Zainab, A., et al. 2023, A&A, 675, A199, doi: 10.1051/0004-6361/202346522
-
[3]
J., & Conway, J
Beasley, A. J., & Conway, J. E. 1995, in Astronomical Society of the Pacific Conference Series, Vol. 82, Very Long Baseline Interferometry and the VLBA, ed. J. A
1995
-
[4]
Belloni, T. M., & Motta, S. E. 2016, in Astrophysics and Space Science Library, Vol. 440, Astrophysics of Black Holes: From Fundamental Aspects to Latest Developments, ed. C. Bambi, 61, doi: 10.1007/978-3-662-52859-4 2
-
[5]
2023, The Astronomer’s Telegram, 16273, 1
Bollemeijer, N., Uttley, P., Buisson, D., et al. 2023, The Astronomer’s Telegram, 16273, 1
work page 2023
-
[6]
Bright, J. S., Fender, R. P., Motta, S. E., et al. 2020, Nature Astronomy, 4, 697, doi: 10.1038/s41550-020-1023-5
-
[7]
Burridge, B. J., Miller-Jones, J. C. A., Bahramian, A., et al. 2025, arXiv e-prints, arXiv:2502.06448, doi: 10.48550/arXiv.2502.06448
-
[8]
2021, MNRAS, 504, 444, doi: 10.1093/mnras/stab864 12
Carotenuto, F., Corbel, S., Tremou, E., et al. 2021, MNRAS, 504, 444, doi: 10.1093/mnras/stab864 12
Show all 55 references
-
[9]
D., et al
Caballero-Garcia, M. D., et al. 2023, The Astronomer’s Telegram, 16208, 1
2023
-
[10]
M., Casares, J., Mu˜ noz-Darias, T., et al
Corral-Santana, J. M., Casares, J., Mu˜ noz-Darias, T., et al. 2016, A&A, 587, A61, doi: 10.1051/0004-6361/201527130
2016 doi
-
[11]
M., Lightman, A
Eardley, D. M., Lightman, A. P., & Shapiro, S. L. 1975, ApJL, 199, L153, doi: 10.1086/181871
1975 doi
-
[12]
2017, MNRAS, 471, 2703, doi: 10.1093/mnras/stx1730
Egron, E., Pellizzoni, A., Giroletti, M., et al. 2017, MNRAS, 471, 2703, doi: 10.1093/mnras/stx1730
2017 doi
- [13]
-
[14]
2019, MNRAS, 489, 4836, doi: 10.1093/mnras/stz2000
Fender, R., & Bright, J. 2019, MNRAS, 489, 4836, doi: 10.1093/mnras/stz2000
2019 doi
-
[15]
P., Belloni, T
Fender, R. P., Belloni, T. M., & Gallo, E. 2004, MNRAS, 355, 1105, doi: 10.1111/j.1365-2966.2004.08384.x
2004
-
[16]
P., Homan, J., & Belloni, T
Fender, R. P., Homan, J., & Belloni, T. M. 2009, MNRAS, 396, 1370, doi: 10.1111/j.1365-2966.2009.14841.x
2009
-
[17]
Greisen, E. W. 2003, in Astrophysics and Space Science
2003
-
[18]
285, Information Handling in Astronomy - Historical Vistas, ed
Library, Vol. 285, Information Handling in Astronomy - Historical Vistas, ed. A. Heck, 109, doi: 10.1007/0-306-48080-8 7
-
[19]
2005, Ap&SS, 300, 107, doi: 10.1007/s10509-005-1197-4
Homan, J., & Belloni, T. 2005, Ap&SS, 300, 107, doi: 10.1007/s10509-005-1197-4
2005 doi
-
[20]
1977, ApJ, 214, 840, doi: 10.1086/155314
Ichimaru, S. 1977, ApJ, 214, 840, doi: 10.1086/155314
1977 doi
-
[21]
2024, ApJ, 968, 76, doi: 10.3847/1538-4357/ad3faf
Ingram, A., Bollemeijer, N., Veledina, A., et al. 2024, ApJ, 968, 76, doi: 10.3847/1538-4357/ad3faf
2024 doi
-
[22]
R., & Motta, S
Ingram, A. R., & Motta, S. E. 2019, NewAR, 85, 101524, doi: 10.1016/j.newar.2020.101524
2019
-
[23]
M., Pogrebenko, S
Keimpema, A., Kettenis, M. M., Pogrebenko, S. V., et al. 2015, Experimental Astronomy, 39, 259, doi: 10.1007/s10686-015-9446-1
2015 doi
-
[24]
A., & Swift Team
Kennea, J. A., & Swift Team. 2023, GRB Coordinates Network, 34540, 1
2023
-
[25]
Y., Kellermann, K
Kovalev, Y. Y., Kellermann, K. I., Lister, M. L., et al. 2005, AJ, 130, 2473, doi: 10.1086/497430
2005 doi
-
[26]
P., Veledina, A., et al
Kravtsov, V., Nitindala, A. P., Veledina, A., et al. 2023, The Astronomer’s Telegram, 16245, 1
2023
-
[27]
P., Krichbaum, T
Lee, S.-S., Lobanov, A. P., Krichbaum, T. P., et al. 2008, AJ, 136, 159, doi: 10.1088/0004-6256/136/1/159
2008 doi
- [28]
-
[29]
Longair, M. S. 2011, High Energy Astrophysics Mata S´ anchez, D., Torres, M. A. P., Casares, J., et al. 2025, A&A, 693, A129, doi: 10.1051/0004-6361/202451960
2011 doi
-
[30]
2009, PASJ, 61, 999, doi: 10.1093/pasj/61.5.999
Matsuoka, M., Kawasaki, K., Ueno, S., et al. 2009, PASJ, 61, 999, doi: 10.1093/pasj/61.5.999
2009 doi
-
[31]
Miller-Jones, J. C. A., Blundell, K. M., & Duffy, P. 2004, ApJL, 603, L21, doi: 10.1086/382954
2004 doi
-
[32]
Miller-Jones, J. C. A., Sivakoff, G. R., Altamirano, D., et al. 2012, MNRAS, 421, 468, doi: 10.1111/j.1365-2966.2011.20326.x
2012
-
[33]
Miller-Jones, J. C. A., Tetarenko, A. J., Sivakoff, G. R., et al. 2019, Nature, 569, 374, doi: 10.1038/s41586-019-1152-0
2019 doi
-
[34]
E., Rodriguez, J., Jourdain, E., et al
Motta, S. E., Rodriguez, J., Jourdain, E., et al. 2021, NewAR, 93, 101618, doi: 10.1016/j.newar.2021.101618
2021
-
[35]
2023, The Astronomer’s Telegram, 16206, 1
Nakajima, M., Negoro, H., Serino, M., et al. 2023, The Astronomer’s Telegram, 16206, 1
2023
-
[36]
2023, The Astronomer’s Telegram, 16205, 1
Negoro, H., Serino, M., Nakajima, M., et al. 2023, The Astronomer’s Telegram, 16205, 1
2023
-
[37]
L., Dichiara, S., Gropp, J
Page, K. L., Dichiara, S., Gropp, J. D., et al. 2023, GRB Coordinates Network, 34537, 1
2023
-
[38]
J., Belloni, T., et al
Paragi, Z., van der Horst, A. J., Belloni, T., et al. 2013, MNRAS, 432, 1319, doi: 10.1093/mnras/stt545
2013 doi
-
[39]
M., Polisensky, E., Clarke, T
Peters, W. M., Polisensky, E., Clarke, T. E., Giacintucci, S., & Kassim, N. E. 2023, The Astronomer’s Telegram, 16279, 1 Podgorn´ y, J., Svoboda, J., Dovˇ ciak, M., et al. 2024, A&A, 686, L12, doi: 10.1051/0004-6361/202450566
2023 doi
-
[40]
Readhead, A. C. S. 1994, ApJ, 426, 51, doi: 10.1086/174038
1994 doi
-
[41]
A., & McClintock, J
Remillard, R. A., & McClintock, J. E. 2006, ARA&A, 44, 49, doi: 10.1146/annurev.astro.44.051905.092532
2006 arXiv
-
[42]
C., Pearson, T
Shepherd, M. C., Pearson, T. J., & Taylor, G. B. 1994, in Bulletin of the American Astronomical Society, Vol. 26, 987–989
1994
-
[43]
F., et al
Svoboda, J., Dovˇ ciak, M., Steiner, J. F., et al. 2024, ApJL, 966, L35, doi: 10.3847/2041-8213/ad402e
2024 doi
-
[44]
2004, in European VLBI Network on New Developments in VLBI Science and Technology, ed
Szomoru, A., Biggs, A., Garrett, M., et al. 2004, in European VLBI Network on New Developments in VLBI Science and Technology, ed. R. Bachiller, F. Colomer, J. F. Desmurs, & P. de Vicente, 257–260, doi: 10.48550/arXiv.astro-ph/0412686
-
[45]
Tsybulev, P. G. 2023, The Astronomer’s Telegram, 16289, 1
2023
-
[46]
1999, ApJS, 120, 95, doi: 10.1086/313170
Valtaoja, E., L¨ ahteenm¨ aki, A., Ter¨ asranta, H., & Lainela, M. 1999, ApJS, 120, 95, doi: 10.1086/313170
1999 doi
-
[47]
2023, ApJL, 958, L16, doi: 10.3847/2041-8213/ad0781
Veledina, A., Muleri, F., Dovˇ ciak, M., et al. 2023, ApJL, 958, L16, doi: 10.3847/2041-8213/ad0781
2023 doi
-
[48]
D., Gurwell, M., McCollough, M., & Rao, R
Vrtilek, S. D., Gurwell, M., McCollough, M., & Rao, R. 2023, The Astronomer’s Telegram, 16230, 1
2023
-
[49]
M., Miller-Jones, J
Wood, C. M., Miller-Jones, J. C. A., Homan, J., et al. 2021, MNRAS, 505, 3393, doi: 10.1093/mnras/stab1479 13
2021 doi
-
[50]
M., Miller-Jones, J
Wood, C. M., Miller-Jones, J. C. A., Bahramian, A., et al. 2023, MNRAS, 522, 70, doi: 10.1093/mnras/stad939
2023 doi
- [51]
-
[52]
2010, MNRAS, 409, L64, doi: 10.1111/j.1745-3933.2010.00948.x
Yang, J., Brocksopp, C., Corbel, S., et al. 2010, MNRAS, 409, L64, doi: 10.1111/j.1745-3933.2010.00948.x
2010
-
[53]
2023, MNRAS, 526, L1, doi: 10.1093/mnrasl/slad111
Yang, J., Garc ´ ıa, F., del Palacio, S., et al. 2023, MNRAS, 526, L1, doi: 10.1093/mnrasl/slad111
2023 doi
-
[54]
2023, Science, 381, 961, doi: 10.1126/science.abo4504
You, B., Cao, X., Yan, Z., et al. 2023, Science, 381, 961, doi: 10.1126/science.abo4504
2023 doi
-
[55]
2024, MNRAS, 529, 4624, doi: 10.1093/mnras/stae835
Yu, W., Bu, Q.-C., Zhang, S.-N., et al. 2024, MNRAS, 529, 4624, doi: 10.1093/mnras/stae835
2024 doi
Reviewed August 6, 2026 · model on record in the stance chip above.
Discussion (0). Sign in to comment.