REVIEW 3 major objections 4 minor 1 cited by
Delayed Feedback in High-$z$ Starbursts Revealed by Lyman-$\alpha$ Profiles and Metal Line Diagnostics
T0 review · 3 major / 4 minor · reviewed 2026-08-06 · deepseek-v4-flash
Pith's one-line read This paper argues that double-peaked Lyman-$\alpha$ profiles are the signature of starbursts younger than about 4 million years, before core-collapse supernovae have turned on, and that feedback, outflow speed, and outflow mass strengthen…
desk verdict Solid empirical core, plausible but model-dependent age interpretation; worth refereeing with a request for a broader BEAGLE grid. read the letter →
The pith
A machine-rendered reading of the paper's core claim, the machinery that carries it, and where it could break.
The reading
What carries the argument
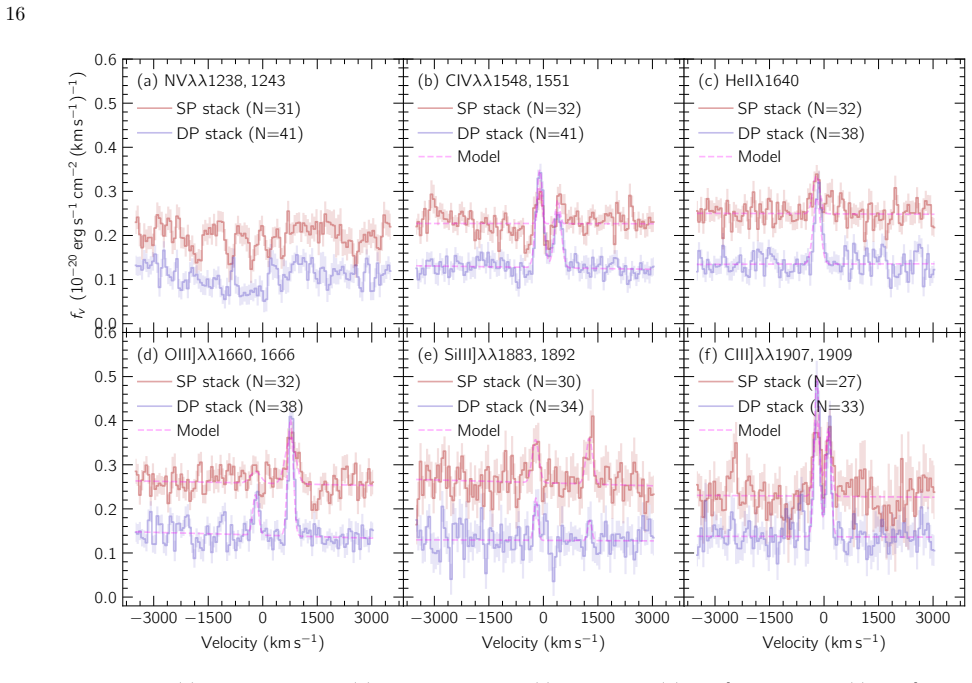
The machinery is a two-sided comparison of single- versus double-peaked Lyman-$\alpha$ profiles. On the outflow side, stacked spectra of low-ionization (Si II, C II) and high-ionization (Si IV) absorption lines measure the column density, covering fraction, and velocity width of gas along the line of sight, providing a direct, model-independent readout of outflow strength. On the source side, stacked UV emission line equivalent widths (C III], C IV, He II, O III], Si III]) and the N V $\lambda\lambda 1238,1243$ P-Cygni profile, a stellar-wind feature that decays within a few million years, are interpreted through a Bayesian spectral-fitting code built on stellar-population and photoionization models; the P-Cygni feature is the key age indicator because it fades on exactly the timescale of interest. The homogeneous thin-shell (HTS) expanding-shell radiative transfer model, fitted by Markov-chain Monte Carlo, is the object whose failure is diagnosed: it fits profiles well but cannot recover the outflow parameters seen in absorption.
What would settle it
Measure the stellar age of individual double-peaked Lyman-alpha galaxies from Balmer-line or continuum-break fitting, while simultaneously measuring the width and centroid of their Si II absorption. If a galaxy with an independently measured age below roughly 4 Myr shows broad (more than about 200 km/s) strongly blueshifted absorption, the claim that feedback remains weak before core-collapse supernovae would fail; if no such young strong-outflow galaxy exists, the delayed-feedback picture is supported.
Extended reading notes
Core claim
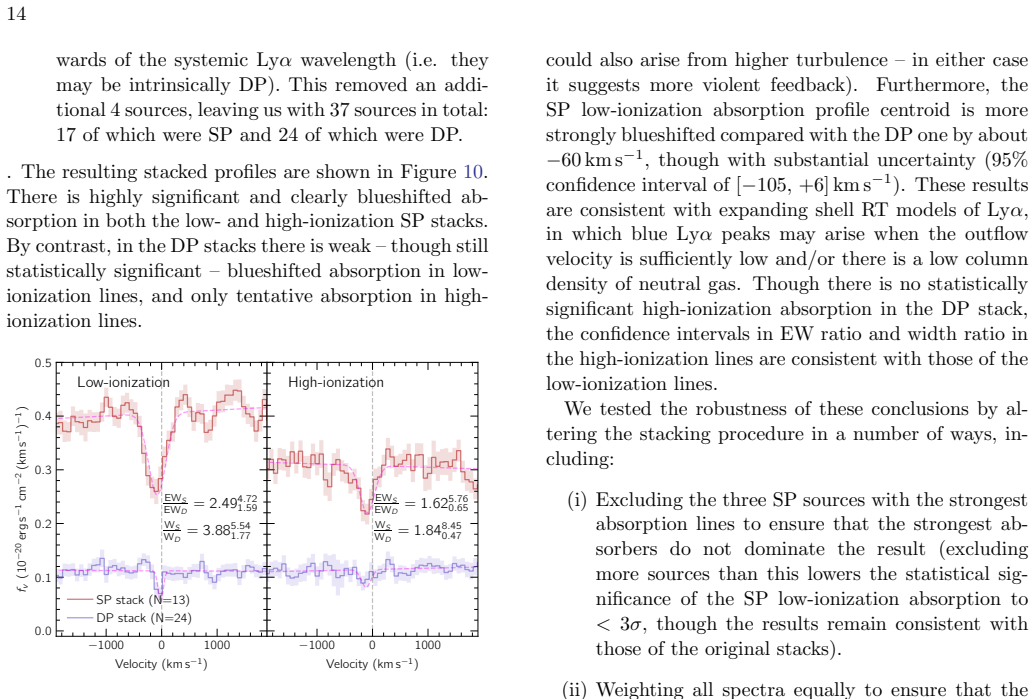
The central discovery is a systematic, empirically grounded link between Lyman-$\alpha$ line morphology and the evolutionary state of stellar feedback in high-redshift starbursts. Using systemic redshifts from optically thin metal emission lines, the authors confirm that single Lyman-$\alpha$ peaks are redshifted relative to the systemic velocity while double peaks straddle it. In stacked down-the-barrel (line-of-sight) absorption spectra, single-peaked sources show roughly three times stronger and wider low-ionization absorption than double-peaked sources, indicating higher neutral column, larger covering fraction, and faster or more turbulent outflowing gas; double-peaked sources also lack significant high-ionization absorption. Conversely, double-peaked sources show much stronger UV metal emission lines and a deeper N V P-Cygni wind feature, which, when fitted with stellar population and photoionization models, imply ages of $\lesssim 4$ Myr versus $\gtrsim 10$ Myr for single-peaked sources. The paper reads this as feedback being weak in the first few million years and strengthening dramatically at the onset of core-collapse supernovae. It also finds that homogeneous thin-shell radiative transfer models reproduce the observed Lyman-$\alpha$ profiles while returning unphysical parameters and systematically overestimating systemic redshifts, so those models should not be trusted for outflow inference.
Load-bearing premise
The age split that carries the argument is inferred by fitting stacked spectra with a model that assumes steady star formation, a Chabrier initial mass function extending to 300 solar masses, no significant binary evolution, and a gas density of $10^{3}$ $cm^{-3}$; if real starbursts are bursty, binary-rich, or have a lighter IMF, the roughly 4-versus-10 Myr ages and the supernova-timing interpretation could shift.
Editorial extensions
If this is right
- Lyman-$\alpha$ profile shape becomes an empirical age indicator for high-redshift starbursts: double-peaked means $\lesssim 4$ Myr, single-peaked means $\gtrsim 10$ Myr.
- Outflow properties change by roughly a factor of three in strength and width within the first 10 million years of a starburst, so simulations should not treat feedback as constant during this window.
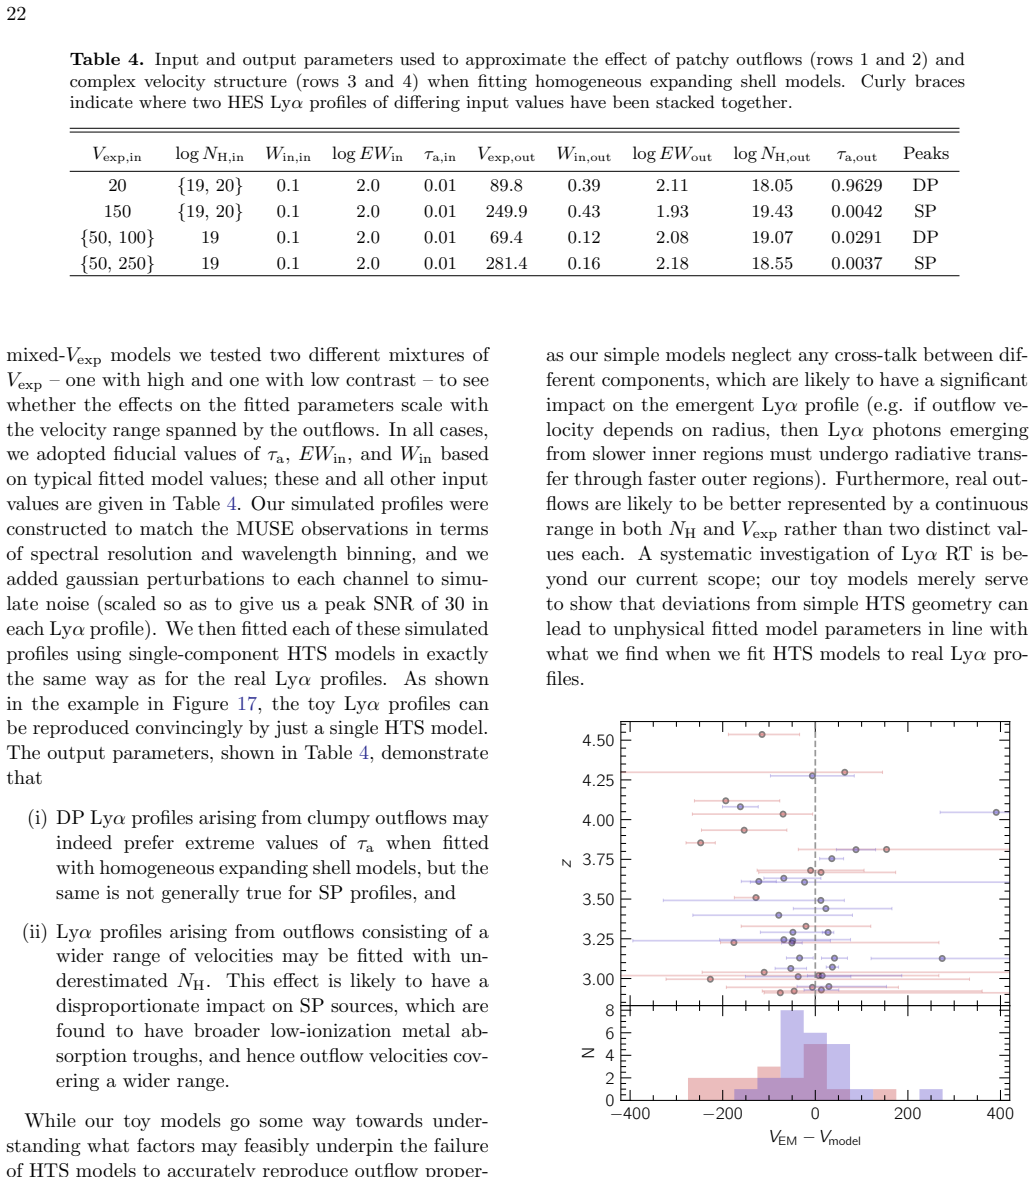
- Expanding-shell fits that look excellent can still return unphysical neutral columns, dust optical depths, and intrinsic line widths, and they systematically overestimate systemic redshifts; outflow velocities and Lyman-continuum-leakage estimates derived from them should be re-examined.
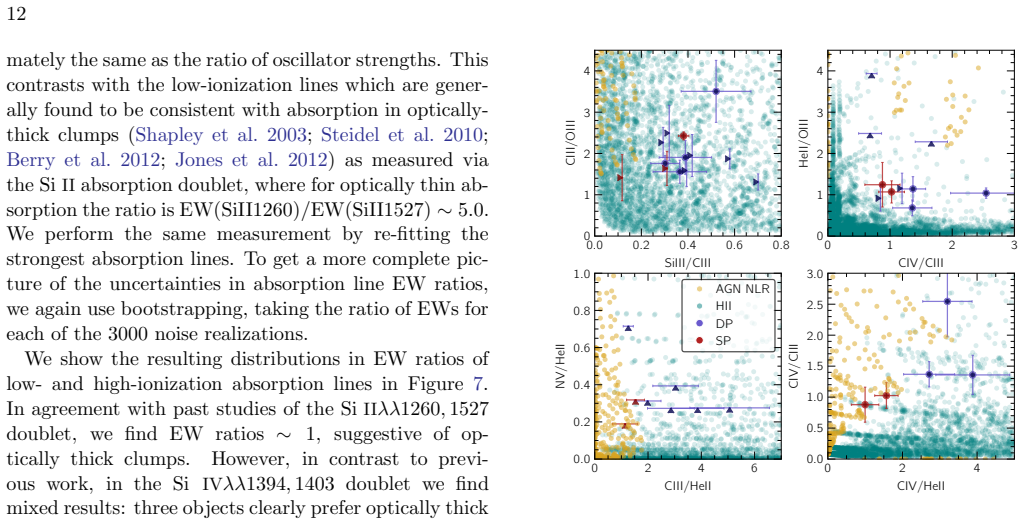
- Metal emission line ratios secure the sources as H II regions rather than AGN, so the age-feedback sequence applies to normal star-forming galaxies, not a hidden active-galaxy subpopulation.
Reading between the lines
- If the delayed-feedback reading is right, the same double-to-single transition should be observable across the lifetime of a single long-lived starburst: a galaxy observed first at $\sim 3$ Myr and later at $\sim 15$ Myr should shift from double- to single-peaked Lyman-$\alpha$ while its metal absorption broadens and strengthens.
- A testable extension would compare outflow momentum flux per unit star-formation rate against stellar age; the paper's picture predicts a sharp jump near 4 Myr rather than a smooth rise.
- The documented overestimate of systemic redshift in shell models implies that published outflow velocities from Lyman-$\alpha$ alone may be systematically low, and estimates of Lyman-continuum escape based on systemic Lyman-$\alpha$ flux may be biased high.
- The clumpy, multiphase absorption geometry seen here suggests that next-generation Lyman-$\alpha$ radiative transfer should move from homogeneous shells to porosity or multi-component velocity fields; the paper's toy models are a first step in that direction.
Editorial analysis
A structured set of objections, weighed in public.
Referee Report
Summary. The paper analyzes 338 gravitationally lensed Lyman-alpha emitters at z ~ 2.9-6.6 from the MUSE cluster fields of Richard et al. (2021). The authors fit Lyman-alpha profiles, measure systemic redshifts with optically thin metal emission lines, and stack metal absorption and emission lines for sources with single-peaked (SP) and double-peaked (DP) Lyman-alpha profiles. They report that SP sources show stronger, broader, more blueshifted low-ionization absorption than DP sources, while DP sources show higher emission-line equivalent widths and younger BEAGLE stellar ages (about 4 Myr versus about 10 Myr or more). They interpret this as delayed feedback: DP sources are extremely young starbursts in which core-collapse supernovae have not yet begun, whereas SP sources are older and host SNe-driven outflows. They also fit expanding-shell radiative transfer models with zELDA and find that, despite good chi-square values, the models yield unphysical parameters and systematically overestimate systemic redshifts, cautioning against the use of such models for outflow inference.
Significance. If the age-feedback interpretation holds, the paper provides a rare empirical constraint on the onset of supernova feedback in high-redshift starbursts, linking Lyman-alpha profile morphology to stellar population age. The empirical correlations themselves--stronger and wider low-ionization absorption in SP than DP stacks, and higher metal emission EWs in DP sources--are supported by careful stacking, bootstrap uncertainties, and several robustness tests. The paper also makes a valuable methodological point by showing that homogeneous expanding-shell models can fit Lyman-alpha profiles while returning unphysical parameters. These strengths make the central idea appealing and worth publishing if the model-dependent age inference can be hardened.
major comments (3)
- [Section 3.2.3, Table 2 and Figure 13] The quantitative age separation between DP and SP sources rests entirely on BEAGLE fits that assume a constant star formation history, a Chabrier IMF with a 300 Msun upper mass cutoff, and a gas density of 10^3 cm^-3. The paper tests only 100 versus 300 Msun cutoffs and single-burst versus constant SFH, adopting the 300 Msun cutoff because the DP He II 1640 EW requires it. Since the He II EW, C IV emission, and N V P-Cygni profile are the features most sensitive to the massive-star IMF and SFH, the inferred ages of about 4 Myr and about 10 Myr are conditional on these choices. I request a broader model grid--varying the IMF slope and upper cutoff, using declining or two-burst SFHs, and ideally including binary-rich stellar population models--to demonstrate that the age separation and its alignment with the onset of core-collapse supernovae persist.
- [Sections 3.2.1 and 3.2.3, Figures 9 and 12] The DP/SP classification is acknowledged to be sensitive to SNR and IGM attenuation, yet the individual-source EW comparison in Figure 9 does not apply the redshift cut used in the stacked analysis (SP at z > 4 excluded). This creates a possible selection bias: intrinsically DP sources at high redshift whose blue peaks are attenuated by the IGM would be classified as SP, and the KS test p-value of 0.0025 could then reflect IGM/SNR selection rather than an intrinsic age difference. Please apply the same redshift and SNR cuts to the individual-EW comparison, or otherwise show that the emission-line EW difference is not driven by these selection effects.
- [Section 3.2.2, Figure 10 and Abstract] The claim that SP outflows are 'slower' or 'less turbulent' than DP outflows is weaker than the abstract suggests. The stacked absorption centroid offset is -60 km/s with a 95% confidence interval of [-105, +6] km/s, which includes zero, and the width difference loses formal significance when the three strongest SP absorbers are excluded (as the paper itself notes). The absorption strength difference is robust, but the 'narrower' and especially 'slower' language should be softened or supported by additional analysis, because it is part of the central feedback-timescale interpretation.
minor comments (4)
- [Section 3.2.3] The sentence 'we excluded any SP sources with z < 4, which may be intrinsically DP sources affected by IGM attenuation' appears to be a typo: the comparison with Section 3.2.2 indicates that the intended cut is z > 4.
- [Section 3.2.1, Figure 9] The joint KS test is reported with p = 0.0025, but the text does not specify whether the test treats each line detection as an independent entry or combines lines per source; this should be clarified because multiple lines from the same source are not independent.
- [Section 3.1.3] The line is referred to as Si II 1527, whereas the standard air wavelength is 1526.72 Å; please use the conventional notation.
- [Section 3.3] The toy models in Table 4 and Figure 17 are useful illustrations, but the text should more explicitly state that the two-component mixtures neglect radiative transfer between components and therefore provide only a qualitative demonstration, not a quantitative calibration, of the HTS model biases.
Circularity Check
No circularity: the stellar ages, outflow parameters, and systemic redshifts are explicitly fitted to the data and then compared with independent metal-line diagnostics, so no prediction reduces by construction to its inputs.
full rationale
The paper's central derivation is a fit, not a prediction hiding inside its inputs. In Section 3.2.3 the stellar ages are obtained by running BEAGLE with the stacked SP/DP emission-line EWs and the 1220-1260 Angstrom P-Cygni window as constraints (Table 2, Figure 13); the posterior ages are then compared in Section 3.2.2 with independently measured stacked low- and high-ionization metal absorption profiles. The age difference and the absorption difference are therefore two empirical measurements placed side by side, and the 'delayed onset of core-collapse SNe' interpretation is imported from external stellar-evolution timescales (Woosley et al. 2002; Leitherer et al. 2014), not from the fitted parameters themselves. The choice of a constant SFH and a 300 solar-mass Chabrier IMF upper cutoff is a model assumption whose sensitivity is partially explored (single-burst versus constant SFH; 100 versus 300 solar-mass cutoffs; gas densities from 10^2 to 10^4 cm^-3). Model dependence is not circularity: the paper does not claim to predict the EWs it fits, and it explicitly reports the fitted quantities as fits. The zELDA expanding-shell analysis is likewise a test, not a circular validation: it fits Ly-alpha profiles, then shows that the fitted systemic redshift overestimates the systemic redshifts measured from optically-thin metal lines and returns unphysical parameters. The only heavily used external catalog, R21, is by different authors (Richard et al. 2021), so no load-bearing self-citation is present. No equation or fitted parameter is defined in terms of the conclusion, and no 'prediction' reduces by construction to an input. Hence a score of 0 is appropriate.
Assumptions & free parameters
free parameters (8)
- BEAGLE stellar age (log yr) =
DP ~ 10^6.6 yr, SP ~ 10^7.2-7.8 yr
- BEAGLE ionization parameter log U =
higher in DP sources (roughly -2.0 to -2.4)
- BEAGLE dust depletion factor xi_d =
larger in DP sources (~0.3-0.45)
- zELDA systemic redshift zsys =
variable, overestimated relative to optically-thin line redshifts
- zELDA expansion velocity Vexp =
0-400 km/s, SP typically ~40 km/s higher than DP
- zELDA H I column density NH =
log NH 17 to 21.5 cm^-2
- zELDA dust optical depth tau_a =
0 to 1, often near 1 for DP sources
- zELDA intrinsic Lyalpha width Win =
0.01 to 6 A, larger in DP sources
assumptions (6)
- domain assumption Optically thin UV emission lines (C III], He II, O III]) trace the systemic redshift
- domain assumption MUSE spectral resolution is ~2.40 A and unresolved narrow lines are treated as possible sky residuals
- domain assumption Lensing models and magnifications from R21 are accurate
- ad hoc to paper BEAGLE with constant SFH, Chabrier IMF (upper cutoff 300 Msun), and n=10^3 cm^-3 reproduces the stacked spectra
- domain assumption The homogeneous thin shell (HTS) geometry in zELDA is a meaningful baseline for Lyalpha fitting
- standard math Adopted flat LCDM cosmology does not affect relative velocity comparisons
Cite this review
Pith. "Pith review of Delayed Feedback in High-$z$ Starbursts Revealed by Lyman-$\alpha$ Profiles and Metal Line Diagnostics." pith.science (2026). https://pith.science/paper/ZL426YA4
@misc{pith2026250620422,
  author       = {Pith},
  title        = {Pith review of: Delayed Feedback in High-$z$ Starbursts Revealed by Lyman-$\alpha$ Profiles and Metal Line Diagnostics},
  year         = {2026},
  howpublished = {\url{https://pith.science/paper/ZL426YA4}},
  note         = {Machine review of arXiv:2506.20422}
}
abstract
Lyman-$\alpha$ emission, which owing to its resonant nature strongly couples the emergent line profile to gas kinematics, is a key observable for probing outflows from star-forming galaxies in the early universe. Inferences of outflow properties from Lyman-$\alpha$, however, often lack contextual comparisons with more direct outflow diagnostics from down-the-barrel metal absorption lines and driving-source properties from metal emission lines. Here, we make such checks by taking advantage of the lensing magnification provided by galaxy clusters for 338 Lyman-$\alpha$ sources observed with the Multi-Unit Spectroscopic Explorer (MUSE). Using metal emission lines to measure systemic redshifts, we confirm that the Lyman-$\alpha$ profiles are consistent with outflowing gas: single peaks redshifted relative to, or double peaks straddling, the systemic redshift. In cases where metal absorption lines are detected, blueshifted velocities indicate outflows, while line ratios point to absorption by a clumpy medium. We find systematic differences in both metal absorption and emission lines associated with single- versus double-peaked Lyman-$\alpha$ profiles, such that the latter are preferentially associated with weaker and narrower metal absorption profiles, but stronger emission lines indicating younger stellar ages ($\lesssim4\,$Myr for double-peaked Lyman-$\alpha$ vs $\gtrsim10\,$Myr for single-peaked Lyman-$\alpha$). Double-peaked Lyman-$\alpha$ profiles may therefore reflect weaker feedback in extremely young starbursts due to the delayed onset of core-collapse supernovae. Fitting model Lyman-$\alpha$ profiles based on simple expanding shell geometry to those observed, we find that such models successfully reproduce the data, yet systematically overestimate systemic redshifts and yield unphysical parameters -- calling for caution when inferring outflow properties from such models.
Figures


Figures from the paper (14 more)







Forward citations
Cited by 1 Pith paper
-
THOR: a GPU-accelerated and MPI-parallel radiative transfer code
A new GPU-accelerated, MPI-parallel Monte Carlo radiative transfer code (THOR) for resonant emission lines is validated against analytic solutions and benchmarked across idealized and cosmological setups, with measure...
Reference graph
Works this paper leans on
-
[1]
Agertz, O., Kravtsov, A. V., Leitner, S. N., & Gnedin, N. Y. 2013, ApJ, 770, 25, doi: 10.1088/0004-637X/770/1/25
-
[2]
2004, ApJL, 601, L25, doi: 10.1086/381750 Astropy Collaboration, Robitaille, T
Ahn, S.-H. 2004, ApJL, 601, L25, doi: 10.1086/381750 Astropy Collaboration, Robitaille, T. P., Tollerud, E. J., et al. 2013, A&A, 558, A33, doi: 10.1051/0004-6361/201322068 Astropy Collaboration, Price-Whelan, A. M., Sip˝ ocz, B. M., et al. 2018, AJ, 156, 123, doi: 10.3847/1538-3881/aabc4f Astropy Collaboration, Price-Whelan, A. M., Lim, P. L., et al. 202...
doi:10.1086/381750 2004
-
[3]
2010, in Society of Photo-Optical Instrumentation Engineers (SPIE) Conference Series, Vol
Bacon, R., Accardo, M., Adjali, L., et al. 2010, in Society of Photo-Optical Instrumentation Engineers (SPIE) Conference Series, Vol. 7735, Ground-based and Airborne Instrumentation for Astronomy III, ed. I. S. McLean, S. K. Ramsay, & H. Takami, 773508, doi: 10.1117/12.856027
-
[4]
Berg, D. A., Chisholm, J., Erb, D. K., et al. 2021, ApJ, 922, 170, doi: 10.3847/1538-4357/ac141b
-
[5]
2012, ApJ, 749, 4, doi: 10.1088/0004-637X/749/1/4
Berry, M., Gawiser, E., Guaita, L., et al. 2012, ApJ, 749, 4, doi: 10.1088/0004-637X/749/1/4
-
[6]
1996, A&AS, 117, 393, doi: 10.1051/aas:1996164
Bertin, E., & Arnouts, S. 1996, A&AS, 117, 393, doi: 10.1051/aas:1996164
-
[7]
2023, MNRAS, 523, 3749, doi: 10.1093/mnras/stad1523
Blaizot, J., Garel, T., Verhamme, A., et al. 2023, MNRAS, 523, 3749, doi: 10.1093/mnras/stad1523
-
[9]
2003, PASP, 115, 763, doi: 10.1086/376392
Chabrier, G. 2003, PASP, 115, 763, doi: 10.1086/376392
doi:10.1086/376392 2003
Show all 56 references
-
[10]
2016, MNRAS, 462, 1415, doi: 10.1093/mnras/stw1756
Chevallard, J., & Charlot, S. 2016, MNRAS, 462, 1415, doi: 10.1093/mnras/stw1756
2016 doi
-
[11]
2013, MNRAS, 432, 2061, doi: 10.1093/mnras/stt523
Chevallard, J., Charlot, S., Wandelt, B., & Wild, V. 2013, MNRAS, 432, 2061, doi: 10.1093/mnras/stt523
2013 doi
-
[12]
2003, MNRAS, 339, 63, doi: 10.1046/j.1365-8711.2003.06154.x
Chiappini, C., Romano, D., & Matteucci, F. 2003, MNRAS, 339, 63, doi: 10.1046/j.1365-8711.2003.06154.x
2003
-
[13]
R., Bayliss, M., et al
Chisholm, J., Rigby, J. R., Bayliss, M., et al. 2019, ApJ, 882, 182, doi: 10.3847/1538-4357/ab3104
2019 doi
-
[14]
2022, A&A, 666, A78, doi: 10.1051/0004-6361/202142320
Claeyssens, A., Richard, J., Blaizot, J., et al. 2022, A&A, 666, A78, doi: 10.1051/0004-6361/202142320
2022 doi
-
[15]
2014, A&A, 562, A52, doi: 10.1051/0004-6361/201220455
Duval, F., Schaerer, D., ¨Ostlin, G., & Laursen, P. 2014, A&A, 562, A52, doi: 10.1051/0004-6361/201220455
2014 doi
-
[16]
Erb, D. K. 2015, Nature, 523, 169, doi: 10.1038/nature14454
2015 doi
-
[17]
2016, MNRAS, 456, 3354, doi: 10.1093/mnras/stv2794
Feltre, A., Charlot, S., & Gutkin, J. 2016, MNRAS, 456, 3354, doi: 10.1093/mnras/stv2794
2016 doi
-
[18]
R., Dufour, R
Garnett, D. R., Dufour, R. J., Peimbert, M., et al. 1995, ApJL, 449, L77, doi: 10.1086/309620
1995 doi
-
[19]
2015, ApJ, 812, 123, doi: 10.1088/0004-637X/812/2/123
Gronke, M., Bull, P., & Dijkstra, M. 2015, ApJ, 812, 123, doi: 10.1088/0004-637X/812/2/123
2015 doi
-
[20]
Gronke, M., Dijkstra, M., McCourt, M., & Oh, S. P. 2016, ApJL, 833, L26, doi: 10.3847/2041-8213/833/2/L26 Gurung-L´ opez, S., Gronke, M., Saito, S., Bonoli, S., & Orsi, ´A. A. 2022, MNRAS, 510, 4525, doi: 10.1093/mnras/stab3554 Gurung-L´ opez, S., Orsi,´A. A., & Bonoli, S. 201...
2016 doi
-
[21]
2016, MNRAS, 462, 1757, doi: 10.1093/mnras/stw1716
Gutkin, J., Charlot, S., & Bruzual, G. 2016, MNRAS, 462, 1757, doi: 10.1093/mnras/stw1716
2016 doi
-
[22]
R., Millman, K
Harris, C. R., Millman, K. J., van der Walt, S. J., et al. 2020, Nature, 585, 357, doi: 10.1038/s41586-020-2649-2
2020 doi
-
[23]
Rivera-Thorsen, T. E. 2023, MNRAS, 520, 5903, doi: 10.1093/mnras/stad477
2023 doi
-
[24]
F., Wetzel, A., Wheeler, C., et al
Hopkins, P. F., Wetzel, A., Wheeler, C., et al. 2023, MNRAS, 519, 3154, doi: 10.1093/mnras/stac3489
2023 doi
-
[25]
Hunter, J. D. 2007, Computing in Science & Engineering, 9, 90, doi: 10.1109/MCSE.2007.55
2007 doi
-
[26]
I., Rinaldi, P., et al
Iani, E., Caputi, K. I., Rinaldi, P., et al. 2024, ApJ, 963, 97, doi: 10.3847/1538-4357/ad15f6
2024 doi
-
[27]
P., & Ellis, R
Jones, T., Stark, D. P., & Ellis, R. S. 2012, ApJ, 751, 51, doi: 10.1088/0004-637X/751/1/51
2012 doi
-
[28]
C., Somerville, R
Kim, C.-G., Ostriker, E. C., Somerville, R. S., et al. 2020, ApJ, 900, 61, doi: 10.3847/1538-4357/aba962
2020 doi
-
[29]
S., & Glover, S
Klessen, R. S., & Glover, S. C. O. 2016, Saas-Fee Advanced Course, 43, 85, doi: 10.1007/978-3-662-47890-5 2
2016 doi
-
[30]
R., Shapley, A
Kulas, K. R., Shapley, A. E., Kollmeier, J. A., et al. 2012, ApJ, 745, 33, doi: 10.1088/0004-637X/745/1/33
2012 doi
-
[31]
2014, ApJS, 212, 14, doi: 10.1088/0067-0049/212/1/14
Leitherer, C., Ekstr¨ om, S., Meynet, G., et al. 2014, ApJS, 212, 14, doi: 10.1088/0067-0049/212/1/14
2014 doi
-
[32]
2022, MNRAS, 513, 5034, doi: 10.1093/mnras/stac1207 Mac Low, M.-M., & Klessen, R
Li, Z., & Gronke, M. 2022, MNRAS, 513, 5034, doi: 10.1093/mnras/stac1207 Mac Low, M.-M., & Klessen, R. S. 2004, Reviews of Modern Physics, 76, 125, doi: 10.1103/RevModPhys.76.125
2022 doi
-
[33]
2024, arXiv e-prints, arXiv:2407.20331, doi: 10.48550/arXiv.2407.20331 Meˇ stri´ c, U., Vanzella, E., Zanella, A., et al
Messa, M., Vanzella, E., Loiacono, F., et al. 2024, arXiv e-prints, arXiv:2407.20331, doi: 10.48550/arXiv.2407.20331 Meˇ stri´ c, U., Vanzella, E., Zanella, A., et al. 2022, MNRAS, 516, 3532, doi: 10.1093/mnras/stac2309
-
[34]
2013, ARA&A, 51, 457, doi: 10.1146/annurev-astro-082812-140956 Orlitov´ a, I., Verhamme, A., Henry, A., et al
Nomoto, K., Kobayashi, C., & Tominaga, N. 2013, ARA&A, 51, 457, doi: 10.1146/annurev-astro-082812-140956 Orlitov´ a, I., Verhamme, A., Henry, A., et al. 2018, A&A, 616, A60, doi: 10.1051/0004-6361/201732478
2013 doi
-
[35]
G., & Baugh, C
Orsi, A., Lacey, C. G., & Baugh, C. M. 2012, MNRAS, 425, 87, doi: 10.1111/j.1365-2966.2012.21396.x
2012
-
[36]
2020, ARA&A, 58, 617, doi: 10.1146/annurev-astro-032620-021859
Ouchi, M., Ono, Y., & Shibuya, T. 2020, ARA&A, 58, 617, doi: 10.1146/annurev-astro-032620-021859
2020 doi
-
[37]
B., & Peebles, P
Partridge, R. B., & Peebles, P. J. E. 1967, ApJ, 147, 868, doi: 10.1086/149079
1967 doi
-
[38]
2024, ApJ, 971, 32, doi: 10.3847/1538-4357/ad534d
Pedrini, A., Adamo, A., Calzetti, D., et al. 2024, ApJ, 971, 32, doi: 10.3847/1538-4357/ad534d
2024 doi
-
[39]
A., Steidel, C
Pettini, M., Rix, S. A., Steidel, C. C., et al. 2002, ApJ, 569, 742, doi: 10.1086/339355
2002 doi
-
[40]
2019, in Astronomical Society of the Pacific Conference Series, Vol
Piqueras, L., Conseil, S., Shepherd, M., et al. 2019, in Astronomical Society of the Pacific Conference Series, Vol. 521, Astronomical Data Analysis Software and Systems XXVI, ed. M. Molinaro, K. Shortridge, & F. Pasian, 545 Planck Collaboration, Ade, P. A. R., Aghanim, N., et...
2019 doi
-
[41]
A., Steidel, C
Reddy, N. A., Steidel, C. C., Pettini, M., Bogosavljevi´ c, M., & Shapley, A. E. 2016, ApJ, 828, 108, doi: 10.3847/0004-637X/828/2/108
2016 doi
-
[42]
2021, A&A, 646, A83, doi: 10.1051/0004-6361/202039462
Richard, J., Claeyssens, A., Lagattuta, D., et al. 2021, A&A, 646, A83, doi: 10.1051/0004-6361/202039462
2021 doi
-
[43]
E., Hayes, M., ¨Ostlin, G., et al
Rivera-Thorsen, T. E., Hayes, M., ¨Ostlin, G., et al. 2015, ApJ, 805, 14, doi: 10.1088/0004-637X/805/1/14
2015 doi
-
[44]
E., Steidel, C
Shapley, A. E., Steidel, C. C., Pettini, M., & Adelberger, K. L. 2003, ApJ, 588, 65, doi: 10.1086/373922
2003 doi
-
[45]
2014, ApJ, 788, 74, doi: 10.1088/0004-637X/788/1/74
Shibuya, T., Ouchi, M., Nakajima, K., et al. 2014, ApJ, 788, 74, doi: 10.1088/0004-637X/788/1/74
2014 doi
-
[46]
T., Lilly, S
Soto, K. T., Lilly, S. J., Bacon, R., Richard, J., & Conseil, S. 2016, ZAP: Zurich Atmosphere Purge, Astrophysics Source Code Library, record ascl:1602.003
2016
-
[47]
P., Richard, J., Siana, B., et al
Stark, D. P., Richard, J., Siana, B., et al. 2014, MNRAS, 445, 3200, doi: 10.1093/mnras/stu1618
2014 doi
-
[48]
C., Erb, D
Steidel, C. C., Erb, D. K., Shapley, A. E., et al. 2010, ApJ, 717, 289, doi: 10.1088/0004-637X/717/1/289
2010 doi
-
[49]
K., & Heckman, T
Strickland, D. K., & Heckman, T. M. 2009, ApJ, 697, 2030, doi: 10.1088/0004-637X/697/2/2030
2009 doi
- [50]
-
[51]
S., & Dopita, M
Sutherland, R. S., & Dopita, M. A. 1993, ApJS, 88, 253, doi: 10.1086/191823
1993 doi
-
[52]
F., Steidel, C
Trainor, R. F., Steidel, C. C., Strom, A. L., & Rudie, G. C. 2015, ApJ, 809, 89, doi: 10.1088/0004-637X/809/1/89
2015 doi
-
[53]
2017, MNRAS, 467, 4304, doi: 10.1093/mnras/stx351
Vanzella, E., Calura, F., Meneghetti, M., et al. 2017, MNRAS, 467, 4304, doi: 10.1093/mnras/stx351
2017 doi
-
[54]
2015, A&A, 578, A7, doi: 10.1051/0004-6361/201423978
Verhamme, A., Orlitov´ a, I., Schaerer, D., & Hayes, M. 2015, A&A, 578, A7, doi: 10.1051/0004-6361/201423978
2015 doi
-
[55]
2006, A&A, 460, 397, doi: 10.1051/0004-6361:20065554
Verhamme, A., Schaerer, D., & Maselli, A. 2006, A&A, 460, 397, doi: 10.1051/0004-6361:20065554
2006 doi
-
[56]
E., et al
Virtanen, P., Gommers, R., Oliphant, T. E., et al. 2020, Nature Methods, 17, 261, doi: 10.1038/s41592-019-0686-2
2020 doi
-
[57]
E., Heger, A., & Weaver, T
Woosley, S. E., Heger, A., & Weaver, T. A. 2002, Reviews of Modern Physics, 74, 1015, doi: 10.1103/RevModPhys.74.1015
2002 doi
Reviewed August 6, 2026 · model on record in the stance chip above.
Discussion (0). Continue with ORCID to comment.