REVIEW 4 major objections 5 minor 2 cited by
JWST Observations of Photo-dissociation Regions. II. Aliphatic/Aromatic Carbonaceous Dust, Ices, and Gas Phase Spectral Line Inventory
T0 review · 4 major / 5 minor · reviewed 2026-08-06 · deepseek-v4-flash
Pith's one-line read JWST spectra of two star-forming clouds show deuterium preferentially replaces hydrogen in aliphatic carbon bonds, at 3–10 times the aromatic rate.
desk verdict New JWST PDR data of real value, but the deuterium fractions and 'complete removal' claim carry more model dependence than the abstract admits. read the letter →
The pith
A machine-rendered reading of the paper's core claim, the machinery that carries it, and where it could break.
The reading
What carries the argument
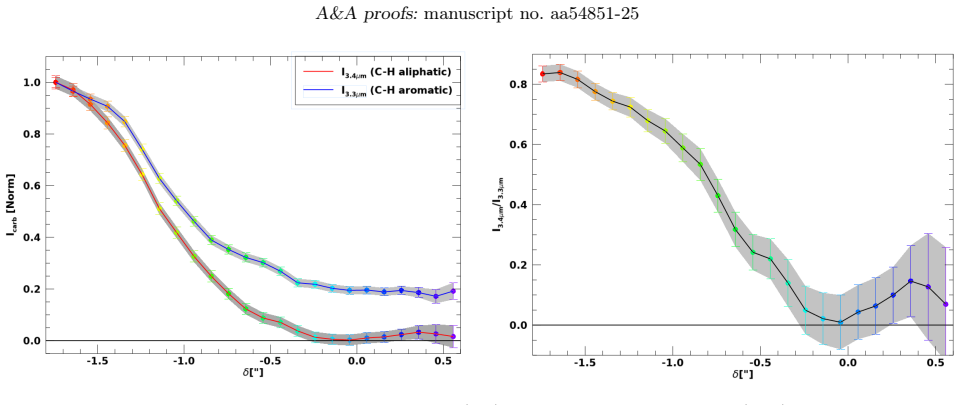
The load-bearing object is the 3–5 µm spectral complex of carbonaceous emission: the aromatic C–H stretch at 3.3 µm, the aliphatic C–H stretch at 3.4 µm with its red plateau, and their deuterated counterparts at roughly 4.4 µm (aromatic C–D) and 4.7 µm (aliphatic C–D). The argument proceeds by decomposing region-averaged and per-spaxel spectra into a polynomial continuum plus Drude profiles, mapping the 3.4/3.3 ratio across the front at roughly 100 AU resolution, and converting the observed 4.4/3.3 and 4.7/3.4 intensity ratios into $N_D/N_H$ using theoretical intrinsic band strengths for PAH-like carriers with aliphatic side groups.
What would settle it
A laboratory measurement of the intrinsic C–D stretch band strength for the actual aliphatic carrier (for example hydrogenated amorphous carbon with alkane side chains) at interstellar temperatures, combined with a high-resolution spectrum that separates the 4.7 µm feature from CO ro-vibrational lines and CO ice absorption, would settle whether the reported $N_D/N_H \sim 0.1$–$0.3$ is real or an artifact of band-strength and blending assumptions.
Extended reading notes
Core claim
The paper establishes, from JWST NIRSpec and MIRI IFU spectra of the Horsehead and NGC 7023 PDRs, that aliphatic and aromatic carbonaceous carriers respond differently to the UV field and that deuterium uptake marks the difference. At the Horsehead front, the 3.3 µm aromatic C–H feature continues into the H ii region while the 3.4 µm aliphatic feature drops to zero just inside the front, showing that the outflow is purely aromatic and that exposure to even moderate UV removes aliphatic bonds. In the more shielded regions of both objects, the aliphatic-to-aromatic bond ratio is roughly constant at $\sim 0.2$, but the deuterated fractions differ systematically: $N_D/N_H \sim 0.1$–$0.3$ for aliphatic bonds versus $\sim 0.03$ for aromatic bonds, and no 4.4 µm aromatic C–D feature is detected in the Horsehead at all. The absence of gas-phase HD lines, together with the high deuterium fraction in the carbonaceous bonds, is presented as consistent with the energetics by which deuterium replaces H in C–H bonds and catalyzes H$_2$ formation.
Load-bearing premise
The $N_D/N_H$ ratios in Table 6 assume that the 4.4 and 4.7 µm bands are C–D stretching modes and that the theoretical intrinsic band strengths, computed for PAH-like carriers with aliphatic side groups, apply to the actual interstellar carriers; if those band strengths or identifications are systematically wrong, the quantitative ratios change or collapse.
Editorial extensions
If this is right
- Aliphatic C–H bonds act as a sensitive UV dosimeter: their disappearance at the PDR front marks the transition from shielded to unshielded material before the aromatic emission fades.
- The 3.4 µm aliphatic feature can be used to isolate the photo-evaporative component of PDR outflows; its absence identifies outflows that have been stripped of aliphatic carriers.
- Deuterium fractionation in carbonaceous dust is observable in the infrared: the 4.4 and 4.7 µm C–D bands offer a way to map $N_D/N_H$ in PDRs and, by extension, to test models of interstellar deuterium chemistry.
- The measured line-contribution fractions in the JWST NIRCam and MIRI filters allow imaging-only studies to correct for line contamination in PDRs with similar physical conditions.
- Ice formation (H$_2$O, CO$_2$, CO) begins in the deeper, more shielded regions of NGC 7023, providing a spatial link between the destruction of aliphatic bonds at the front and the freeze-out of volatiles behind it.
Reading between the lines
- If the aliphatic C–D bond is as robust as the energetics suggest, deuterated aliphatic carriers could survive farther into H ii regions than their hydrogenated counterparts, so the 4.7 µm band may trace processed dust even where the 3.4 µm band has vanished.
- The absence of the 4.4 µm aromatic C–D feature in the Horsehead, at a column where NGC 7023 shows it, hints that aromatic deuteration depends on the hardness of the radiation field or on the formation history of the carriers; a test would be to observe a PDR with an intermediate UV hardness.
- The reported correlation of the 3.4–3.6 µm plateau with the aliphatic rather than the aromatic band, opposite to an earlier study, suggests the plateau carrier may be a separate aliphatic-rich population; separating its spatial profile from the main 3.4 µm band would settle the assignment.
- The same 4.7 µm spectral window contains CO ro-vibrational lines and CO ice absorption, so future higher-resolution observations that resolve the C–D band from CO would directly test whether part of the inferred aliphatic deuterium fraction is actually CO emission.
Editorial analysis
A structured set of objections, weighed in public.
Referee Report
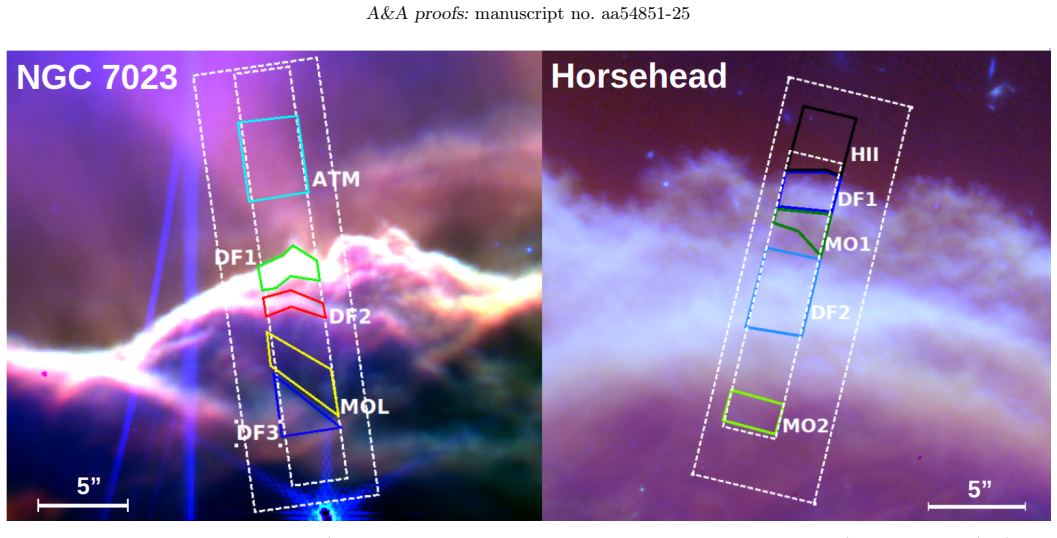
Summary. This paper presents an overview of JWST GTO 1192 NIRSpec and MIRI IFU observations of the Horsehead and NGC 7023 NW PDRs, including data reduction, cross-calibration, region extraction, line identification, and an inventory of atomic, H2, CH+, CO, and ice features. The analysis focuses on the 3-5 μm carbonaceous emission: it confirms the entrainment of 3.3 μm aromatic carriers in the Horsehead photo-evaporative outflow, finds no 3.4 μm aliphatic emission there, and interprets this as complete removal of aliphatic bonds. It also reports detections of the 4.4 and 4.7 μm features attributed to aromatic and aliphatic C-D stretching modes and derives ND/NH ~0.1-0.3 for aliphatics versus ~0.03 for aromatics using theoretical band strengths from Yang et al. (2020) and Yang & Li (2023b).
Significance. The dataset and the public line and spectrum tables are a valuable community resource; the cross-calibration against JWST imaging is careful, and the per-spaxel treatment of the 3.3/3.4 μm bands demonstrates spatial resolution of hydrocarbon processing at the ~100 au scale. If the aliphatic destruction and deuterium fractionation claims hold, they provide new, spatially resolved constraints on carbonaceous dust evolution in PDRs and on deuterium incorporation into C-H bonds. The paper is appropriately cautious in the body about carrier identification (Sect. 1) and about the plateau origin, but the abstract's headline numbers inherit external model dependencies and blend uncertainties that are not fully propagated.
major comments (4)
- [§4.5.1, Fig. 15] The abstract's statement that the outflow is 'purely aromatic' and that there is 'complete removal of aliphatic bonds' is based on scaling the DF1 spectrum by a hand-selected factor of 0.28 to match the 3.3 μm feature and then visually asserting that 3.4 μm emission is absent. No quantitative upper limit on I(3.4) in the H ii region is provided, and the uncertainty in the 0.28 scaling factor is not propagated. A formal non-detection limit, together with a discussion of whether size-selective entrainment could produce the same 3.3-only appearance, is needed before 'complete removal' can be stated.
- [§4.5.3, Table 6, Sect. 1] The ND/NH values in Table 6 are converted from observed intensity ratios using intrinsic C-D/C-H band strengths from Yang et al. (2020) and Yang & Li (2023b), which assume an underlying PAH structure with aliphatic side groups. Section 1 explicitly declines to identify the carriers as PAHs and leaves disordered a-C(:H) materials as an open possibility. If the true carriers are not PAH-like, the adopted band strengths do not apply, and the absolute D/H ratios, and possibly the claimed aliphatic-over-aromatic preference, change. The paper should either justify the PAH-based band strengths for these specific PDR carriers or present the D/H numbers as model-dependent and temper the abstract accordingly.
- [§4.4, §4.5.3, Fig. 12, Table 6] The 4.4 μm aromatic C-D feature used for the NGC 7023 MOL and DF3 entries in Table 6 (central wavelength ~4.38 μm, width ~0.1 μm) overlaps the 13CO2 ice absorption at ~4.39 μm identified in exactly those regions in Sect. 4.4. The extraction described in Sect. 4.5.3 does not state how this blend was separated, so the shielded-region aromatic ND/NH values (0.028 and 0.027) may be contaminated by the ice feature. A decomposition of the 13CO2 component, or an explicit uncertainty term for this blend, must be added before those points can support the conclusion that aromatic deuteration is less efficient.
- [§4.5.3] The suggestion of a reduced aromatic deuteration efficiency in the Horsehead relative to NGC 7023 rests on a non-detection of the 4.4 μm feature in all Horsehead regions, combined with an assumed detection threshold. Because the 4.4 μm feature is weak even in NGC 7023 (0.11-0.48 in the units of Table 6, with 1σ errors of 0.02-0.13), the Horsehead absence should be reported as a quantitative upper limit with an explicitly stated detection threshold rather than a qualitative efficiency difference.
minor comments (5)
- [Abstract] The term 'Disassociation Regions' should read 'Dissociation Regions'.
- [Fig. 1 caption] The caption begins with 'Extractions regions on images'; this should be 'Extraction regions on images'.
- [Tables 2 and 3] The label 'HIIb' in the Horsehead sections is typographically inconsistent with the 'H ii' notation used throughout the text and should be unified.
- [§4.5.2, Table 6] The text states that the aliphatic fraction is roughly constant at ~0.15-0.25 in both objects, but Table 6 contains Horsehead DF2 at 0.274±0.049 and NGC 7023 DF3 at 0.233±0.041; the quoted range should be reconciled with these values or explicitly described as a typical range.
- [Eq. (2)] The symbol Cλ is used both for extinction in Eq. (2) and for continuum flux in Eq. (A.1); a different symbol for one of the two quantities would remove ambiguity.
Circularity Check
No circular derivation: the paper's quantitative claims are measured intensities converted with external theoretical band strengths, and its outflow-composition claim is a direct spectroscopic comparison.
full rationale
The paper does not derive its headline results from its own inputs. The deuterium fractions ND/NH in Table 6 are obtained by converting observed 3.3/4.4 and 3.4/4.7 micron intensity ratios into column ratios using intrinsic band strengths from Yang et al. (2020) and Yang & Li (2023b), which are external theoretical calculations and not fitted to the present data. The claim that the Horsehead outflow is purely aromatic is based on a direct comparison of the H ii and DF1 spectra (Fig. 15), where the 3.4 micron aliphatic feature is absent after scaling the 3.3 micron aromatic bands to match; this is an observational inference, not a prediction from a fitted model. The paper does cite companion works from the same program (e.g., Abergel et al. 2024) for the prior discovery of the outflow, but the spectroscopic confirmation and compositional analysis stand independently on the JWST data presented here. The potential systematic uncertainties noted by a skeptical reader—PAH-specific band strengths and possible 13CO2 ice blending near 4.4 microns—are concerns about accuracy and model dependence, not circularity: the derivation does not assume its own conclusion. Accordingly, no circular step meets the evidentiary bar of the analysis, and the appropriate score is 1, reflecting only the presence of self-citations that are not load-bearing for the central derivation.
Assumptions & free parameters
free parameters (4)
- DF1-to-HII scaling factor =
0.28
- NIRSpec flux scaling factor =
0.87
- Foreground extinction E(B-V) =
0.05
- Number of Drude profiles in spectral decomposition =
8
assumptions (5)
- domain assumption The 3.3 and 3.4 µm emission features trace column densities of aromatic and aliphatic C-H bonds, respectively, and are optically thin.
- domain assumption The 4.4 and 4.7 µm features are the deuterated counterparts of the 3.3 and 3.4 µm C-H stretches, with intrinsic band strengths adopted from Yang et al. (2020) and Yang & Li (2023b).
- domain assumption The aromatic carriers in the outflow are the same population as those in DF1, so scaling the DF1 spectrum by 0.28 to match the 3.3 µm feature provides a valid baseline for comparing the 3.4 µm feature.
- standard math Case B recombination theory at Te = 10000 K and ne = 1000 cm-3 applies to the observed H I lines used for extinction estimates.
- domain assumption A screen-like geometry with no mixing of dust and emitting gas is a reasonable approximation for the extinction estimates.
Cite this review
Pith. "Pith review of JWST Observations of Photo-dissociation Regions. II. Aliphatic/Aromatic Carbonaceous Dust, Ices, and Gas Phase Spectral Line Inventory." pith.science (2026). https://pith.science/paper/D2PWHE2K
@misc{pith2026250620468,
  author       = {Pith},
  title        = {Pith review of: JWST Observations of Photo-dissociation Regions. II. Aliphatic/Aromatic Carbonaceous Dust, Ices, and Gas Phase Spectral Line Inventory},
  year         = {2026},
  howpublished = {\url{https://pith.science/paper/D2PWHE2K}},
  note         = {Machine review of arXiv:2506.20468}
}
abstract
This paper provides an overview of the spectroscopic data obtained by the JWST Guaranteed Time Observations (GTO) program 1192, "The Physics and Chemistry of PDR Fronts", including an inventory of the spatially resolved dust, gas, and molecular content in the Horsehead nebula and the NW filament of NGC~7023. We demonstrate the unique capability of this high spatial resolution data set to elucidate the evolution of gas and dust at the interface between stars and their natal clouds at the scale at which the physics and chemistry occur. The Disassociation Regions (PDRs) in the Horsehead nebula and the North West (NW) filament of NGC 7023 were mapped with a spectral resolution 1000-3000 and a spatial resolution of ~2e-4 pc between 0.97-28um. Spectra extracted from template regions yield a large number of atomic, ionized, and molecular lines. Full line lists and extracted spectra for all 10 regions are provided through CDS. Absorption from H$_2$O, CO$_2$, and CO ices are identified in 3 regions in NGC 7023. In this overview, we have focused on the spectral region between 3 and 5 um which is dominated by emission from aromatic and aliphatic carbon bonds to illustrate the power of the data set. We confirm the entrainment of aromatic carbonaceous species in the photo-evaporative flow from the PDR surface into the H\,{\sc{ii}} region in the Horsehead. No aliphatic emission is present in the outflow, indicating the complete removal of aliphatic bonds when exposed to strong UV fields. There is a clear detection of deuterium substitution in the carbon bonds. Aliphatic D-substitution is more efficient relative to aromatic D-substitution, ranging from N$_{D}$/N$_{H}$ ~ 0.1-0.3 for aliphatics compared to ~0.03 for the aromatics.
Figures


Figures from the paper (18 more)




Forward citations
Cited by 2 Pith papers
-
Infrared spectroscopy of gas-phase hydrogenated and methylated pyrenes: from laboratory spectra to the simulated 3.4 $\mu$m emission band
Gas-phase infrared spectra of hydrogenated and methylated pyrenes, combined with a Monte Carlo cooling model, point to 1,2,3,6,7,8-hexahydropyrene as the carrier of the 3.403 μm component of the interstellar 3.4 μm em...
-
PDRs4All XXII. Near-Infrared continuum in the Orion Bar
The near-infrared excess in the Orion Bar decomposes into a ~700 K component correlated with the 3.3 micrometer aromatic band and a weakly constrained hotter component that is not.
Reference graph
Works this paper leans on
-
[1]
Abergel , A., Teyssier , D., Bernard , J. P., et al. 2003, , 410, 577, 10.1051/0004-6361:20030878
-
[2]
Abergel , A., Misselt , K., Gordon , K. D., et al. 2024, , 687, A4, 10.1051/0004-6361/202449198
-
[3]
Anthony-Twarog , B. J. 1982, , 87, 1213, 10.1086/113204
-
[4]
Astropy Collaboration , Robitaille , T. P., Tollerud , E. J., et al. 2013, , 558, A33, 10.1051/0004-6361/201322068
-
[5]
Astropy Collaboration , Price-Whelan , A. M., Lim , P. L., et al. 2022, , 935, 167, 10.3847/1538-4357/ac7c74
-
[6]
Boersma , C., Allamandola , L. J., Esposito , V. J., et al. 2023, , 959, 74, 10.3847/1538-4357/ad022b
-
[7]
Boogert , A. C. A., Gerakines , P. A., & Whittet , D. C. B. 2015, , 53, 541, 10.1146/annurev-astro-082214-122348
-
[8]
Boogert , A. C. A., Ehrenfreund , P., Gerakines , P. A., et al. 2000, , 353, 349, 10.48550/arXiv.astro-ph/9909477
Show all 78 references
- [9]
-
[10]
B., Neufeld , D
Changala , P. B., Neufeld , D. A., & Godard , B. 2021, , 917, 16, 10.3847/1538-4357/ac05c8
2021 doi
-
[11]
Chokshi , A., Tielens , A. G. G. M., Werner , M. W., & Castelaz , M. W. 1988, , 334, 803, 10.1086/166878
1988 doi
-
[12]
2024, , 685, A75, 10.1051/0004-6361/202346662
Chown , R., Sidhu , A., Peeters , E., et al. 2024, , 685, A75, 10.1051/0004-6361/202346662
2024 doi
-
[13]
2025, , 698, A86, 10.1051/0004-6361/202452940
Chown , R., Okada , Y., Peeters , E., et al. 2025, , 698, A86, 10.1051/0004-6361/202452940
2025 doi
-
[14]
F., Ferruit , P., Lobb , D
Closs , M. F., Ferruit , P., Lobb , D. R., et al. 2008, in Society of Photo-Optical Instrumentation Engineers (SPIE) Conference Series, Vol. 7010, Space Telescopes and Instrumentation 2008: Optical, Infrared, and Millimeter, ed. J. M. Oschmann , Jr., M. W. M. de Graauw , & H. ...
2008 doi
-
[15]
2007, , 471, 205, 10.1051/0004-6361:20066172
Compi \`e gne , M., Abergel , A., Verstraete , L., et al. 2007, , 471, 205, 10.1051/0004-6361:20066172
2007 doi
-
[16]
A., Candian , A., Bern \'e , O., & Tielens , A
Croiset , B. A., Candian , A., Bern \'e , O., & Tielens , A. G. G. M. 2016, , 590, A26, 10.1051/0004-6361/201527714
2016 doi
-
[17]
D., Candian , A., Mori , T., Onaka , T., & Tielens , A
Doney , K. D., Candian , A., Mori , T., Onaka , T., & Tielens , A. G. G. M. 2016, , 586, A65, 10.1051/0004-6361/201526809
2016 doi
-
[18]
Draine , B. T. 2006, in Astronomical Society of the Pacific Conference Series, Vol. 348, Astrophysics in the Far Ultraviolet: Five Years of Discovery with FUSE, ed. G. Sonneborn , H. W. Moos , & B. G. Andersson , 58
2006
- [19]
-
[20]
A., et al
Ehrenfreund , P., Kerkhof , O., Schutte , W. A., et al. 1999, , 350, 240
1999
-
[21]
2024, , Submitted
El Yajouri , M., Abergel , A., Ysard , N., & et al . 2024, , Submitted
2024
-
[22]
L., Maillard , J
Field , D., Lemaire , J. L., Maillard , J. P., et al. 2000, Hydrogen in Photodissociation Regions: NGC2023 and NGC7023, ed. F. Combes & G. Pineau des Forets, Cambridge Contemporary Astrophysics (Cambridge University Press), 155–160
2000
-
[23]
J., Cernicharo , J., & Gerin , M
Fuente , A., Martin-Pintado , J., Rodriguez-Fernandez , N. J., Cernicharo , J., & Gerin , M. 2000, in ESA Special Publication, Vol. 456, ISO Beyond the Peaks: The 2nd ISO Workshop on Analytical Spectroscopy, ed. A. Salama , M. F. Kessler , K. Leech , & B. Schulz , 95
2000
-
[24]
2020, VizieR Online Data Catalog: Gaia EDR3 (Gaia Collaboration, 2020) , VizieR On-line Data Catalog: I/350
Gaia Collaboration . 2020, VizieR Online Data Catalog: Gaia EDR3 (Gaia Collaboration, 2020) , VizieR On-line Data Catalog: I/350. Originally published in: 2021A&A...649A...1G, 10.26093/cds/vizier.1350
2020 doi
-
[25]
A., Whittet , D
Gerakines , P. A., Whittet , D. C. B., Ehrenfreund , P., et al. 1999, , 522, 357, 10.1086/307611
1999 doi
-
[26]
Gontcharov , G. A. 2006, Astronomy Letters, 32, 759, 10.1134/S1063773706110065
2006 doi
-
[27]
D., Clayton , G
Gordon , K. D., Clayton , G. C., Decleir , M., et al. 2023, , 950, 86, 10.3847/1538-4357/accb59
2023 doi
-
[28]
D., Witt , A
Gordon , K. D., Witt , A. N., Rudy , R. J., et al. 2000, , 544, 859, 10.1086/317245
2000 doi
-
[29]
M., Teyssier , D., & Pety , J
Habart , E., Abergel , A., Walmsley , C. M., Teyssier , D., & Pety , J. 2005, , 437, 177, 10.1051/0004-6361:20041546
2005 doi
-
[30]
Habing , H. J. 1968, , 19, 421
1968
-
[31]
S., & Draine , B
Hensley , B. S., & Draine , B. T. 2023, , 948, 55, 10.3847/1538-4357/acc4c2
2023 doi
-
[32]
V., Goicoechea , J
Hern \'a ndez-Vera , C., Guzm \'a n , V. V., Goicoechea , J. R., et al. 2023, , 677, A152, 10.1051/0004-6361/202347206
2023 doi
-
[33]
J., & Tielens , A
Hollenbach , D. J., & Tielens , A. G. G. M. 1999, Reviews of Modern Physics, 71, 173, 10.1103/RevModPhys.71.173
1999 doi
-
[34]
M., Bauschlicher , Jr., C
Hudgins , D. M., Bauschlicher , Jr., C. W., & Sandford , S. A. 2004, , 614, 770, 10.1086/423930
2004 doi
-
[35]
M., Sandford , S
Hudgins , D. M., Sandford , S. A., Allamandola , L. J., & Tielens , A. G. G. M. 1993, , 86, 713, 10.1086/191796
1993 doi
-
[36]
P., Fanciullo , L., K \"o hler , M., et al
Jones , A. P., Fanciullo , L., K \"o hler , M., et al. 2013, , 558, A62, 10.1051/0004-6361/201321686
2013 doi
- [37]
-
[38]
V., Scholz , R
Kharchenko , N. V., Scholz , R. D., Piskunov , A. E., R \"o ser , S., & Schilbach , E. 2007, Astronomische Nachrichten, 328, 889, 10.1002/asna.200710776
2007 doi
-
[39]
2014, , 569, A109, 10.1051/0004-6361/201322711
K \"o hler , M., Habart , E., Arab , H., et al. 2014, , 569, A109, 10.1051/0004-6361/201322711
2014 doi
-
[40]
H., Baas , F., Allamandola , L
Lacy , J. H., Baas , F., Allamandola , L. J., et al. 1984, , 276, 533, 10.1086/161642
1984 doi
-
[41]
1979, , 79, 256
Leger , A., Klein , J., de Cheveigne , S., et al. 1979, , 79, 256
1979
-
[42]
2025, , 986, 156, 10.3847/1538-4357/add538
Lyu , J., Yang , X., Li , A., et al. 2025, , 986, 156, 10.3847/1538-4357/add538
2025 doi
-
[43]
R., & Bonnamy , A
Marciniak , A., Joblin , C., Mulas , G., Mundlapati , V. R., & Bonnamy , A. 2021, , 652, A42, 10.1051/0004-6361/202140737
2021 doi
-
[44]
Martini , P., Sellgren , K., & Hora , J. L. 1997, , 484, 296, 10.1086/304322
1997 doi
-
[45]
Millar , T. J. 2005, Astronomy and Geophysics, 46, 2.29, 10.1111/j.1468-4004.2005.46229.x
2005
-
[46]
2013, , 552, A15, 10.1051/0004-6361/201220757
Montillaud , J., Joblin , C., & Toublanc , D. 2013, , 552, A15, 10.1051/0004-6361/201220757
2013 doi
-
[47]
A., Godard , B., Bryan Changala , P., et al
Neufeld , D. A., Godard , B., Bryan Changala , P., et al. 2021, , 917, 15, 10.3847/1538-4357/ac05c9
2021 doi
-
[48]
I., Sakon , I., et al
Onaka , T., Mori , T. I., Sakon , I., et al. 2014, , 780, 114, 10.1088/0004-637X/780/2/114
2014 doi
-
[49]
2024, , 685, A74, 10.1051/0004-6361/202348244
Peeters , E., Habart , E., Bern \'e , O., et al. 2024, , 685, A74, 10.1051/0004-6361/202348244
2024 doi
-
[50]
R., Hily-Blant , P., Gerin , M., & Teyssier , D
Pety , J., Goicoechea , J. R., Hily-Blant , P., Gerin , M., & Teyssier , D. 2007, , 464, L41, 10.1051/0004-6361:20067009
2007 doi
-
[51]
2015, , 577, A16, 10.1051/0004-6361/201425590
Pilleri , P., Joblin , C., Boulanger , F., & Onaka , T. 2015, , 577, A16, 10.1051/0004-6361/201425590
2015 doi
-
[52]
M., Fraser , H
Pontoppidan , K. M., Fraser , H. J., Dartois , E., et al. 2003, , 408, 981, 10.1051/0004-6361:20031030
2003 doi
-
[53]
M., Sip o cz , B
Price-Whelan , A. M., Sip o cz , B. M., G \"u nther , H. M., et al. 2018, , 156, 123, 10.3847/1538-3881/aabc4f
2018 doi
-
[54]
Prozesky , A., & Smits , D. P. 2018, , 478, 2766, 10.1093/mnras/sty1189
2018 doi
-
[55]
Rauscher , B. J. 2024, , 136, 015001, 10.1088/1538-3873/ad1b36
2024 doi
-
[56]
A., Allamandola , L
Sandford , S. A., Allamandola , L. J., Tielens , A. G. G. M., & Valero , G. J. 1988, , 329, 498, 10.1086/166395
1988 doi
-
[57]
A., Bernstein , M
Sandford , S. A., Bernstein , M. P., & Materese , C. K. 2013, , 205, 8, 10.1088/0067-0049/205/1/8
2013 doi
-
[58]
2020, , 639, A144, 10.1051/0004-6361/202037937
Schirmer , T., Abergel , A., Verstraete , L., et al. 2020, , 639, A144, 10.1051/0004-6361/202037937
2020 doi
-
[59]
G., Sellgren , K., & Tokunaga , A
Smith , R. G., Sellgren , K., & Tokunaga , A. T. 1989, , 344, 413, 10.1086/167809
1989 doi
-
[60]
Tielens , A. G. G. M. 2008, , 46, 289, 10.1146/annurev.astro.46.060407.145211
2008
-
[61]
Tielens , A. G. G. M. 2023, in European Conference on Laboratory Astrophysics ECLA2020. The Interplay of Dust, 129--150, 10.1007/978-3-031-29003-9_15
2023 doi
-
[62]
Tielens , A. G. G. M., & Hollenbach , D. 1985, , 291, 722, 10.1086/163111
1985 doi
-
[63]
2017, Molecular Astrophysics, 9, 1, 10.1016/j.molap.2017.11.001
Wakelam , V., Bron , E., Cazaux , S., et al. 2017, Molecular Astrophysics, 9, 1, 10.1016/j.molap.2017.11.001
2017 doi
-
[64]
W., Glasse , A., et al
Wells , M., Pel , J. W., Glasse , A., et al. 2015, , 127, 646, 10.1086/682281
2015 doi
-
[65]
W., Uchida , K
Werner , M. W., Uchida , K. I., Sellgren , K., et al. 2004, , 154, 309, 10.1086/422413
2004 doi
-
[66]
N., Gordon , K
Witt , A. N., Gordon , K. D., Vijh , U. P., et al. 2006, , 636, 303, 10.1086/498052
2006 doi
-
[67]
G., Vallini , L., & Chevance , M
Wolfire , M. G., Vallini , L., & Chevance , M. 2022, , 60, 247, 10.1146/annurev-astro-052920-010254
2022 doi
- [68]
-
[69]
2023 b , , 268, 12, 10.3847/1538-4365/ace4c6
---. 2023 b , , 268, 12, 10.3847/1538-4365/ace4c6
2023 doi
- [70]
-
[71]
J., Li , A., & Glaser , R
Yang , X. J., Li , A., & Glaser , R. 2020, , 251, 12, 10.3847/1538-4365/abba28
2020 doi
-
[72]
P., Guillet , V., et al
Ysard , N., Jones , A. P., Guillet , V., et al. 2024, , 684, A34, 10.1051/0004-6361/202348391
2024 doi
-
[73]
2025, , 696, A99, 10.1051/0004-6361/202453441
Zannese , M., Tabone , B., Habart , E., et al. 2025, , 696, A99, 10.1051/0004-6361/202453441
2025 doi
-
[74]
Zubko , V., Dwek , E., & Arendt , R. G. 2004, , 152, 211, 10.1086/382351
2004 doi
-
[75]
, " * write output.state after.block = add.period write newline
ENTRY address archiveprefix author booktitle chapter edition editor howpublished institution eprint journal key month note number organization pages publisher school series title type volume year label extra.label sort.label short.list INTEGERS output.state before.all mid.sent...
-
[76]
write newline
" write newline "" before.all 'output.state := FUNCTION n.dashify 't := "" t empty not t #1 #1 substring "-" = t #1 #2 substring "--" = not "--" * t #2 global.max substring 't := t #1 #1 substring "-" = "-" * t #2 global.max substring 't := while if t #1 #1 substring * t #2 gl...
-
[77]
, " * write output.state after.block = add.period write newline
ENTRY address archivePrefix author booktitle chapter doi edition editor eprint howpublished institution journal key month number organization pages publisher school series title misctitle type volume year version url label extra.label sort.label short.list INTEGERS output.stat...
-
[78]
write newline
" write newline "" before.all 'output.state := FUNCTION format.url url empty "" new.block "" url * "" * if FUNCTION format.eprint eprint empty "" archivePrefix empty "" archivePrefix "arXiv" = new.block " " eprint * " " * new.block " " eprint * " " * if if if FUNCTION format.d...
Reviewed August 6, 2026 · model on record in the stance chip above.
Discussion (0). Sign in to comment.