REVIEW 3 major objections 5 minor 24 references
Sim2Val: Leveraging Correlation Across Test Platforms for Variance-Reduced Metric Estimation
T0 review · 3 major / 5 minor · reviewed 2026-08-06 · deepseek-v4-flash
Pith's one-line read Sim2Val shows that cheap surrogate measurements, used as control variates, can cut the number of real-world robot tests needed for a reliable performance estimate.
desk verdict A solid application of control variates to robot validation that is undermined by a gap between the oracle theory and the implemented estimator; worth refereeing, but the confidence-bound claims need fixing. read the letter →
The pith
A machine-rendered reading of the paper's core claim, the machinery that carries it, and where it could break.
The reading
What carries the argument
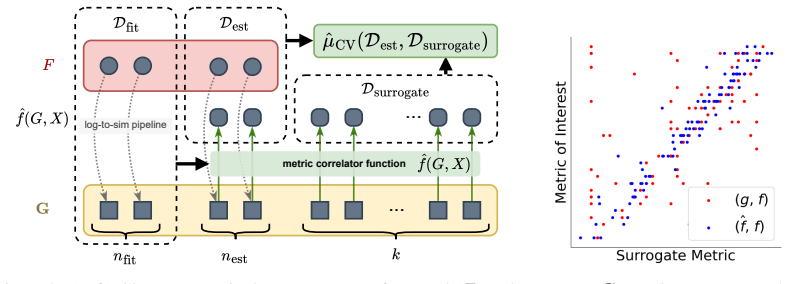
The load-bearing object is the control-variate estimator of Equation (3), which reuses the same paired samples to estimate the surrogate's mean and then corrects the surrogate-only average with the paired residuals $F-\beta^\top G$. The key identity is the variance formula of Theorem 1: $\mathrm{Var}(\hat{\mu}_{\mathrm{CV}}(\beta_{\mathrm{opt}})) = \frac{1}{n}\left(1 - \frac{k}{k+n}\rho^2(G,F)\right)\mathrm{Var}(F)$, with $\rho^2(G,F)$ the squared correlation (Frobenius norm of the standardized cross-covariance) between the surrogate and the real metric. The theorem shows how correlation, the number of paired samples $n$, and the number of surrogate-only samples $k$ trade off, and Theorem 2 converts that variance into the paired-sample requirement $n_{\min}$. The metric correlator function is a secondary mechanism: a learned map $\hat{f}(G,\phi(X))$ that is fit on a split of the paired data to raise the correlation available to the estimator.
What would settle it
Collect paired real and surrogate measurements from deployment scenarios plus a large batch of surrogate-only measurements from a deliberately different scenario distribution, then test whether the control-variate interval covers the true mean at the claimed Chebyshev rate; if it does not, the same-distribution assumption fails. Alternatively, in a setting where the mean and correlation are known exactly, compare the sample variance of the estimator across many trials to Equation (5); any systematic excess over that formula would contradict the central claim.
Extended reading notes
Core claim
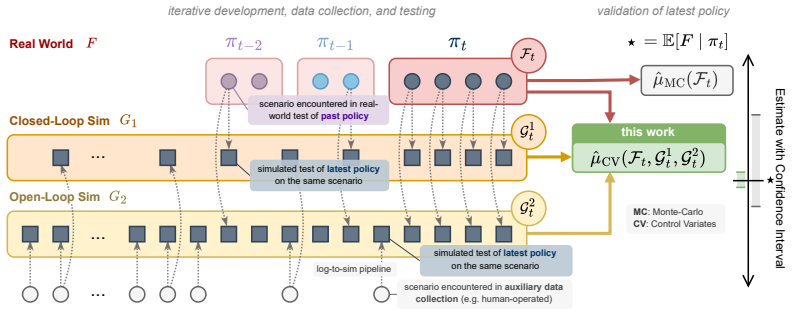
On the paper's own terms, the central claim is that the variance of a Monte Carlo estimate of the real-world mean $\mu=\mathbb{E}[F]$ can be reduced provably by using a surrogate signal $G$ as a control variate, even when the expectation $\mathbb{E}[G]$ is unknown and must itself be estimated from abundant surrogate-only samples. The estimator is $\hat{\mu}_{\mathrm{CV}} = \frac{1}{n}\sum_i (F_i - \beta^\top G_i) + \frac{1}{k}\sum_j \beta^\top G'_j$, and with the optimal coefficient $\beta_{\mathrm{opt}} = \frac{k}{k+n}\mathrm{Var}(G)^{-1}\mathrm{Cov}(G,F)$ its variance is $\frac{1}{n}\left(1 - \frac{k}{k+n}\rho^2(G,F)\right)\mathrm{Var}(F)$, where $\rho^2(G,F)$ is the squared correlation between the surrogate and the metric. Because the factor in parentheses is at most one, the estimator is never worse than Monte Carlo; as $k$ grows it tends to $(1-\rho^2)\mathrm{Var}(F)/n$. The paper further shows that under Chebyshev's inequality the number of paired real samples needed to match a given confidence interval is $n_{\min}\le n_r$, with the explicit formula $n_{\min} = \frac{1}{2}\left(-(k-n_r)+\sqrt{(k-n_r)^2+4n_r k(1-\rho^2)}\right)$, and that learning a metric correlator function from surrogate metrics plus scenario features can increase $\rho^2$ and thereby lower the variance further, at the cost of consuming paired samples for training.
Load-bearing premise
The whole method assumes every paired and surrogate-only sample is drawn independently from the same target distribution of scenarios that deployment will see; if the cheap surrogate data, such as simulation logs or selected scenarios, comes from a different distribution, the estimated mean is biased and the variance guarantees do not apply.
Editorial extensions
If this is right
- For equal numbers of paired samples, the control-variate interval is tighter than the Monte Carlo interval for any nonzero correlation $\rho^2(G,F)$, and never wider.
- As surrogate-only data become abundant, the variance approaches $(1-\rho^2)\mathrm{Var}(F)/n$, so the limiting gain is set entirely by how predictive the cheap signal is.
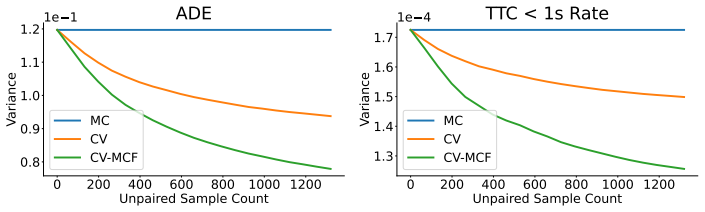
- The formula $n_{\min}\le n_r$ quantifies the real-world sample savings; the paper reports reductions of about 51-58% in the nuPlan setting and close to a 6x reduction for real-world driving metrics.
- A learned metric correlator can improve $\rho^2$ enough to offset the paired samples it consumes, with the trade-off stated by inequality (7), and out-of-domain training data can help without reducing the number of paired samples available for the estimator.
- Given per-sample costs for real and surrogate measurements, the closed-form budget allocation of Appendix D says how to split a fixed budget between paired and unpaired samples to minimize estimator variance.
Reading between the lines
- The i.i.d. assumption that all samples come from the same scenario distribution is the first thing to test in a real deployment; if surrogate-only data are collected from a different scenario mix, importance weighting of the surrogate mean would be a natural repair, but that repair is this reader's suggestion, not part of the paper.
- Because the variance bound depends only on the squared correlation and the sample counts, the same estimator should transfer to other paired-platform settings, such as hardware-in-the-loop testing or human-annotated labels paired with model predictions, wherever a cheap correlated signal exists.
- Extending the estimator to tail or quantile metrics, such as conditional value at risk, would require a different variance analysis; the paper explicitly leaves mean-only validation as a limitation, and tail metrics may matter more for safety-critical failures.
Editorial analysis
A structured set of objections, weighed in public.
Referee Report
Summary. The paper introduces Sim2Val, a control-variate framework for estimating the expected value of a real-world metric (e.g., closed-loop driving performance) using a small number of paired real/surrogate samples and a larger number of cheap surrogate-only samples. The main theoretical results are Theorem 1, which gives the variance of the control-variate estimator under an oracle coefficient beta_opt, and Theorem 2, which derives a closed-form expression for the number of paired samples needed to match a Monte Carlo confidence interval. The paper also proposes a learned metric correlator function (MCF) to increase correlation between surrogate and target metrics, and reports experiments in nuPlan, a neural-reconstruction AV simulator, and quadruped velocity tracking. The theoretical derivations for fixed beta are standard and correct, but the implemented algorithms estimate beta and the variance from the same finite samples, and the paper's advertised high-probability guarantees do not follow for this plug-in version.
Significance. If the results held for the actual implemented estimator, Sim2Val would be a practically useful technique for reducing real-world testing burdens in robotics validation. The oracle variance formula (Eq. 5) and the sample-efficiency formula (Eq. 6) are elegant and are likely to be of interest to the community; the experiments cover three distinct and relevant domains, and the variance reductions reported are nontrivial. However, the paper's central advertised claims--'provably reduces the variance' and 'achieves high-probability bounds'--are proven only for an oracle version that the experiments do not run. The gap between the oracle theory and the plug-in implementation is a load-bearing issue, though it appears fixable by either providing a conservative finite-sample bound for the plug-in estimator or by explicitly reframing the guarantees as asymptotic/CLT-based. The MCF extension is heuristic and is not covered by the theorems at all. With careful revision, the paper could make a solid contribution, but in its current form it substantially overclaims what is proven.
major comments (3)
- [Section 3.2, Algorithm 1, Appendix B] The high-probability confidence interval claimed in Algorithm 1 is not justified. Chebyshev's inequality requires the true variance of the estimator, but Algorithm 1 substitutes dVar(mu_hat(beta_hat)) computed from the same paired samples used to estimate beta_hat. Because beta_hat is chosen to minimize in-sample residuals, this plug-in variance tends to understate the variance of the implemented estimator, and the formula in Appendix B treats beta as fixed, ignoring the estimation error in beta_hat. Consequently, the abstract's claims of 'provably reduces the variance' and 'high-probability bounds' are supported only for the oracle beta_opt, not for the estimator whose results are reported in Section 4. The paper should either prove a conservative finite-sample bound for the plug-in estimator (e.g., via data splitting and an empirical-Bernstein inequality) or explicitly state that the reported intervals are approximate and CLT-based.
- [Appendix A, proof of Theorem 2, Eqs. (15)-(16)] There is a sign error in the algebra of the proof of Theorem 2. From Eq. (14), multiplying by (k+np)/delta yields np(k+np) = (k+np)V/(alpha^2 delta) - kV rho^2/(alpha^2 delta); the minus sign is missing in Eq. (15). Correspondingly, Eq. (16) should read nmin(k+nmin) = (k+nmin)nr - k nr rho^2. As printed with the plus signs, the quadratic gives nmin > nr for positive rho^2, which contradicts both the final formula Eq. (18) and the claimed monotonicity in rho^2. The final formula in Eq. (6) is correct once both sign errors are corrected, but the proof as written does not lead to that result.
- [Section 3.3, Algorithm 2] The variance-reduction benefits of the metric correlator function are not covered by Theorem 1 or Theorem 2. The MCF f_hat is a random fitted function, and its training error and the uncertainty in estimating rho_MCF are absent from the analysis. Equation (7) compares population quantities that are only available through plug-in estimates, and the reported sample-efficiency numbers for CV-MCF (e.g., Section 4.1's np,CV-MCF = 303 and Section 4.3's nmin = 145) therefore do not follow from the theorems. The paper should either provide a finite-sample treatment of the MCF (e.g., treating f_hat as fixed after data splitting and accounting for its estimation error) or clearly label the MCF results as heuristic and empirically validated only.
minor comments (5)
- [Throughout] The text should consistently distinguish the oracle version of the estimator (beta_opt known) from the plug-in version implemented in Algorithm 1; currently the abstract and introduction use 'provably' without this qualification.
- [Appendix B] The statement that using the same data to estimate beta_opt introduces only 'a very small bias' is informal; either provide a precise bound or cite a reference for the O(1/n) bias claim.
- [Section 3.2, Eq. (6)] Equation (6) gives nmin as a real number; the text should state that the required sample size is ceil(nmin), since the number of samples must be an integer.
- [Figures 4-8] The figures show averages over 10 random trials but do not include error bars; given that the plotted variance estimates are themselves random, error bars or a statement about trial-to-trial variability would improve interpretability.
- [References] Reference [7] is listed as 'Reference for Simulator, author and organization redacted for review'; this needs to be completed before publication.
Circularity Check
No significant circularity: the central variance-reduction and sample-efficiency derivations are self-contained and standard; only minor non-load-bearing self-citations appear.
full rationale
The paper's main claims rest on Theorems 1 and 2, which are derived from the stated sampling model in Section 3.1 plus standard control-variate algebra and Chebyshev's inequality. The oracle coefficient beta_opt, the estimator mu_hat_CV, and the variance formula in Eq. (5) are distinct objects; Eq. (5) is not defined in terms of the paper's conclusions, and no target result is baked into the assumptions. The empirical variance reductions and nmin computations use plug-in sample estimates of covariances and correlation, which is standard practice and is clearly labeled as such. These are conditional calculations rather than independent predictions, but they do not make the derivation circular. The paper does contain minor self-citations that are not load-bearing: the redacted simulator reference [7] and the trajectory-feature reference [20] support experimental ingredients, not the main theorems. The skeptical concern about Algorithm 1 substituting dVar into Chebyshev is a statistical validity gap (the bound requires the true variance), not a circularity, because the theorems are stated for the oracle setting and the plug-in behavior is a separate correctness issue. Overall, the derivation chain is self-contained and no prediction reduces by construction to its inputs.
Assumptions & free parameters
free parameters (4)
- beta_opt (control variate coefficient) =
estimated from paired samples in experiments
- rho^2 (correlation between surrogate and real metric) =
e.g., 0.79 (CV) and 0.83 (CV-MCF) for nuPlan ADE; 0.995 for AV closest distance
- nfit (paired samples consumed training MCF) =
113, 143, 50, 40, 0 across experiments
- MCF parameters (neural network weights) =
trained on Dfit
assumptions (5)
- domain assumption Paired samples and surrogate-only samples are independently and identically distributed from target distribution PX
- standard math Chebyshev's inequality provides a valid confidence interval
- domain assumption G and F have finite second moments and nontrivial correlation
- domain assumption The metric correlator function trained on Dfit generalizes to Dest and surrogate-only samples
- domain assumption F and G are observed on the same scenario X for paired samples
Cite this review
Pith. "Pith review of Sim2Val: Leveraging Correlation Across Test Platforms for Variance-Reduced Metric Estimation." pith.science (2026). https://pith.science/paper/IJHQ6RHV
@misc{pith2026250620553,
  author       = {Pith},
  title        = {Pith review of: Sim2Val: Leveraging Correlation Across Test Platforms for Variance-Reduced Metric Estimation},
  year         = {2026},
  howpublished = {\url{https://pith.science/paper/IJHQ6RHV}},
  note         = {Machine review of arXiv:2506.20553}
}
read the original abstract
Learning-based robotic systems demand rigorous validation to assure reliable performance, but extensive real-world testing is often prohibitively expensive, and if conducted may still yield insufficient data for high-confidence guarantees. In this work we introduce Sim2Val, a general estimation framework that leverages paired data across test platforms, e.g., paired simulation and real-world observations, to achieve better estimates of real-world metrics via the method of control variates. By incorporating cheap and abundant auxiliary measurements (for example, simulator outputs) as control variates for costly real-world samples, our method provably reduces the variance of Monte Carlo estimates and thus requires significantly fewer real-world samples to attain a specified confidence bound on the mean performance. We provide theoretical analysis characterizing the variance and sample-efficiency improvement, and demonstrate empirically in autonomous driving and quadruped robotics settings that our approach achieves high-probability bounds with markedly improved sample efficiency. Our technique can lower the real-world testing burden for validating the performance of the stack, thereby enabling more efficient and cost-effective experimental evaluation of robotic systems.
Figures

Figures from the paper (6 more)


Reference graph
Works this paper leans on
-
[1]
N. Kalra and S. M. Paddock. Driving to safety: How many miles of driving would it take to demonstrate autonomous vehicle reliability? Transportation Research Part A: Policy and Prac- tice, 94:182–193, 2016. ISSN 0965-8564. doi:https://doi.org/10.1016/j.tra.2016.09.010. URL https://www.sciencedirect.com/science/article/pii/S0965856416302129
-
[2]
Caesar, V
H. Caesar, V . Bankiti, A. H. Lang, S. V ora, V . E. Liong, Q. Xu, A. Krishnan, Y . Pan, G. Baldan, and O. Beijbom. nuscenes: A multimodal dataset for autonomous driving. In Proceedings of the IEEE/CVF conference on computer vision and pattern recognition , pages 11621–11631, 2020
2020
-
[3]
N. Karnchanachari, D. Geromichalos, K. S. Tan, N. Li, C. Eriksen, S. Yaghoubi, N. Mehdipour, G. Bernasconi, W. K. Fong, Y . Guo, et al. Towards learning-based planning: The nuplan benchmark for real-world autonomous driving. In 2024 IEEE International Conference on Robotics and Automation (ICRA), pages 629–636. IEEE, 2024
work page 2024
-
[4]
O. X.-E. Collaboration, A. O’Neill, A. Rehman, A. Gupta, A. Maddukuri, A. Gupta, A. Padalkar, A. Lee, A. Pooley, A. Gupta, A. Mandlekar, A. Jain, A. Tung, A. Bewley, A. Her- zog, A. Irpan, A. Khazatsky, A. Rai, A. Gupta, A. Wang, A. Kolobov, A. Singh, A. Garg, A. Kembhavi, A. Xie, A. Brohan, A. Raffin, A. Sharma, A. Yavary, A. Jain, A. Balakrishna, A. Wah...
- [5]
-
[6]
R. Urtasan. Simulator realism: The new safety stan- dard for the av industry, 2025. URL https://waabi.ai/ simulator-realism-the-new-safety-standard-for-the-av-industry/
work page 2025
-
[7]
Reference for Simulator, author and organization redacted for review
- [8]
Show all 24 references
-
[9]
Precup, R
D. Precup, R. S. Sutton, and S. Singh. Eligibility traces for off-policy policy evaluation. In ICML, volume 2000, pages 759–766. Citeseer, 2000
2000
-
[10]
Jiang and L
N. Jiang and L. Li. Doubly robust off-policy value evaluation for reinforcement learning. In International conference on machine learning, pages 652–661. PMLR, 2016
2016
-
[11]
Thomas and E
P. Thomas and E. Brunskill. Data-efficient off-policy policy evaluation for reinforcement learn- ing. In International conference on machine learning, pages 2139–2148. PMLR, 2016
2016
-
[12]
A. B. Owen. Monte Carlo theory, methods and examples. https://artowen.su.domains/ mc/, 2013
2013
-
[13]
A. N. Angelopoulos, S. Bates, C. Fannjiang, M. I. Jordan, and T. Zrnic. Prediction-powered inference. Science, 382(6671):669–674, 2023
2023
-
[14]
A. N. Angelopoulos, J. C. Duchi, and T. Zrnic. Ppi++: Efficient prediction-powered inference. arXiv preprint arXiv:2311.01453, 2023
2023 arXiv
-
[15]
Z. Zhou, Y . Song, and A. Zanette. Accelerating unbiased llm evaluation via synthetic feedback. arXiv preprint arXiv:2502.10563, 2025
2025 arXiv
-
[16]
Boyeau, A
P. Boyeau, A. N. Angelopoulos, N. Yosef, J. Malik, and M. I. Jordan. Autoeval done right: Using synthetic data for model evaluation. arXiv preprint arXiv:2403.07008, 2024
2024 arXiv
-
[17]
Dauner, M
D. Dauner, M. Hallgarten, T. Li, X. Weng, Z. Huang, Z. Yang, H. Li, I. Gilitschenski, B. Ivanovic, M. Pavone, et al. Navsim: Data-driven non-reactive autonomous vehicle sim- ulation and benchmarking. Advances in Neural Information Processing Systems , 37:28706– 28719, 2024
2024
-
[18]
K. T. e. a. H. Caesar, J. Kabzan. Nuplan: A closed-loop ml-based planning benchmark for autonomous vehicles. In CVPR ADP3 workshop, 2021
2021
-
[19]
Treiber, A
M. Treiber, A. Hennecke, and D. Helbing. Congested traffic states in empirical observa- tions and microscopic simulations. Physical review. E, Statistical physics, plasmas, flu- ids, and related interdisciplinary topics , 62 2 Pt A:1805–24, 2000. URL https://api. semanticschol...
2000
-
[20]
on intersection,
W. Ding, S. Veer, K. Leung, Y . Cao, and M. Pavone. Surprise potential as a measure of interactivity in driving scenarios. arXiv preprint arXiv:2502.05677, 2025. 11 A Proofs Proof of Theorem 1 . We start by deriving the variance of the control variate estimator for fixedβ. Var...
2025 arXiv
-
[21]
Initialize the quadruped at zero velocity
-
[22]
Deploy the reinforcement learning policy with the command velocity X
-
[23]
, T, where T = 100 given a 50 Hz sampling rate
Allow the policy to run on the quadruped for two seconds, recording the actual velocity at each timestep as X (t), for t = 1, . . . , T, where T = 100 given a 50 Hz sampling rate
-
[24]
(19) We conducted n = 200 paired simulation-real-world evaluations of η, supplemented by k = 400 simulation-only evaluations
Compute the average relative velocity tracking error: η = 1 T TX t=1 ∥X (t) − X∥ ∥X∥ . (19) We conducted n = 200 paired simulation-real-world evaluations of η, supplemented by k = 400 simulation-only evaluations. To train the MCF, we used a simple multilayer perceptron (MLP) t...
Reviewed August 6, 2026 · model on record in the stance chip above.
Discussion (0). Continue with ORCID to comment.