REVIEW 2 major objections 5 minor 75 references
The VLA Frontier Fields Survey: A 6GHz High-resolution Radio Survey of Abell2744
T0 review · 2 major / 5 minor · reviewed 2026-08-06 · deepseek-v4-flash
Pith's one-line read The deepest 6 GHz image of Abell 2744 reveals radio star formation rates ten times higher than optical estimates.
desk verdict A genuinely useful deep 6 GHz catalog of Abell 2744, but the printed SFR equation has a k-correction sign error that contradicts the paper's own table. read the letter →
The pith
A machine-rendered reading of the paper's core claim, the machinery that carries it, and where it could break.
The reading
What carries the argument
The argument runs on the far-infrared--radio correlation: synchrotron and free-free radio emission trace supernova remnants and H II regions arising from massive stars, so 6 GHz luminosity can be converted to an SFR through the Murphy et al. (2017) calibration normalized to a Chabrier IMF, with luminosity k-corrected using a spectral index $\alpha=-0.7$ for sources without multi-band detections. Source extraction uses PyBDSF on the pre-primary-beam-corrected map with a 5-$\sigma$ peak threshold, and reliability is checked by counting negative sources. For the Little Red Dots, mean and median stacking of 23 thumbnails reduces the noise to about 200 nJy per beam, and the magnification-corrected 3-$\sigma$ limit is translated to a rest-frame luminosity with an assumed spectral index of $\alpha=0.7$.
What would settle it
Measure spectral indices for the C-band-only sources using deeper L- and S-band observations at matched resolution: if the median $\alpha$ is flatter than $-0.7$ or a substantial fraction of the 46 counterparts show AGN signatures (compact cores, X-ray excess), the inferred radio SFRs and the reported factor-of-ten gap would shrink. Alternatively, compare radio SFRs with dust-corrected H-$\alpha$ or far-infrared SFRs for the same galaxies; if those agree with the UV/NIR values, dust obscuration alone is not the explanation.
Extended reading notes
Core claim
The central claim is that the new 6 GHz VLA image of Abell 2744, with roughly $1\,\mu\mathrm{Jy\,beam^{-1}}$ noise at $0.82''$ resolution, detects 93 radio sources at peak signal-to-noise $\geq 5$, of which 46 have JWST/HST counterparts with redshifts, magnifications, and stellar masses. For these galaxies, the radio-derived star formation rates exceed the SED-based optical/NIR SFRs by factors of 5 to 50, with a median factor near 10, and exceed rest-frame $u$-band SFRs by a factor of about 50. The paper attributes this discrepancy to strong dust obscuration, arguing that the radio emission traces the obscured star formation that UV-to-NIR tracers cannot see. In addition, none of the 23 Little Red Dots are individually detected, and stacking yields a $3\sigma$ upper limit of $4.1\times 10^{39}\,\mathrm{erg\,s^{-1}}$ on their rest-frame 6 GHz radio luminosity.
Load-bearing premise
The factor-of-ten SFR discrepancy rests on the assumption that every 6 GHz detection that survives the AGN cuts is powered mainly by star formation, and that the adopted radio-to-SFR calibration with a spectral index of $\alpha=-0.7$ converts its luminosity into the true star formation rate.
Editorial extensions
If this is right
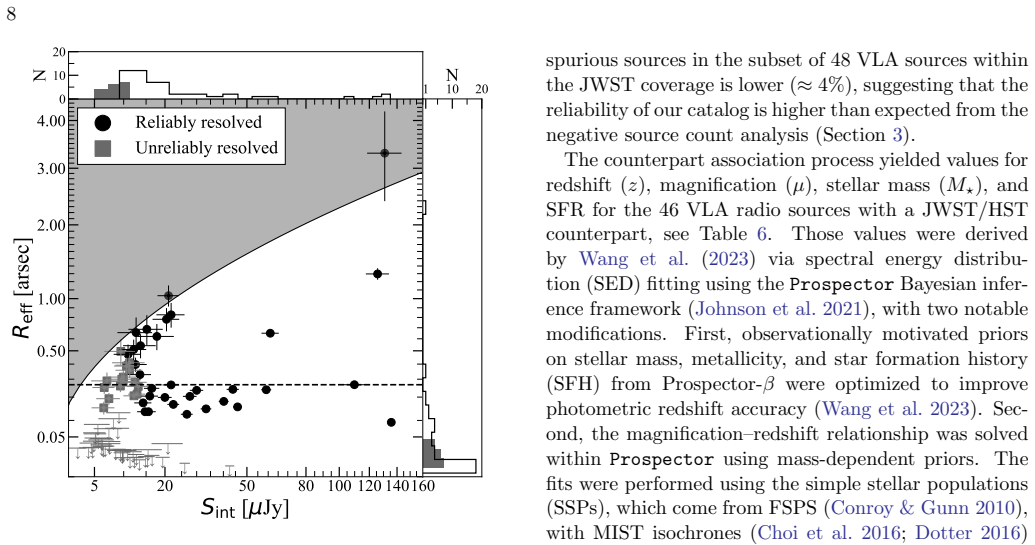
- The 6 GHz catalog provides 93 radio sources with a median effective radius of $0.267''$ and a median flux density of $14.7\,\mu$Jy, the deepest census of radio emission in Abell 2744 to date.
- If the radio SFRs are correct, then UV-to-NIR SED fitting systematically underestimates star formation in massive galaxies out to $z\approx3.5$, meaning a substantial fraction of cosmic star formation is obscured.
- Nine of the 46 counterparts are AGN candidates, giving an AGN fraction of about 20 percent, broadly consistent with expectations for microjansky-level radio surveys.
- Stacking 23 Little Red Dots places a $3\sigma$ upper limit of $4.1\times 10^{39}\,\mathrm{erg\,s^{-1}}$ on their rest-frame 6 GHz luminosity, comparable to limits in other fields but still above the range expected from X-ray constraints.
- The 22 moderately and strongly lensed galaxies in the VLA Frontier Fields survey occupy a lower specific star formation rate regime than extreme starburst samples, offering a view of more typical main-sequence galaxies at $z\approx1-2$.
Reading between the lines
- If the factor-of-ten SFR discrepancy holds for this massive population, then cosmic star formation rate densities derived from UV/optical surveys at $z\sim1-3$ may be systematically low in the high-mass regime.
- Because most sources lack measured spectral indices, the assumed $\alpha=-0.7$ dominates the luminosity conversion; multifrequency follow-up would turn the discrepancy from a claim into a measured quantity.
- The Little Red Dots stacking limit is still above the X-ray-inferred expectation of $10^{37-39}\,\mathrm{erg\,s^{-1}}$, so deeper radio observations aimed at a handful of LRDs could discriminate between AGN and starburst interpretations.
- Combining gravitational lensing with microjansky radio surveys appears to open a niche for resolved studies of main-sequence galaxies, complementing both unlensed deep fields and the more extreme starburst lens samples.
Editorial analysis
A structured set of objections, weighed in public.
Referee Report
Summary. This paper presents new VLA C-band continuum imaging of the cluster Abell 2744, reaching an rms noise of about 1 microJy per beam at 0.82 arcsecond resolution. The authors extract 93 radio sources, associate 46 of them with UNCOVER HST/JWST counterparts, derive radio-based star formation rates using the Murphy et al. (2017) 1.4 GHz calibration with k-corrections, and report that the radio SFRs exceed UV-to-NIR SFRs by roughly an order of magnitude. They also stack 23 Little Red Dots to derive a 3-sigma upper limit on their 6 GHz radio luminosity and compile a sample of 22 moderately and strongly lensed galaxies. The data reduction, source extraction, negative-noise purity test, and catalog presentation are careful, and the public data products are a useful community resource.
Significance. The survey products are valuable: this is the deepest high-resolution radio image of A2744 to date, with quantified spurious-source contamination via the inverted-image test. The factor-of-ten radio-to-UV SFR excess, if correct, strengthens the case that heavily obscured star formation dominates in massive z~1-3 galaxies, and the LRD stacking limit is a meaningful constraint at z~6. However, the printed SFR calibration equation is internally inconsistent with the stated spectral-index convention, so the central quantitative claim is not reproducible as written. This issue must be fixed and the SFR table verified before the paper can be accepted.
major comments (2)
- [Section 5.4, Eq. (8)] Equation (8) is written with exponents that contradict the convention S_nu proportional to nu^alpha with alpha approximately -0.7 stated in the text. Under the stated convention, the correct k-correction is L_1.4 = 4 pi D_L^2 (1+z)^{-(1+alpha)} (1.4/6)^alpha S_6, whereas the printed equation has (1+z)^{-(1-alpha)} (1.4/6)^{-alpha}. This is not a stylistic difference: applying the printed equation to source N.40 (z=0.303, S6=22 microJy, alpha=-0.75) gives SFR_6GHz approximately 0.7 M_sun/yr, while Table 6 lists 9 +/- 1 M_sun/yr. The tabulated value is recovered only if the sign of alpha is effectively reversed in Eq. (8). Please correct the equation or the convention, and verify that all entries in Table 6 follow from the corrected formula.
- [Section 5.4 and Table 6] The error bars quoted for SFR_6GHz in Table 6 appear to include only flux-density uncertainties; for example, N.40 has 9 +/- 1 M_sun/yr from S6 = 22 +/- 2 microJy. The text states that an intrinsic spectral-index dispersion of 0.1 was considered for C-band-only sources and that photometric-redshift errors were included, but no propagation through Eqs. (7)-(8) is shown. Since 37 of the 46 sources lack measured spectral indices, please propagate sigma_alpha = 0.1 through the SFR calculation for all sources and state how the median radio-to-UV SFR ratio changes. This is needed to assess whether the reported order-of-magnitude excess is robust to the assumed alpha.
minor comments (5)
- [Section 3.1] The text gives the resolved-source criterion as phi_M - theta_1/2 < 2 sigma_phiM, but the Table 5 note and the surrounding discussion use phi_M - theta_1/2 >= 2 sigma_phiM; please make the inequality consistent.
- [Section 5.6] The phrase 'adopting a typical radio spectral index of alpha = 0.7' uses the opposite sign convention from the rest of the paper, which defines alpha approximately -0.7 with S_nu proportional to nu^alpha; unify the convention so the LRD luminosity limit is reproducible.
- [Section 5.6 and Summary] The summary attributes the 23 stacked LRDs to Gloudemans et al. (2025), whereas Section 5.6 states that the Kocevski et al. (2024) catalog was used; please clarify which source list was stacked.
- [Section 5.1] The text describes N.62 with mu = 9.88 and SFR_6GHz = 180 +50/-40 M_sun/yr, while Table 6 lists mu = 9.27 and SFR_6GHz = 282 +/- 54 M_sun/yr; reconcile the text and table for this highlighted source.
- [Section 1] The Introduction says that results are summarized in Section 5, but the summary appears in Section 6; update the cross-reference.
Circularity Check
No significant circularity: the 6 GHz catalog, SFR comparison, and LRD stacking limit rest on external catalogs and calibrations, with no fitted parameter disguised as a prediction.
full rationale
The paper's central claims are new observational products: the 6 GHz image, source catalog, and stacked LRD limit. The derived SFRs come from external calibrations (Murphy et al. 2017 for radio, Hopkins et al. 2003 for u-band), and the UNCOVER photometric redshifts, magnifications, stellar masses, and SED-based SFRs are taken from the public Wang et al. (2023)/Weaver et al. (2024) catalog, not fitted here. The AGN-exclusion diagnostics use external X-ray, Herschel, and IR-radio correlation information, and the assumed alpha = -0.7 for single-band sources cites external literature. The LRD stacking upper limit is obtained by crossmatching an external LRD catalog and stacking non-detections; it is not used as an input elsewhere. Thus no equation defines a derived quantity in terms of a parameter fitted in this paper, and no 'prediction' reduces to the paper's own inputs by construction. The skeptic's concern about Eq. 8 is a reproducibility or internal-consistency problem (the printed k-correction appears inconsistent with the stated alpha convention and with Table 6), not circularity, so it does not increase the circularity score.
Assumptions & free parameters
free parameters (3)
- PyBDSF peak and island detection thresholds =
thresh_pix = 5, thresh_isl = 3
- Counterpart search radius =
0.5 arcsec
- Canonical radio spectral index for C-band-only sources =
alpha = -0.7, dispersion 0.1
assumptions (4)
- domain assumption The far-infrared-radio correlation and the Murphy et al. (2017) calibration convert 6 GHz luminosity into star formation rate.
- domain assumption UNCOVER photometric redshifts, stellar masses, magnifications, and SED star formation rates from Wang et al. (2023) and Weaver et al. (2024) are sufficiently accurate.
- domain assumption PyBDSF source extraction with negative-map counting and visual inspection correctly separates real sources from artifacts.
- domain assumption The Kocevski et al. (2024) catalog correctly identifies and positions the 23 Little Red Dots used for stacking.
Cite this review
Pith. "Pith review of The VLA Frontier Fields Survey: A 6GHz High-resolution Radio Survey of Abell2744." pith.science (2026). https://pith.science/paper/I227EMR7
@misc{pith2026250620634,
  author       = {Pith},
  title        = {Pith review of: The VLA Frontier Fields Survey: A 6GHz High-resolution Radio Survey of Abell2744},
  year         = {2026},
  howpublished = {\url{https://pith.science/paper/I227EMR7}},
  note         = {Machine review of arXiv:2506.20634}
}
abstract
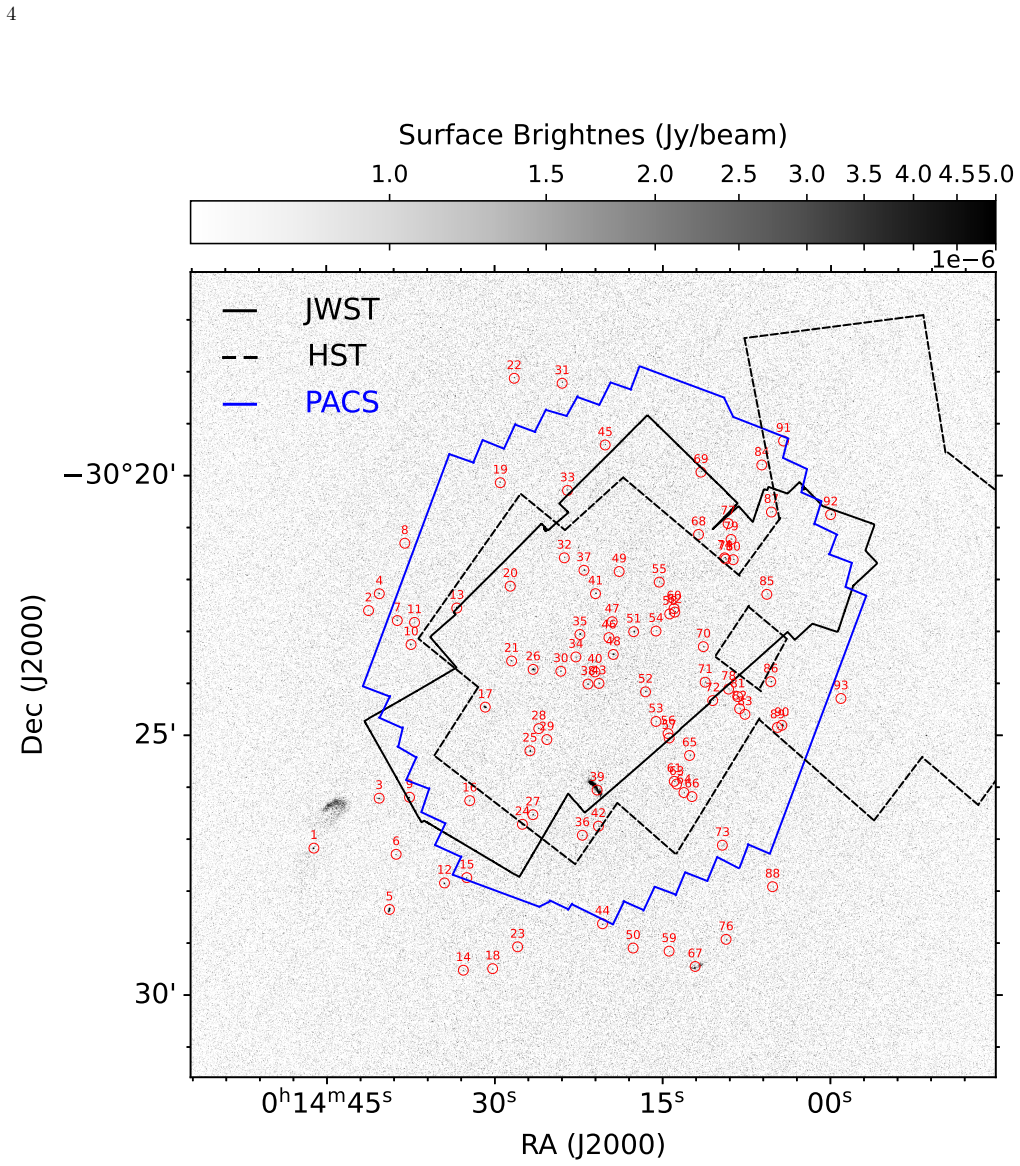
We present 6GHz radio continuum observations of the galaxy cluster Abell 2744 ($z = 0.307$) obtained with the Karl G. Jansky Very Large Array (VLA) as part of the VLA Frontier Fields program, the goal of which is to explore the radio continuum emission from high-redshift galaxies that are magnified by foreground massive galaxy clusters. With an rms noise of $\approx 1 \mu$Jy beam$^{-1}$, in the image plane, and sub-arcsec angular resolution ($\theta_{1/2}=0.82''$), this is the deepest and most detailed radio image of Abell 2744 ever obtained. A total of 93 sources is detected with a peak signal-to-noise ratio $\geq5$, of which 46 have optical/near-infrared (IR) counterparts with available redshift, magnification ($\mu$), and stellar mass (${M}_*$) estimates. The radio sources are distributed over a redshift of 0.15 to 3.55, with a median redshift value of $z = 0.93^{+1.48}_{-0.63}$ and with a range mass from $5.5\times 10^{9} \,\rm{M}_{\odot}$ to $1.3\times 10^{11} \,\rm{M}_{\odot}$. A comparison between the radio-based star formation rates (SFRs) and those derived from ultraviolet-to-near IR data reveals that radio SFRs are typically an order of magnitude higher. This discrepancy is likely a result of strong dust obscuration affecting the UV-to-NIR tracers. We look for radio counterparts of the so-called ``Little Red Dots (LRDs)'' galaxies at $z\approx6$ seen behind Abell 2744, but find no significant detections. After stacking, we derive a 3$\sigma$ upper limit to the 6GHz radio luminosity of LRDs of $4.1\times 10^{39}\,\rm erg\,s^{-1}$. Finally, we present a sample of 22 moderately/strongly lensed galaxies ($\mu \gtrsim 2$) in the VLA Frontier Fields survey, which provides a zoomed view of the star formation processes within main sequence galaxies at $z\approx 1-2$.
Figures

Figures from the paper (10 more)


Reference graph
Works this paper leans on
-
[1]
Algera, H., Smail, I., Dudzeviˇ ci¯ ut˙ e, U., et al. 2020, ApJ, 903, 138
work page 2020
-
[2]
Ananna, T. T., Bogd´ an,´A., Kov´ acs, O. E., Natarajan, P., & Hickox, R. C. 2024, ApJL, 969, L18
work page 2024
-
[3]
C., Ciesla, L., Ilbert, O., et al
Arango-Toro, R. C., Ciesla, L., Ilbert, O., et al. 2023, A&A, 675, A126, doi: 10.1051/0004-6361/202345848
-
[4]
Barro, G., P´ erez-Gonz´ alez, P. G., Kocevski, D. D., et al. 2024, ApJ, 963, 128
work page 2024
-
[5]
Bean, B., Bhatnagar, S., Castro, S., et al. 2022, PASP, 134, 114501
work page 2022
-
[6]
E., et al
Bezanson, R., Labbe, I., Whitaker, K. E., et al. 2024, ApJ, 974, 92
2024
-
[7]
R., Brinkmann, J., Csabai, I., et al
Blanton, M. R., Brinkmann, J., Csabai, I., et al. 2003, AJ, 125, 2348
2003
-
[8]
Bonaldi, A., Bonato, M., Galluzzi, V., et al. 2019, MNRAS, 482, 2
work page 2019
Show all 75 references
-
[9]
2020, ApJ, 902, 112
Bouwens, R., Gonz´ alez-L´ opez, J., Aravena, M., et al. 2020, ApJ, 902, 112
2020
-
[10]
2003, MNRAS, 344, 1000
Bruzual, G., & Charlot, S. 2003, MNRAS, 344, 1000
2003
-
[11]
2001, PASP, 113, 1449
Calzetti, D. 2001, PASP, 113, 1449
2001
-
[12]
C., Smail, I., Blain, A., & Ivison, R
Chapman, S. C., Smail, I., Blain, A., & Ivison, R. 2004, ApJ, 614, 671
2004
-
[13]
L., et al
Chen, W., Kelly, P., Treu, T. L., et al. 2022, JWST Proposal. Cycle 1, 2756
2022
-
[14]
2016, ApJ, 823, 102 Condon
Choi, J., Dotter, A., Conroy, C., et al. 2016, ApJ, 823, 102 Condon. 1992, ARA&A, 30, 575
2016
-
[15]
Conroy, C., & Gunn, J. E. 2010, ApJ, 712, 833
2010
-
[16]
2019, JOSS, 4, 1317
Davidson-Pilon, C. 2019, JOSS, 4, 1317
2019
-
[17]
2017, A&A, 602, A4
Delhaize, J., Smolˇ ci´ c, V., Delvecchio, I., et al. 2017, A&A, 602, A4
2017
-
[18]
T., & Li, A
Draine, B. T., & Li, A. 2007, ApJ, 657, 810 Dudzeviˇ ci¯ ut˙ e, U., Smail, I., Swinbank, A., et al. 2020, MNRAS, 494, 3828
2007
-
[19]
2010, PASP, 122, 499
Eales, S., Dunne, L., Clements, D., et al. 2010, PASP, 122, 499
2010
-
[20]
N., & Civano, F
Evans, I. N., & Civano, F. 2018, A&G, 59, 2
2018
-
[21]
D., & Nelson, P
Feigelson, E. D., & Nelson, P. I. 1985, ApJ, 293, 192
1985
-
[22]
2023, arXiv preprint arXiv:2309.07834
Fujimoto, S., Bezanson, R., Labbe, I., et al. 2023, arXiv preprint arXiv:2309.07834
2023 arXiv
-
[23]
2024, Astronomy & Astrophysics, 691, A299
Gillman, S., Smail, I., Gullberg, B., et al. 2024, Astronomy & Astrophysics, 691, A299
2024
-
[24]
J., Duncan, K
Gloudemans, A. J., Duncan, K. J., Eilers, A.-C., et al. 2025, AAS, 986, 130 G´ omez-Guijarro, C., Elbaz, D., Xiao, M., et al. 2022, A&A, 658, A43 Gonz´ alez-L´ opez, J., Novak, M., Decarli, R., et al. 2020, ApJ, 897, 91 Gonz´ alez-L´ opez, Bauer, F. E., Romero-Ca˜ nizales, C.,...
2025
-
[25]
E., Labbe, I., Goulding, A
Greene, J. E., Labbe, I., Goulding, A. D., et al. 2024, ApJ, 964, 39
2024
-
[26]
2023, ApJ, 959, 39
Harikane, Y., Zhang, Y., Nakajima, K., et al. 2023, ApJ, 959, 39
2023
-
[27]
1985, ApJ, 298, L7
Helou, G., Soifer, B., & Rowan-Robinson, M. 1985, ApJ, 298, L7
1985
-
[28]
2021, ApJ, 910, 105
Heywood, I., Murphy, E., Jim´ enez-Andrade, E., et al. 2021, ApJ, 910, 105
2021
-
[29]
M., Miller, C., Nichol, R., et al
Hopkins, A. M., Miller, C., Nichol, R., et al. 2003, ApJ, 599, 971
2003
-
[30]
D., Akritas, M
Isobe, T., Feigelson, E. D., Akritas, M. G., & Babu, G. J. 1990, ApJ, 364, 104 Jim´ enez-Andrade, E., Murphy, E., Heywood, I., et al. 2021, ApJ, 910, 106
1990
-
[31]
D., Leja, J., Conroy, C., & Speagle, J
Johnson, B. D., Leja, J., Conroy, C., & Speagle, J. S. 2021, ApJ, 254, 22
2021
-
[32]
S., Yun, M
Kamieneski, P. S., Yun, M. S., Harrington, K. C., et al. 2024, ApJ, 961, 2
2024
-
[33]
L., & Meier, P
Kaplan, E. L., & Meier, P. 1958, JASA, 53, 457
1958
-
[34]
2018, A&A, 611, A55
Klein, U., Lisenfeld, U., & Verley, S. 2018, A&A, 611, A55
2018
-
[35]
D., Onoue, M., Inayoshi, K., et al
Kocevski, D. D., Onoue, M., Inayoshi, K., et al. 2023, ApJL, 954, L4
2023
-
[36]
D., Finkelstein, S
Kocevski, D. D., Finkelstein, S. L., Barro, G., et al. 2024, arXiv preprint arXiv:2404.03576 Labb´ e, I., van Dokkum, P., Nelson, E., et al. 2023, Nature, 616, 266 Labb´ e, I., Greene, J. E., Bezanson, R., et al. 2024, ApJ, 978, 92
2024 arXiv
-
[37]
C., Thompson, T
Lacki, B. C., Thompson, T. A., & Quataert, E. 2010, ApJ, 717, 1, doi: 10.1088/0004-637X/717/1/1
2010 doi
-
[38]
J., Ilbert, O., et al
Laigle, C., McCracken, H. J., Ilbert, O., et al. 2016, ApJ, 224, 24
2016
-
[39]
E., Troncoso-Iribarren, P., et al
Laporte, Bauer, F. E., Troncoso-Iribarren, P., et al. 2017, A&A, 604, A132
2017
-
[40]
K., Schinnerer, E., Liu, D., et al
Leslie, S. K., Schinnerer, E., Liu, D., et al. 2020, ApJ, 899, 58
2020
-
[41]
M., Harrington, K
Liu, D., F¨ orster Schreiber, N. M., Harrington, K. C., et al. 2024, Nat. Astron., 8, 1181 Lo Faro, B., Silva, L., Franceschini, A., Miller, N., &
2024
-
[42]
2015, MNRAS, 447, 3442, doi: 10.1093/mnras/stu2593
Efstathiou, A. 2015, MNRAS, 447, 3442, doi: 10.1093/mnras/stu2593
2015 doi
-
[43]
e., Koekemoer, A., Coe, D., et al
Lotz, J. e., Koekemoer, A., Coe, D., et al. 2017, ApJ, 837, 97
2017
-
[44]
2011, A& A, 532, A90
Lutz, D., Poglitsch, A., Altieri, B., et al. 2011, A& A, 532, A90
2011
-
[45]
H., Spilker, J., et al
Ma, J., Gonzalez, A. H., Spilker, J., et al. 2015, ApJ, 812, 88 25
2015
-
[46]
2015, A&A, 573, A45
Magnelli, B., Ivison, R., Lutz, D., et al. 2015, A&A, 573, A45
2015
-
[47]
2025, MNRAS, 538, 1921
Maiolino, R., Risaliti, G., Signorini, M., et al. 2025, MNRAS, 538, 1921
2025
-
[48]
2017, ApJ, 842, 95
Mancuso, C., Lapi, A., Prandoni, I., et al. 2017, ApJ, 842, 95
2017
-
[49]
P., Brammer, G., et al
Matthee, J., Naidu, R. P., Brammer, G., et al. 2024, ApJ, 963, 129
2024
-
[50]
2024, arXiv preprint arXiv:2412.04224
Mazzolari, G., Gilli, R., Maiolino, R., et al. 2024, arXiv preprint arXiv:2412.04224
2024
-
[51]
2015, ASCL, 1502
Mohan, N., & Rafferty, D. 2015, ASCL, 1502
2015
-
[52]
M., et al
Moretti, A., Radovich, M., Poggianti, B. M., et al. 2022, ApJ, 925, 4
2022
-
[53]
2008, ApJ, 678, 828
Murphy, E., Helou, G., Kenney, J., Armus, L., & Braun, R. 2008, ApJ, 678, 828
2008
-
[54]
Murphy, E. J. 2009, ApJ, 706, 482
2009
-
[55]
J., Momjian, E., Condon, J
Murphy, E. J., Momjian, E., Condon, J. J., et al. 2017, ApJ, 839, 35
2017
-
[56]
J., Helou, G., Braun, R., et al
Murphy, E. J., Helou, G., Braun, R., et al. 2006, ApJ, 651, L111
2006
-
[57]
2010, A&A, 518, L5
Nguyen, H., Schulz, B., Levenson, L., et al. 2010, A&A, 518, L5
2010
-
[58]
1988, PASP, 100, 1354
Olowin, R. 1988, PASP, 100, 1354
1988
-
[59]
Paul, S., Salunkhe, S., Datta, A., & Intema, H. T. 2019, MNRAS, 489, 446
2019
-
[60]
2017, ApJ, 845, 81
Pearce, C., Van Weeren, R., Andrade-Santos, F., et al. 2017, ApJ, 845, 81
2017
-
[61]
2025, A&A, 693, L2
Perger, K., Fogasy, J., Frey, S., & Gab´ anyi, K. 2025, A&A, 693, L2
2025
-
[62]
F., Barthel, P., Thomson, A., et al
Radcliffe, J. F., Barthel, P., Thomson, A., et al. 2021, A&A, 649, A27
2021
-
[63]
2021, MNRAS, 505, 480
Rahaman, M., Raja, R., Datta, A., et al. 2021, MNRAS, 505, 480
2021
-
[64]
2016, MNRAS, 459, 1626
Rawle, T., Altieri, B., Egami, E., et al. 2016, MNRAS, 459, 1626
2016
-
[65]
2020, ApJ, 902, 78
Reuter, C., Vieira, J., Spilker, J., et al. 2020, ApJ, 902, 78
2020
-
[66]
P., Tollerud, E
Robitaille, T. P., Tollerud, E. J., Greenfield, P., et al. 2013, A&A, 558, A33
2013
-
[67]
1991, MNRAS, 252, 19 Smolˇ ci´ c, V., Novak, M., Bondi, M., et al
Smail, I., Ellis, R., Fitchett, M., et al. 1991, MNRAS, 252, 19 Smolˇ ci´ c, V., Novak, M., Bondi, M., et al. 2017, A&A, 602, A1
1991
-
[68]
L., Jauzac, M., Acebron, A., et al
Steinhardt, C. L., Jauzac, M., Acebron, A., et al. 2020, ApJ, 247, 64
2020
-
[69]
2022, ApJ, 935, 110 Van Weeren, R., Ogrean, G., Jones, C., et al
Treu, T., Roberts-Borsani, G., Bradac, M., et al. 2022, ApJ, 935, 110 Van Weeren, R., Ogrean, G., Jones, C., et al. 2016, ApJ, 817, 98
2022
-
[70]
2023, ApJ, 270, 12
Wang, B., Leja, J., Labb´ e, I., et al. 2023, ApJ, 270, 12
2023
-
[71]
L., et al
Wang, B., De Graaff, A., Davies, R. L., et al. 2025, ApJ, 984, 121
2025
-
[72]
R., Cutler, S
Weaver, J. R., Cutler, S. E., Pan, R., et al. 2024, ApJ, 270, 7
2024
-
[73]
M., Lutz, D., et al
Wuyts, S., F¨ orster Schreiber, N. M., Lutz, D., et al. 2011, ApJ, 738, 106, doi: 10.1088/0004-637X/738/1/106
2011 doi
-
[74]
T., et al
Yue, M., Eilers, A.-C., Ananna, T. T., et al. 2024, ApJL, 974, L26
2024
-
[75]
2021, ApJ, 909, 165
Zavala, J., Casey, C., Manning, S., et al. 2021, ApJ, 909, 165
2021
Reviewed August 6, 2026 · model on record in the stance chip above.
Discussion (0). Sign in to comment.