REVIEW 3 major objections 4 minor 1 cited by
ALMA Observations of Molecular Complexity in the Large Magellanic Cloud: Probing the Star-forming Region N160
T0 review · 3 major / 4 minor · reviewed 2026-08-06 · deepseek-v4-flash
Pith's one-line read ALMA observations identify N160A-mmA as a bona fide hot core in the Large Magellanic Cloud, the eighth found in the LMC.
desk verdict A credible new LMC hot core detection that grows a very small sample; the temperature evidence is solid, but the density criterion is soft and the LTE/optically-thin assumptions are untested for the hot source. read the letter →
The pith
A machine-rendered reading of the paper's core claim, the machinery that carries it, and where it could break.
The reading
What carries the argument
The central machinery is rotational diagram analysis combined with full spectral modeling in XCLASS. Rotational diagrams assume the observed lines are optically thin and in local thermodynamic equilibrium, allowing a fit of ln(N_u/g_u) versus E_u/k to yield a rotational temperature and total column density. XCLASS then fits the full spectra with radiative-transfer models, using the rotational diagram results as initial estimates, and Monte Carlo noise resampling provides parameter uncertainties. H2 column densities are derived from dust continuum at 870 um and 1.2 mm using the Kauffmann et al. (2008) relation, with gas-to-dust scaling appropriate for the LMC, and deconvolved source sizes are computed from the 50%-peak continuum contours.
What would settle it
Measure the 13CH3OH or CH318OH isotopologue lines for the same methanol transitions toward N160A-mmA; if the optical-depth-corrected rotational temperature falls below 100 K, the hot-core classification would collapse.
Extended reading notes
Core claim
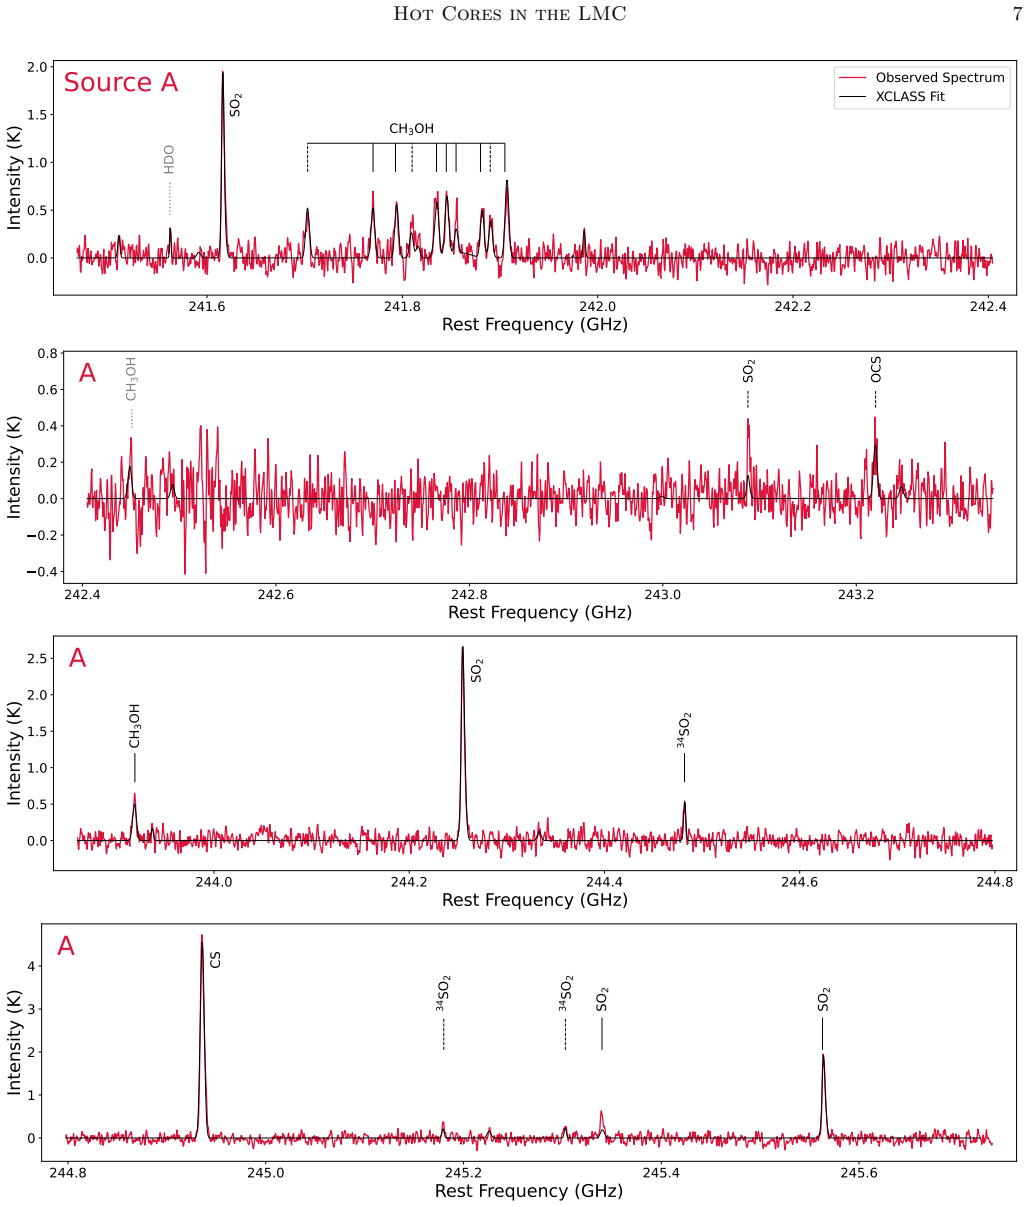
The paper's central claim is that N160A-mmA, the brightest of six 1.2 mm continuum sources in the ALMA field N160A-mm, is a bona fide hot core. This classification rests on three measured properties: a deconvolved source size of 0.09 pc, an H2 number density of 6.3e5 $cm^{-3}$, and rotational temperatures above 100 K for both CH3OH (188 K) and SO2 (178 K) as determined through rotational diagram analysis and XCLASS spectral modeling. The detection of the complex organic molecules CH3OH and CH3CN, together with a chemically rich spectrum including SO2, SO, H13CN, SiO, and other species commonly seen in Galactic hot cores, supports the identification. The authors further report that this hot core is associated with an ultracompact H II region, water/methanol/OH masers, and a hub-filament system, and they place its molecular abundances in the context of the seven previously known LMC hot cores and two SMC hot cores.
Load-bearing premise
The hot-core classification depends on the assumption that the methanol and sulfur dioxide lines are optically thin and that the gas is in local thermodynamic equilibrium, so the derived rotational temperatures reflect the true gas temperature.
Editorial extensions
If this is right
- The number of known extragalactic hot cores rises to ten (eight in the LMC, two in the SMC), giving a slightly larger sample for studying complex organic molecule formation at sub-solar metallicity.
- N160A-mmA is the first hot core with COMs found outside the LMC's stellar bar, in the molecular ridge thought to be affected by the LMC-SMC tidal interaction, offering a concrete test of the idea that infalling low-metallicity gas suppresses methanol production.
- The paper's abundance comparisons show that CH3OH varies by more than an order of magnitude across LMC/SMC hot cores while SO2 and SO vary much less, reinforcing the interpretation that methanol forms on grains in the cold prestellar phase and is sensitive to prior environmental conditions.
- The three cold cores in the field (C, D, and E) show methanol at temperatures below 30 K, indicating non-thermal desorption mechanisms or low-binding-energy surface sites must be releasing methanol into the gas.
- The kinematic complexity and broad lines toward N160A-mmA, along with its position at intersecting filaments, suggest that the hot core is the most massive member of a protocluster forming at a hub-filament junction.
Reading between the lines
- The CH3CN rotational temperature (84 K) is substantially lower than the CH3OH temperature (188 K); if confirmed with additional transitions, this could indicate sub-thermal excitation or a separate cooler gas component, and high-resolution observations of more CH3CN lines would test whether the chemistry is fully thermalized in the hot core.
- The H2 number density of 6.3e5 cm^-3 is below the canonical 10^6 cm^-3 hot-core threshold; accepting this classification would either require relaxing that criterion at low metallicity or suggest that the density estimate is diluted by the beam, a testable distinction with higher-resolution observations.
- The tentative HDO detection, if confirmed, would make N160A-mmA the third extragalactic hot core with deuterated water; a deeper integration targeting multiple HDO lines could validate this rare signature.
- The filament-hub morphology around the hot core invites a kinematic study of infall and outflow; measuring velocity gradients along the filaments could test whether the protocluster formed by filament convergence, as the paper suggests.
Editorial analysis
A structured set of objections, weighed in public.
Referee Report
Summary. The paper reports ALMA Band 6 (about 1.2 mm) continuum and molecular line observations of the LMC star-forming region N160, targeting the field N160A-mm. Six continuum sources are identified; CH3OH is detected toward four of them and CH3CN toward the brightest source, N160A-mmA. Rotational-diagram analysis (Eqs. 1-2) and XCLASS spectral modeling are used to derive rotational temperatures and column densities. The authors report T_rot(CH3OH)=188 K and T_rot(SO2)=178 K for source A, a deconvolved size of 0.09 pc, and n_H2=6.3e5 cm^-3, and on this basis classify N160A-mmA as a bona fide hot core, the eighth in the LMC. The paper then compares molecular abundances with previously known Magellanic and Galactic hot cores and discusses the environmental implications.
Significance. If the hot-core identification is secure, the result is significant: it expands the very small extragalactic hot-core sample, adds a source outside the LMC bar in the tidally affected Molecular Ridge, and provides abundance trends (large CH3OH scatter, smaller SO/SO2 scatter) that can be tested by astrochemical models. The paper has clear strengths: explicit line-detection criteria with tentative detections flagged, transparent rotational diagrams with uncertainties, Monte Carlo error propagation for the XCLASS fits, and careful use of archival multi-wavelength data including masers, radio continuum, Spitzer, and KMOS. The principal weakness is that the >100 K temperature classification rests on LTE and optically thin assumptions that are not independently verified for source A, while the reported H2 density is below the formal hot-core threshold; these points need to be addressed before the 'bona fide' label is fully convincing.
major comments (3)
- [Section 3.2.3, Eqs. (1)-(2), Figure 9] The hot-core identification rests on T_rot > 100 K for CH3OH and SO2, but the rotational diagrams assume LTE and optically thin lines, as stated in Section 3.2.3. The text itself excludes three SO2 transitions 'to avoid possible opacity effects' because they are strong low-E transitions, which shows that opacity is a live concern. If the bright low-E CH3OH lines are also optically thick, the rotational diagram is flattened and T_rot can be overestimated, potentially pushing a genuinely colder core above the 100 K threshold. Non-LTE XCLASS/RADEX modeling was applied only to sources C, D, and E; for source A the fits are LTE with the source assumed beam filling (Section 3.2.4). I request that the authors report the line optical depths from the XCLASS fits, run non-LTE radiative transfer for CH3OH and SO2 toward source A, or otherwise demonstrate that T_rot remains above 100 K when strong low-E lines are excluded and when the beam-filling assumption is relaxed. Without such a test, the central >100 K claim is not fully supported.
- [Section 3.3, Eq. (4), Table 4] The reported H2 number density for source A is 6.3e5 cm^-3, below the >=1e6 cm^-3 threshold given in the Introduction for a hot core. This value also depends on adopting T_d = T_rot(CH3OH) in Eq. (4); if the methanol temperature is biased high by optical-depth effects, n_H2 is also overestimated. The classification therefore rests almost entirely on the temperature argument. I ask the authors to either justify a relaxed density threshold, derive n_H2 from an independent tracer, or present the density as a supporting indicator with its uncertainty rather than as a criterion that is formally met.
- [Section 3.2.4, Table 5] The CH3CN detections are flagged as tentative in Table 2, and the XCLASS temperature for CH3CN is 83.6 +/- 19.2 K, below 100 K. The abstract and summary list CH3CN as a detected COM supporting the hot-core classification. This is not fatal because CH3OH is the primary hot-temperature tracer, but the text should avoid presenting CH3CN as an independent hot-core tracer; the tentative nature and the sub-100 K fitted temperature should be acknowledged in the summary statements where CH3CN is cited.
minor comments (4)
- [Table 5] The upper limits for C2H5CN and C2H5OH toward source A are listed as <5e8 cm^-2, which is implausibly low for these species and inconsistent with the other COM upper limits in the same table; please check these values and their corresponding abundance upper limits.
- [Section 3.2.4, Table 5] For source E, the non-LTE fit gives a collision partner density of 4.5e8 cm^-3, about three orders of magnitude higher than the density estimated from N(H2)/size for the same source; this inconsistency should be discussed or the fit revisited.
- [Figure 9] The SO2 rotational diagram already marks the three excluded opacity-affected transitions; it would be informative to show the CH3OH fit with the low-Eu (35-60 K) lines removed as well, to demonstrate that the >100 K result is not driven by optically thick low-excitation lines.
- [Section 4.3, Figures 15-16] The abundance comparison uses a single multiplicative metallicity scaling (factors of 2 and 5 for the LMC and SMC), and the Galactic comparison points come from single-dish observations. The text acknowledges the scaling is simple, but a sentence noting that the inferred abundance differences between galaxies could partly reflect this scaling and the different angular scales would help the reader calibrate the comparison.
Circularity Check
No circularity: the hot-core identification is a direct fit of ALMA spectra and continuum, not a reduction to prior results or to the classification criterion.
full rationale
The paper's central claim is that N160A-mm A is a hot core because its measured rotational temperatures (CH3OH at 188 K, SO2 at 178 K from XCLASS; CH3OH at 170±5 K and SO2 at 127±14 K from rotational diagrams, Figure 9), deconvolved size (0.09 pc), and H2 number density (6.3e5 cm^-3) satisfy the literature definition of a hot core. The temperatures are fitted from observed line intensities via the standard rotational-diagram equations (Eqs. 1-2, Section 3.2.3) and independently cross-checked with XCLASS spectral modeling (Section 3.2.4); they are measurements, not predictions derived from the hot-core label. The H2 column density (Eq. 4, Section 3.3) adopts T_rot(CH3OH) as the dust temperature, but this does not force the hot-core conclusion: a lower assumed temperature would increase, not decrease, N(H2) and hence n_H2, so the density support is conservative. The abundance comparisons (Figures 13-16) are observational trends using fitted column densities, not tests of a theory derived from the same fitted values. The paper's self-citations to XCLASS (Möller et al. 2017, 2023; Sewiło et al. 2023) and to previous LMC hot-core surveys provide the fitting tool and comparison sample; they do not supply the measured temperatures or column densities. The private XCLASS extension note is a minor self-reference but is not load-bearing for the hot-core classification, which rests on the independently computed rotational diagrams. Finally, the LTE and optically-thin assumption stated in Section 3.2.3 is an untested modeling assumption and a legitimate correctness risk, but it is not a circular step: the paper does not define the data or the classification in terms of each other. No step in the derivation reduces to its own input or to a self-citation chain.
Assumptions & free parameters
free parameters (6)
- T_rot(CH3OH) for source A =
188.36 ± 5.48 K (XCLASS); 170 ± 5 K (rotational diagram)
- T_rot(SO2) for source A =
178.16 ± 6.71 K (XCLASS); 127 ± 14 K (rotational diagram)
- N(CH3OH) for source A =
(2.51 ± 0.12) × 10^15 cm^-2
- n(H2) collision partner density, source C =
5.8 × 10^6 cm^-3
- n(H2) collision partner density, source D =
3.9 × 10^6 cm^-3
- n(H2) collision partner density, source E =
4.5 × 10^8 cm^-3
assumptions (5)
- domain assumption LTE and optically thin emission for rotational diagram analysis
- domain assumption Dust and gas temperatures are well coupled (T_d ~ T_g ~ T_rot(CH3OH))
- domain assumption 870 micron continuum is dominated by dust thermal emission with negligible free-free contamination
- domain assumption Dust opacity model of Ossenkopf & Henning (1994) and LMC gas-to-dust ratio 316 from Rémy-Ruyer et al. (2014)
- ad hoc to paper Source is beam filling in single-component XCLASS fits to break size-column degeneracy
Cite this review
Pith. "Pith review of ALMA Observations of Molecular Complexity in the Large Magellanic Cloud: Probing the Star-forming Region N160." pith.science (2026). https://pith.science/paper/GIUBRFUY
@misc{pith2026250620951,
  author       = {Pith},
  title        = {Pith review of: ALMA Observations of Molecular Complexity in the Large Magellanic Cloud: Probing the Star-forming Region N160},
  year         = {2026},
  howpublished = {\url{https://pith.science/paper/GIUBRFUY}},
  note         = {Machine review of arXiv:2506.20951}
}
abstract
Hot cores are small ($\lesssim$0.1 pc), dense ($\geq$10$^6$ cm$^{-3}$), and hot ($>$100 K) regions around massive protostars and are one of the main production sites of complex organic molecules (COMs, $\geq6$ atoms, including carbon). The Large Magellanic Cloud (LMC) is an ideal place to study hot core and COM formation in an environment that is different from our Galaxy, though prior to this study there have only been nine detections of extragalactic hot cores (seven in the LMC and two in the Small Magellanic Cloud, SMC). Here, we report 1.2 mm continuum and molecular line observations with the Atacama Large Millimeter/submillimeter Array (ALMA) in the star-forming region N160 that we named N160A-mm. We identify six 1.2 mm continuum sources, four of which are associated with methanol (CH$_3$OH) emission. Another COM, methyl cyanide (CH$_3$CN) is associated with the brightest source, N160A-mmA, the most chemically rich source in the field. Using the XCLASS software, we perform spectral modeling to estimate rotational temperatures and total column densities of detected molecular species for four sources. Based on the temperature exceeding 100 K, small size, and high H$_2$ number density, we identify N160A-mmA as a hot core. We compare the molecular abundances of this newly detected hot core with those previously detected in the LMC and SMC, as well as with a sample of Galactic hot cores, and discuss the complex nature of N160A-mmA.
Figures


Figures from the paper (13 more)


Forward citations
Cited by 1 Pith paper
-
Chemistry of Dark Molecular Clouds
A comprehensive review arguing that the chemically rich cores TMC-1 CP and L1544 are representative molecular-cloud laboratories, and that complex organic molecule production is largely insensitive to metallicity.
Reference graph
Works this paper leans on
-
[1]
Bariosco, V., Tinacci, L., Pantaleone, S., et al. 2025, MNRAS, 539, 82
work page 2025
- [2]
-
[3]
Blake, G. A., Sutton, E. C., Masson, C. R., & Phillips, T. G. 1987, ApJ, 315, 621
work page 1987
- [4]
-
[5]
Browning, M. K., Tumlinson, J., & Shull, J. M. 2003, ApJ, 582, 810
work page 2003
-
[6]
2004, AJ, 128, 1294 CASA Team, Bean, B., Bhatnagar, S., et al
Calvet, N., Muzerolle, J., Brice˜ no, C., et al. 2004, AJ, 128, 1294 CASA Team, Bean, B., Bhatnagar, S., et al. 2022, PASP, 134, 114501
work page 2004
-
[7]
Caswell, J. L. 1995, MNRAS, 272, L31
work page 1995
- [8]
Show all 77 references
-
[9]
J., & Tielens, A
Ceccarelli, C., Hollenbach, D. J., & Tielens, A. G. G. M. 1996, ApJ, 471, 400
1996
-
[10]
S., Allen, D., et al
Churchwell, E., Povich, M. S., Allen, D., et al. 2006, ApJ, 649, 759
2006
-
[11]
L., Clementini, G., Girardi, L., et al
Cioni, M.-R. L., Clementini, G., Girardi, L., et al. 2011, A&A, 527, A116
2011
-
[12]
S., Dame, T
Cohen, R. S., Dame, T. M., Garay, G., et al. 1988, ApJL, 331, L95
1988
-
[13]
D., et al
Deharveng, L., Schuller, F., Anderson, L. D., et al. 2010, A&A, 523, A6
2010
-
[14]
Ehrenfreund, P., & Charnley, S. B. 2000, ARA&A, 38, 427
2000
-
[15]
Fuller, G. A. 2010, MNRAS, 404, 779
2010
-
[16]
A., & Sevre, F
Epchtein, N., Braz, M. A., & Sevre, F. 1984, A&A, 140, 67
1984
-
[17]
1990, PASJ, 42, 505
Fujimoto, M., & Noguchi, M. 1990, PASJ, 42, 505
1990
-
[18]
2017, PASJ, 69, L5
Fukui, Y., Tsuge, K., Sano, H., et al. 2017, PASJ, 69, L5
2017
-
[19]
1999, PASJ, 51, 745
Fukui, Y., Mizuno, N., Yamaguchi, R., et al. 1999, PASJ, 51, 745
1999
-
[20]
2019, ApJ, 886, 14
Fukui, Y., Tokuda, K., Saigo, K., et al. 2019, ApJ, 886, 14
2019
-
[21]
F., & Whiteoak, J
Gardner, F. F., & Whiteoak, J. B. 1985, MNRAS, 215, 103
1985
-
[22]
F., & Langer, W
Goldsmith, P. F., & Langer, W. D. 1978, ApJ, 222, 881 —. 1999, ApJ, 517, 209
1978
-
[23]
A., Caswell, J
Green, J. A., Caswell, J. L., Fuller, G. A., et al. 2008, MNRAS, 385, 948
2008
-
[24]
A., & Chu, Y
Gruendl, R. A., & Chu, Y. 2009, ApJS, 184, 172 Hamedani Golshan, R., S´ anchez-Monge,´A., Schilke, P., et al. 2024, A&A, 688, A3
2009
-
[25]
P., & van Dishoeck, E
Helmich, F. P., & van Dishoeck, E. F. 1997, A&AS, 124, 205
1997
-
[26]
Henize, K. G. 1956, ApJS, 2, 315
1956
-
[27]
Herbst, E., & van Dishoeck, E. F. 2009, ARA&A, 47, 427
2009
-
[28]
Hildebrand, R. H. 1983, QJRAS, 24, 267
1983
-
[29]
R., Indebetouw, R., Brogan, C
Hunter, T. R., Indebetouw, R., Brogan, C. L., et al. 2023, PASP, 135, 074501
2023
-
[30]
E., & Conti, P
Indebetouw, R., Johnson, K. E., & Conti, P. 2004, AJ, 128, 2206
2004
-
[31]
C., Woods, P
Jones, O. C., Woods, P. M., Kemper, F., et al. 2017, MNRAS, 470, 3250
2017
-
[32]
J., Hyland, A
Jones, T. J., Hyland, A. R., Straw, S., et al. 1986, MNRAS, 219, 603 Jørgensen, J. K., Belloche, A., & Garrod, R. T. 2020, ARA&A, 58, 727
1986
-
[33]
L., Evans, N
Kauffmann, J., Bertoldi, F., Bourke, T. L., Evans, N. J., I., & Lee, C. W. 2008, A&A, 487, 993
2008
-
[34]
J., Hollenbach, D
Kaufman, M. J., Hollenbach, D. J., & Tielens, A. G. G. M. 1998, ApJ, 497, 276
1998
-
[35]
W., & Rosolowsky, E
Koch, E. W., & Rosolowsky, E. W. 2015, MNRAS, 452, 3435
2015
-
[36]
1984, in Structure and Evolution of the Magellanic Clouds, ed
Koornneef, J. 1984, in Structure and Evolution of the Magellanic Clouds, ed. S. van den Bergh & K. S. D. de
1984
-
[37]
Walmsley, C. M. 2000, Protostars and Planets IV, 299
2000
-
[38]
S., Whiteoak, J
Lazendic, J. S., Whiteoak, J. B., Klamer, I., Harbison, P. D., & Kuiper, T. B. H. 2002, MNRAS, 331, 969
2002
-
[39]
Lucke, P. B. 1974, ApJS, 28, 73
1974
-
[40]
B., & Hodge, P
Lucke, P. B., & Hodge, P. W. 1970, AJ, 75, 171
1970
-
[41]
1992, A&A, 263, 41
Luks, T., & Rohlfs, K. 1992, A&A, 263, 41
1992
-
[42]
2014, ARA&A, 52, 415
Madau, P., & Dickinson, M. 2014, ARA&A, 52, 415
2014
-
[43]
Martins, F., Schaerer, D., & Hillier, D. J. 2005, A&A, 436, 1049
2005
-
[44]
S., Rumpl, W., & Nordsieck, K
Mathis, J. S., Rumpl, W., & Nordsieck, K. H. 1977, ApJ, 217, 425
1977
-
[45]
2002, A&A, 393, 809
Mehlert, D., Noll, S., Appenzeller, I., et al. 2002, A&A, 393, 809
2002
-
[46]
D., Indebetouw, R., et al
Meixner, M., Gordon, K. D., Indebetouw, R., et al. 2006, AJ, 132, 2268
2006
-
[47]
2013, AJ, 146, 62
Meixner, M., Panuzzo, P., Roman-Duval, J., et al. 2013, AJ, 146, 62
2013
-
[48]
2001, PASJ, 53, L45 M¨ oller, T., Endres, C., & Schilke, P
Mizuno, N., Rubio, M., Mizuno, A., et al. 2001, PASJ, 53, L45 M¨ oller, T., Endres, C., & Schilke, P. 2017, A&A, 598, A7 M¨ oller, T., Schilke, P., S´ anchez-Monge,´A., Schmiedeke, A., & Meng, F. 2023, A&A, 676, A121 M¨ uller, H. S. P., Schl¨ oder, F., Stutzki, J., & Winnewiss...
2001
-
[49]
J., & Charnley, S
Mumma, M. J., & Charnley, S. B. 2011, ARA&A, 49, 471
2011
-
[50]
2000, ApJS, 128, 213
Nummelin, A., Bergman, P., Hjalmarson, ˚A., et al. 2000, ApJS, 128, 213
2000
-
[51]
Oberg, K. I. 2016, Chem. Rev., 116, 17, 9631–9663
2016
-
[52]
1994, A&A, 291, 943
Ossenkopf, V., & Henning, T. 1994, A&A, 291, 943
1994
-
[53]
M., et al
Palau, A., Fuente, A., Girart, J. M., et al. 2011, ApJL, 743, L32 Hot Cores in the LMC49
2011
-
[54]
C., Fall, S
Pei, Y. C., Fall, S. M., & Hauser, M. G. 1999, ApJ, 522, 604
1999
-
[55]
M., Poynter, R
Pickett, H. M., Poynter, R. L., Cohen, E. A., et al. 1998, JQSRT, 60, 883 Pietrzy´ nski, G., Graczyk, D., Gallenne, A., et al. 2019, Nature, 567, 200 R´ emy-Ruyer, A., Madden, S. C., Galliano, F., et al. 2014, A&A, 563, A31
1998
-
[56]
2012, APLpy: Astronomical Plotting Library in Python, , , ascl:1208.017
Robitaille, T., & Bressert, E. 2012, APLpy: Astronomical Plotting Library in Python, , , ascl:1208.017
2012
-
[57]
Rolleston, W. R. J., Trundle, C., & Dufton, P. L. 2002, A&A, 396, 53
2002
-
[58]
D., Meixner, M., et al
Roman-Duval, J., Gordon, K. D., Meixner, M., et al. 2014, ApJ, 797, 86
2014
-
[59]
C., & Dopita, M
Russell, S. C., & Dopita, M. A. 1992, ApJ, 384, 508 SAGE Team. 2006, Surveying the Agents of a Galaxy’s
1992
-
[60]
https://catcopy.ipac.caltech.edu/dois/doi.php?id=10
Evolution, IPAC, doi:10.26131/IRSA404. https://catcopy.ipac.caltech.edu/dois/doi.php?id=10. 26131/IRSA404
-
[61]
Flower, D. R. 1997, A&A, 321, 293
1997
-
[62]
P., Looney, L
Seale, J. P., Looney, L. W., Chu, Y.-H., et al. 2009, ApJ, 699, 150 Sewi lo, M., Indebetouw, R., Charnley, S. B., et al. 2018, ApJL, 853, L19 Sewi lo, M., Charnley, S. B., Schilke, P., et al. 2019, ACS Earth and Space Chemistry, 3, 10, 2088 Sewi lo, M., Cordiner, M., Charnley,...
2009
-
[63]
2020, ApJ, 891, 164
Shimonishi, T., Das, A., Sakai, N., et al. 2020, ApJ, 891, 164
2020
-
[64]
Shimonishi, T., Tanaka, K. E. I., Zhang, Y., & Furuya, K. 2023, ApJL, 946, L41
2023
-
[65]
C., & MCELS Team
Smith, R. C., & MCELS Team. 1998, PASA, 15, 163
1998
-
[66]
C., Peng, R., Danchi, W
Sutton, E. C., Peng, R., Danchi, W. C., et al. 1995, ApJS, 97, 455
1995
-
[67]
2019, ApJ, 886, 15
Tokuda, K., Fukui, Y., Harada, R., et al. 2019, ApJ, 886, 15
2019
-
[68]
2022, ApJ, 933, 20
Tokuda, K., Minami, T., Fukui, Y., et al. 2022, ApJ, 933, 20
2022
-
[69]
Tokuda, K., Harada, N., Tanaka, K. E. I., et al. 2023, ApJ, 955, 52
2023
-
[70]
2019, ApJ, 871, 44 van der Tak, F
Tsuge, K., Sano, H., Tachihara, K., et al. 2019, ApJ, 871, 44 van der Tak, F. F. S. 2004, in IAU Symposium, Vol. 221, Star Formation at High Angular Resolution, ed. M. G
2019
-
[71]
Jayawardhana, & T
Burton, R. Jayawardhana, & T. L. Bourke, 59 van der Tak, F. F. S., Black, J. H., Sch¨ oier, F. L., Jansen, D. J., & van Dishoeck, E. F. 2007, A&A, 468, 627 van Dishoeck, E. F. 2018, IAU Symposium, 332, 3 van Loon, J. T., Oliveira, J. M., Gordon, K. D., Sloan, G. C., & Engelbra...
2007
-
[72]
2014, ApJL, 795, L2
Vastel, C., Ceccarelli, C., Lefloch, B., & Bachiller, R. 2014, ApJL, 795, L2
2014
-
[73]
L., Oliveira, J
Ward, J. L., Oliveira, J. M., van Loon, J. T., & Sewi lo, M. 2016, MNRAS, 455, 2345 —. 2017, MNRAS, 464, 1512
2016
-
[74]
E., Federman, S
Welty, D. E., Federman, S. R., Gredel, R., Thorburn, J. A., & Lambert, D. L. 2006, ApJS, 165, 138
2006
-
[75]
B., & Gardner, F
Whiteoak, J. B., & Gardner, F. F. 1986, MNRAS, 222, 513
1986
-
[76]
B., Wellington, K
Whiteoak, J. B., Wellington, K. J., Jauncey, D. L., et al. 1983, MNRAS, 205, 275
1983
-
[77]
2014, MNRAS, 443, 522
Yozin, C., & Bekki, K. 2014, MNRAS, 443, 522
2014
Reviewed August 6, 2026 · model on record in the stance chip above.
Discussion (0). Sign in to comment.