REVIEW 3 major objections 4 minor 82 references
Modeling the Mass Distribution and Gravitational Potential of Nearby Disk Galaxies: Implications for the ISM Dynamical Equilibrium
T0 review · 3 major / 4 minor · reviewed 2026-08-06 · deepseek-v4-flash
Pith's one-line read This paper constructs three-dimensional mass models for 17 nearby disk galaxies and derives, from vertical hydrostatic equilibrium, gas scale heights that flare from under 100 pc in the inner disks to over 500 pc in the outer disks.
desk verdict A transparent sensitivity analysis of vertical ISM equilibrium for 17 galaxies, with qualitative results that probably hold but a maximum-disk normalization and an unshown M/L robustness claim that need referee attention. read the letter →
The pith
A machine-rendered reading of the paper's core claim, the machinery that carries it, and where it could break.
The reading
What carries the argument
The load-bearing machinery is the vertical hydrostatic equilibrium of the gas disk: a cubic equation (Equation 15 of the paper) whose solution gives the gas scale height $H_{\text{gas}}$ from the gas surface density, the effective gas velocity dispersion, the stellar disk scale height $H_\star$, and the dark matter contribution to the vertical frequency $\Omega_{\text{DM}}$. Once $H_{\text{gas}}$ is known, the total gas weight $W$ is assembled from three terms—gas self-gravity ($\tfrac{\pi}{2}G\Sigma_{\text{gas}}^2$), stellar gravity ($\pi G\Sigma_{\text{gas}}\Sigma_\star\,H_{\text{gas}}/(H_{\text{gas}}+H_\star)$), and dark matter gravity ($\zeta\Sigma_{\text{gas}}\Omega_{\text{DM}}^2 H_{\text{gas}}$)—each evaluated in the three-dimensional potential built from the stellar, gas, and NFW dark matter mass models. The rotation curve decomposition that feeds this machinery is anchored by a maximal-disk assumption: the stellar contribution is rescaled by a per-galaxy factor $f_\star$ so that $V_{\star,\rm scaled}^2+V_{\text{gas}}^2=0.85\,V_c^2$ at $R=2.2\ell_\star$.
What would settle it
Measure stellar velocity dispersions perpendicular to the plane for one of the four galaxies with $f_\star>1.6$ and solve the vertical Jeans equation for the stellar surface density; if the Jeans-derived $\Sigma_\star$ is substantially below the maximal-disk-rescaled value, the 0.85 anchor is falsified and the inferred $H_{\text{gas}}$ and $W$ profiles must be recomputed. A direct observational cross-check is to compare the predicted H I flaring with measured vertical thicknesses of H I in edge-on galaxies at matched radii.
Extended reading notes
Core claim
On the paper's own terms, the central discovery is that the vertical scale height of the gas in these 17 disks is a strongly flaring structure—$H_{\text{gas}}\lesssim100$ pc in the inner few kiloparsecs and $>500$ pc at large radius—and that the budget of the gas weight $W$ in the combined potential changes character with radius: stellar gravity dominates in the inner disk, while gas self-gravity takes over at roughly 3–6 stellar exponential scale lengths and dark matter can dominate beyond 5–8 scale lengths for some galaxies. The paper further claims that this refined $W$ follows the same near-linear relation with local star formation surface density $\Sigma_{\text{SFR}}$ predicted by local-patch simulations, with a modestly shallower slope, and that the agreement tightens when the stellar mass profiles are rescaled to satisfy the maximal disk assumption. The results are derived under five possible stellar disk scale heights; changing $H_\star$ by a factor of three changes $H_{\text{gas}}$ by 30–40% in the inner disk but less than 10% beyond about five scale lengths.
Load-bearing premise
The load-bearing assumption is the maximal disk anchor of Equation 11: for every galaxy the stellar mass profile is rescaled so that baryons (stars plus gas) supply 85% of the circular velocity at $R=2.2\ell_\star$, so if real disks are more sub-maximal than this, the stellar mass scale, the gas scale heights, and the entire weight budget shift—especially for the four galaxies that need stellar scaling factors of 1.6–2.1.
Editorial extensions
If this is right
- Gas disk flaring emerges as a generic consequence of vertical equilibrium: $H_{\text{gas}}$ grows from below 100 pc to above 500 pc across the sample, matching Milky Way and edge-on galaxy measurements.
- Beyond 3–6 $\ell_\star$, the vertical weight is no longer stellar-dominated, so studies of outer-disk H I must include gas self-gravity and dark matter gravity.
- The commonly used weight approximation $W\approx \tfrac{\pi}{2}G\Sigma_{\text{gas}}^2+\Sigma_{\text{gas}}(2G\rho_\star)^{1/2}\sigma_{\text{eff}}$ can deviate by roughly 0.1–0.2 dex where $H_{\text{gas}}\sim H_\star$, whereas the paper's Equations 15–19 do not require the thin-gas assumption.
- Changing the stellar scale height from $0.27\ell_\star$ to $0.09\ell_\star$ changes the predicted star formation surface density by roughly 0.1–0.2 dex in inner disks, equivalent to up to about 60% in star formation rate.
- The maximal-disk rescaling reduces the scatter in the observed weight–star formation relation (rms from 0.18 to 0.16 dex), indicating that the stellar mass-to-light zero point is a real source of scatter.
Reading between the lines
- If these models hold, comparisons with cosmological simulations that assume a fixed stellar scale height (such as $H_\star=H_{\text{gas}}$) may overestimate inner-disk gas scale heights by up to 0.5–1.0 dex; adopting the paper's $0.27\ell_\star$ choice would bring such comparisons onto the same footing.
- A natural testable extension is to fit the same rotation curves with the maximal-disk anchor relaxed, using stellar velocity dispersions to set $f_\star$ independently; the tightness of the weight–star formation relation under that alternative would show whether the 0.85 baryon fraction at $2.2\ell_\star$ is physically necessary.
- The same machinery applied to lower-mass or dwarf galaxies should push the crossover from stellar to gas self-gravity inward, and the predicted crossover radius can be checked against existing H I thickness measurements in such systems.
- Because dark matter gravity contributes to the vertical weight in outer disks, observational derivations of molecular gas depletion times or CO-to-H$_2$ conversion factors that use vertical pressure balance should include a dark matter term at large radii.
Editorial analysis
A structured set of objections, weighed in public.
Referee Report
Summary. The paper constructs three-component (stellar, gas, dark matter) mass models for 17 PHANGS disk galaxies by combining CO and H I rotation curves with near-IR, CO, and H I surface density profiles. The stellar contribution is rescaled by a per-galaxy factor f_star chosen to satisfy a maximum-disk anchor, the H I rotation curve is rescaled by f_HI to match the CO rotation curve, and an NFW halo is fitted to the residual rotation curve. From the resulting 3D mass distributions, the authors solve the vertical dynamical equilibrium equation to derive the gas scale height H_gas and the ISM weight W, including stellar, gas, and dark matter contributions. They explore several assumptions for the stellar vertical scale height H_star and compare the resulting W–Sigma_SFR relation with previous observational results and the PRFM simulation prediction. The main reported findings are that H_gas rises from <~100 pc in the inner disks to >500 pc at large radii, that gas and dark matter gravity often dominate the vertical weight budget beyond 3-6 stellar scale lengths, and that the refined weight measurements broadly agree with earlier work and with the PRFM prediction, albeit with a slightly shallower slope.
Significance. If the results are robust, this paper provides a valuable, uniformly analyzed sample of 3D mass models that can directly inform studies of ISM dynamical equilibrium and pressure-regulated star formation. Its strengths include the use of homogeneous multiwavelength data, explicit treatment of radial M/L and CO-to-H2 variations, a systematic exploration of five H_star assumptions, and an externally testable W-SFR comparison against independent observations and simulations. The analysis pipeline and data products are clearly described, and the quantitative maps of H_gas and W should be useful to the community. However, the central quantitative claims depend on a maximum-disk normalization whose sensitivity is not demonstrated, and the reported quantities lack propagated uncertainties, so the present version cannot fully support the precision implied by the text.
major comments (3)
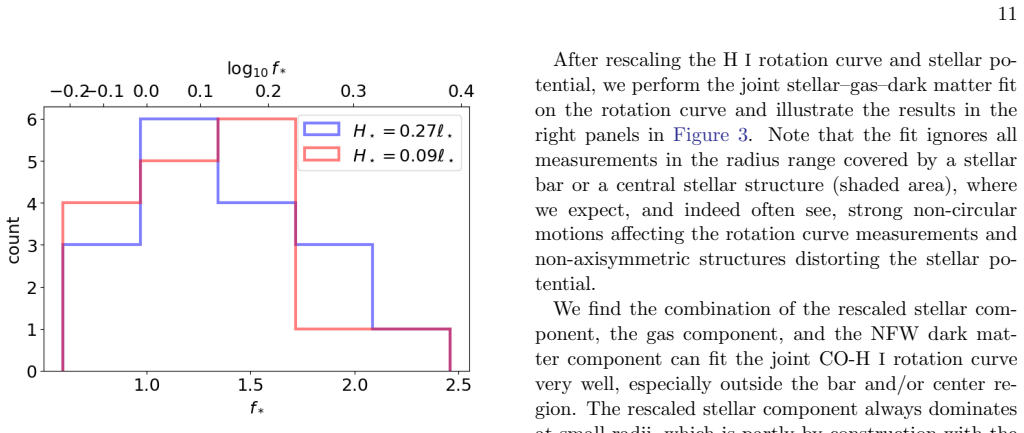
- [§3.2, §4.1, Eq. (11), Table 2] The maximum-disk anchor in Eq. (11) fixes the stellar mass scale through f_star, and the resulting rescaling is large for several galaxies: f_star reaches 2.46 for NGC 3137 (a stellar mass factor of ~6) and exceeds 1.6 in a number of other systems. The paper states in §4.1 that adopting any reasonable alternative M/L ratio between 0.2 and 0.6 would not change the main results qualitatively, but this verification is not shown. This is load-bearing because H_gas and W depend on Sigma_star through Eqs. (15)-(19), and because W_star scales as f_star^2, a factor of two change in f_star shifts W_star by ~0.6 dex. Such a shift can move the radii at which gas and dark matter gravity dominate the weight budget by several scale lengths, especially for the high-f_star galaxies. I request an explicit sensitivity test that reruns the analysis with f_star (or M/L) varied over a reasonable range, reporting changes in H_gas, W, the 3-6 l_star crossing radii, and the fitted W-SFR slope.
- [§4.2–§4.4, Figs. 5–8] Central quantitative claims are presented without propagated uncertainties. The analysis depends on multiple uncertain inputs: f_star, f_HI, galaxy distance and inclination, Gaussian process smoothing length scales, sigma_eff, H_star, and the NFW fit parameters, yet H_gas and W are shown as single curves in Figs. 5-8 with no error bars, and the W-SFR best-fit slope and scatter are quoted in the text only qualitatively. Without a Monte Carlo or bootstrap propagation, it is not possible to assess whether the reported 30-40% H_star sensitivity, the 3-6 l_star transition radii, or the shallower W-SFR slope are significant relative to measurement uncertainty. I request that the authors provide uncertainty estimates on H_gas and W, at least for representative galaxies and for the sample-averaged W-SFR relation, and report the fitted slope and scatter with uncertainties.
- [§3.2, Eq. (9), §3.3] The ad hoc rescaling of the H I rotation curve by f_HI (Eq. 9), with values up to 1.19, is applied before the NFW fit and therefore directly affects the inferred dark matter profile at large radii, where the H I rotation curve is the only kinematic constraint. The paper attributes the offsets to inclination or disk thickness effects, but no sensitivity test is shown for the derived H_gas and W with respect to f_HI. Since the outer H I kinematics are also central to the dark matter contribution W_DM in Eq. (18), I ask the authors to quantify how much the main results change if f_HI is set to unity or varied within its plausible range, or to present a joint CO-H I modeling approach that avoids this separate rescaling.
minor comments (4)
- [§4.1, Table 2] The text states that 13 of 17 galaxies have f_star between 0.8 and 1.5, with the remaining four between 1.6 and 2.1, but Table 2 lists more than four galaxies with f_star above 1.5 under the H_star = 0.27 l_star assumption (including NGC 1087, NGC 1300, NGC 2283, NGC 2835, NGC 2997, NGC 3137, NGC 4571, and NGC 5042). Please clarify the threshold used and reconcile the text with the table.
- [§3.3, §3.4] The one-parameter NFW model uses a fixed fiducial R_s = 9 H_star, but H_star is defined only later in §3.4 and depends on the adopted stellar scale-height assumption. Please restate the fiducial R_s in absolute units or define it independently of the H_star assumptions, since otherwise the meaning of 'fixed' is ambiguous.
- [§4.1] The sentence 'f_HI values for most galaxies are in the range of 0.94–1.19' is imprecise: Table 2 shows that all listed f_HI values fall in this range, so 'all' would be more accurate than 'most'.
- [§4.4, Fig. 8] The best-fit power-law relation plotted as a blue dashed line in Fig. 8 is mentioned in the caption but its fitted slope, normalization, and scatter are not reported in the text. Reporting these numbers, with uncertainties, would make the comparison with Eq. (21) more quantitative.
Circularity Check
No material circularity: the fstar maximum-disk anchor is an explicit calibration, and Hgas and W are nonlinearly derived and validated against external observations and simulations.
full rationale
The central derivation chain is not circular. The stellar zero-point fstar is set in Equation 11 by requiring sqrt(V_star,scaled^2 + V_gas^2) = 0.85 Vc at R = 2.2 ell_star, and the NFW halo is then fit to the same rotation curve through Equation 12. This is an explicit, standard maximum-disk mass-modeling calibration, not a hidden 'prediction' of the rotation curve: the paper acknowledges that the inner-disk stellar dominance is 'partly by construction' (Section 4.1), and it does not present the rotation-curve decomposition itself as an independent test. The main scientific outputs, Hgas and W, are not equal to any fitted quantity by construction: Hgas is solved from the nonlinear cubic Equation 15 using rescaled surface densities, velocity dispersions, Hstar, and the fitted Omega_DM; W is then evaluated from Equations 16-19. The headline W-SFR comparison is benchmarked externally against the Sun et al. (2023) observational measurements and the TIGRESS/PRFM simulation relation (Equation 21, Ostriker & Kim 2022), and the Hgas trend is compared to independent Milky Way and edge-on-galaxy measurements. Self-citations such as Sun et al. (2020a), Hassan et al. (2024), and Ostriker & Kim (2022) supply data products, a hydrostatic-equilibrium formula, and simulation predictions that are independent support rather than conclusions assumed from this paper's fitted values. The main caveat is the unquantified robustness assertion in Section 4.1 that 'adopting any reasonable alternative M/L ratio (e.g., between 0.2 and 0.6) would not change our main results on a qualitative level,' especially given fstar up to 2.46 for NGC 3137; however, this is an omitted demonstration of model sensitivity, not a circularity, because no derived quantity reduces to Equation 11 by definition. The Hstar-dependence of Hgas and W is explicitly tested with five assumptions, further showing that the results are not forced by a single self-cited ansatz.
Assumptions & free parameters
free parameters (5)
- f_star: multiplicative scaling of the stellar circular velocity and potential =
0.67 to 2.46 for H_star = 0.27 ell_star; 0.60 to 2.21 for H_star = 0.09 ell_star (Table 2)
- f_HI: multiplicative scaling of the H I rotation curve =
0.94 to 1.19 (Table 2)
- NFW halo parameters rho0 and Rs =
log10 rho0 in [-3.1, -1.9] M_sun/pc^3 and Rs in [8.7, 56] kpc (Table 2)
- Gaussian process length scales for stellar and gas surface density smoothing =
3 kpc for stellar profiles, 1.5 kpc for gas profiles
- H_star: stellar disk vertical scale height =
Five cases: 0.27 ell_star, 0.09 ell_star, H_star = H_gas, 800 pc, 300 pc
assumptions (5)
- domain assumption Dark matter halos follow a spherically symmetric NFW profile
- domain assumption The stellar disk has an exponential vertical distribution with a constant scale height H_star
- ad hoc to paper The baryonic contribution to V_c at R = 2.2 ell_star is 85 percent, the classic maximum disk anchor
- domain assumption The gas is in vertical dynamical equilibrium described by the cubic equation from Hassan et al. 2024 and the weight decomposition of Equations 16 to 19
- domain assumption The stellar M/L ratio and CO-to-H2 conversion factor calibrations from Leroy et al. 2019 and Schinnerer & Leroy 2024 are correct
Cite this review
Pith. "Pith review of Modeling the Mass Distribution and Gravitational Potential of Nearby Disk Galaxies: Implications for the ISM Dynamical Equilibrium." pith.science (2026). https://pith.science/paper/4Y3EJUZL
@misc{pith2026250622381,
  author       = {Pith},
  title        = {Pith review of: Modeling the Mass Distribution and Gravitational Potential of Nearby Disk Galaxies: Implications for the ISM Dynamical Equilibrium},
  year         = {2026},
  howpublished = {\url{https://pith.science/paper/4Y3EJUZL}},
  note         = {Machine review of arXiv:2506.22381}
}
abstract
We characterize stellar, gas, and dark matter mass distributions for 17 nearby massive disk galaxies from the PHANGS sample. This allows us to compute the gravitational potential that vertically confines the interstellar gas and determines its equilibrium scale height and weight. We first combine dynamical mass constraints from existing CO and HI rotation curves together with stellar and gas mass estimates from near-infrared, CO, and HI data. These estimates incorporate current best practices in modeling stellar mass-to-light ratios and CO-to-H2 conversion factor variations. Then, we fit joint stellar--gas--dark matter mass models to the rotation curves, adopting the classic maximal disk assumption to account for remaining zero-point uncertainties on the stellar mass-to-light ratio. After obtaining three-component radial mass profiles, we calculate the vertical equilibrium gas scale height and ISM weight in the combined gravitational potential. We find the gas scale height $H_\text{gas}$ increases from ${\lesssim}100$pc in the inner disks to ${>}500$pc at large radii, consistent with observations of our Galaxy and other edge-on galaxies. The gas weight is dominated by stellar gravity at small radii, but the gas and dark matter gravity often become important beyond 3-6 times the stellar disk radial scale length. Both our gas scale height and weight estimates are dependent on the treatment of stellar disk scale height $H_\star$, with $H_\text{gas}$ varying by 30-40% when $H_\star$ varies by a factor of 3. The relationship between our refined ISM weight estimates and local star formation surface density generally agrees with previous observations and predictions from theory and simulations.
Figures


Figures from the paper (6 more)


Reference graph
Works this paper leans on
-
[1]
, " * write output.state after.block = add.period write newline
ENTRY address archivePrefix author booktitle chapter doi edition editor eprint howpublished institution journal key month number organization pages publisher school series title misctitle type volume year version url label extra.label sort.label short.list INTEGERS output.state before.all mid.sentence after.sentence after.block FUNCTION init.state.consts ...
-
[2]
write newline
" write newline "" before.all 'output.state := FUNCTION format.url url empty "" new.block "" url * "" * if FUNCTION format.eprint eprint empty "" archivePrefix empty "" archivePrefix "arXiv" = new.block " " eprint * " " * new.block " " eprint * " " * if if if FUNCTION format.doi doi empty "" " " doi * " " * if FUNCTION format.pid doi empty eprint empty ur...
-
[3]
@ @ . MӈF|> IZ @ ]f _O B Fioo_ @ \ ڮq_ Z4 @ + ! @ @ D y@ `
thebibliography [1] 20pt to REFERENCES 6pt =0pt -12pt 10pt plus 3pt =0pt =0pt =1pt plus 1pt =0pt =0pt -12pt =13pt plus 1pt =20pt =13pt plus 1pt \@M =10000 =-1.0em =0pt =0pt 0pt =0pt =1.0em @enumiv\@empty 10000 10000 `\.\@m \@noitemerr \@latex@warning Empty `thebibliography' environment \@ifnextchar \@reference \@latexerr Missing key on reference command E...
arXiv 2021
-
[4]
Anand , G. S., Lee , J. C., Van Dyk , S. D., et al. 2021, , 501, 3621, 10.1093/mnras/staa3668
-
[5]
Astropy Collaboration , Robitaille , T. P., Tollerud , E. J., et al. 2013, , 558, A33, 10.1051/0004-6361/201322068
-
[6]
Astropy Collaboration , Price-Whelan , A. M., Sip o cz , B. M., et al. 2018, , 156, 123, 10.3847/1538-3881/aabc4f
-
[7]
Astropy Collaboration , Price-Whelan , A. M., Lim , P. L., et al. 2022, , 935, 167, 10.3847/1538-4357/ac7c74
-
[8]
2019, , 622, A64, 10.1051/0004-6361/201834382
Bacchini , C., Fraternali , F., Iorio , G., & Pezzulli , G. 2019, , 622, A64, 10.1051/0004-6361/201834382
Show all 82 references
-
[9]
K., S \'a nchez , S
Barrera-Ballesteros , J. K., S \'a nchez , S. F., Heckman , T., et al. 2021, , 503, 3643, 10.1093/mnras/stab755
2021 doi
- [10]
-
[11]
A., Verheijen , M
Bershady , M. A., Verheijen , M. A. W., Swaters , R. A., et al. 2010, , 716, 198, 10.1088/0004-637X/716/1/198
2010 doi
-
[12]
2008, Galactic Dynamics: Second Edition (Princeton University Press)
Binney , J., & Tremaine , S. 2008, Galactic Dynamics: Second Edition (Princeton University Press)
2008
-
[13]
2004, , 612, L29, 10.1086/424661
Blitz , L., & Rosolowsky , E. 2004, , 612, L29, 10.1086/424661
2004 doi
- [14]
-
[15]
in preparation, Dynamics and Astrophysics of Galaxies (Princeton University Press)
Bovy , J. in preparation, Dynamics and Astrophysics of Galaxies (Princeton University Press). https://galaxiesbook.org/
-
[16]
2013, , 779, 115, 10.1088/0004-637X/779/2/115
Bovy , J., & Rix , H.-W. 2013, , 779, 115, 10.1088/0004-637X/779/2/115
2013 doi
-
[17]
M., Chastenet , J., et al
Chiang , I.-D., Sandstrom , K. M., Chastenet , J., et al. 2024, , 964, 18, 10.3847/1538-4357/ad23ed
2024 doi
-
[18]
Conselice , C. J. 2014, , 52, 291, 10.1146/annurev-astro-081913-040037
2014 doi
-
[19]
de Blok , W. J. G., Walter , F., Brinks , E., et al. 2008, , 136, 2648, 10.1088/0004-6256/136/6/2648
2008 doi
-
[20]
M., & Fraternali , F
Di Teodoro , E. M., & Fraternali , F. 2015, , 451, 3021, 10.1093/mnras/stv1213
2015 doi
-
[21]
M., & Peek , J
Di Teodoro , E. M., & Peek , J. E. G. 2021, , 923, 220, 10.3847/1538-4357/ac2cbd
2021 doi
-
[22]
M., Posti , L., Fall , S
Di Teodoro , E. M., Posti , L., Fall , S. M., et al. 2023, MNRAS, 518, 6340, 10.1093/mnras/stac3424
2023 doi
- [23]
-
[24]
W., Boubert , D., & Grand , R
Everall , A., Belokurov , V., Evans , N. W., Boubert , D., & Grand , R. J. J. 2022, , 511, 3863, 10.1093/mnras/stac305
2022 doi
-
[25]
S., de Blok , W
Frank , B. S., de Blok , W. J. G., Walter , F., Leroy , A., & Carignan , C. 2016, , 151, 94, 10.3847/0004-6256/151/4/94
2016 doi
-
[26]
A., Mosenkov , A
Guerrette , J. A., Mosenkov , A. V., Spencer , D., & Shakespear , Z. D. 2024, Research in Astronomy and Astrophysics, 24, 035002, 10.1088/1674-4527/ad1a06
2024 doi
-
[27]
R., Millman , K
Harris , C. R., Millman , K. J., van der Walt , S. J., et al. 2020, , 585, 357, 10.1038/s41586-020-2649-2
2020 doi
-
[28]
C., Kim , C.-G., et al
Hassan , S., Ostriker , E. C., Kim , C.-G., et al. 2024, , 975, 151, 10.3847/1538-4357/ad73a4
2024 doi
-
[29]
2017, , 835, 201, 10.3847/1538-4357/835/2/201
Herrera-Camus , R., Bolatto , A., Wolfire , M., et al. 2017, , 835, 201, 10.3847/1538-4357/835/2/201
2017 doi
-
[30]
A., Ciardullo , R., Feldmeier , J
Herrmann , K. A., Ciardullo , R., Feldmeier , J. J., & Vinciguerra , M. 2008, , 683, 630, 10.1086/589920
2008 doi
-
[31]
Heyer , M., & Dame , T. M. 2015, , 53, 583, 10.1146/annurev-astro-082214-122324
2015 doi
-
[32]
Hunter , J. D. 2007, Computing in Science and Engineering, 9, 90, 10.1109/MCSE.2007.55
2007 doi
-
[33]
2008, , 673, 864, 10.1086/523619
Juri \'c , M., Ivezi \'c , Z ., Brooks , A., et al. 2008, , 673, 864, 10.1086/523619
2008 doi
-
[34]
M., White , S
Kauffmann , G., Heckman , T. M., White , S. D. M., et al. 2003, , 341, 33, 10.1046/j.1365-8711.2003.06291.x
2003
-
[35]
Kim , C.-G., Kim , W.-T., & Ostriker , E. C. 2011, , 743, 25, 10.1088/0004-637X/743/1/25
2011 doi
-
[36]
Kim , C.-G., & Ostriker , E. C. 2015, , 815, 67, 10.1088/0004-637X/815/1/67
2015 doi
-
[37]
C., & Kim , W.-T
Kim , C.-G., Ostriker , E. C., & Kim , W.-T. 2013, , 776, 1, 10.1088/0004-637X/776/1/1
2013 doi
-
[38]
C., Kim , J.-G., et al
Kim , C.-G., Ostriker , E. C., Kim , J.-G., et al. 2024, , 972, 67, 10.3847/1538-4357/ad59ab
2024 doi
-
[39]
W., Rosolowsky , E
Koch , E. W., Rosolowsky , E. W., Lockman , F. J., et al. 2018, , 479, 2505, 10.1093/mnras/sty1674
2018 doi
-
[40]
2004, , 42, 603, 10.1146/annurev.astro.42.053102.134024
Kormendy , J., & Kennicutt , Robert C., J. 2004, , 42, 603, 10.1146/annurev.astro.42.053102.134024
2004
-
[41]
C., & de Grijs , R
Kregel , M., van der Kruit , P. C., & de Grijs , R. 2002, , 334, 646, 10.1046/j.1365-8711.2002.05556.x
2002
-
[42]
E., Rosolowsky , E., et al
Lang , P., Meidt , S. E., Rosolowsky , E., et al. 2020, , 897
2020
-
[43]
K., Sandstrom , K
Leroy , A. K., Sandstrom , K. M., Lang , D., et al. 2019, , 244, 24, 10.3847/1538-4365/ab3925
2019 doi
-
[44]
K., Schinnerer , E., Hughes , A., et al
Leroy , A. K., Schinnerer , E., Hughes , A., et al. 2021, , 257, 43, 10.3847/1538-4365/ac17f3
2021 doi
-
[45]
E., Fraternali , F., Oosterloo , T., et al
Mancera Pi \ n a , P. E., Fraternali , F., Oosterloo , T., et al. 2022, , 514, 3329, 10.1093/mnras/stac1508
2022 doi
-
[46]
Martinsson , T. P. K., Verheijen , M. A. W., Westfall , K. B., et al. 2013 a , , 557, A131, 10.1051/0004-6361/201321390
2013 doi
-
[47]
2013 b , , 557, A130, 10.1051/0004-6361/201220515
---. 2013 b , , 557, A130, 10.1051/0004-6361/201220515
2013 doi
-
[48]
M., Stanimirovi \'c , S., & Rybarczyk , D
McClure-Griffiths , N. M., Stanimirovi \'c , S., & Rybarczyk , D. R. 2023, , 61, 19, 10.1146/annurev-astro-052920-104851
2023 doi
-
[49]
G., & Poulin, F
Murray, S. G., & Poulin, F. J. 2019, Journal of Open Source Software, 4, 1397, 10.21105/joss.01397
2019 doi
-
[50]
F., Frenk , C
Navarro , J. F., Frenk , C. S., & White , S. D. M. 1996, , 462, 563, 10.1086/177173
1996 doi
-
[51]
C., & Kim , C.-G
Ostriker , E. C., & Kim , C.-G. 2022, , 936, 137, 10.3847/1538-4357/ac7de2
2022 doi
-
[52]
C., McKee , C
Ostriker , E. C., McKee , C. F., & Leroy , A. K. 2010, , 721, 975, 10.1088/0004-637X/721/2/975
2010 doi
-
[53]
C., & Shetty , R
Ostriker , E. C., & Shetty , R. 2011, , 731, 41, 10.1088/0004-637X/731/1/41
2011 doi
-
[54]
2020, pandas-dev/pandas: Pandas, latest, Zenodo, 10.5281/zenodo.3509134
pandas development team, T. 2020, pandas-dev/pandas: Pandas, latest, Zenodo, 10.5281/zenodo.3509134
2020 doi
-
[55]
2011, Journal of Machine Learning Research, 12, 2825
Pedregosa, F., Varoquaux, G., Gramfort, A., et al. 2011, Journal of Machine Learning Research, 12, 2825
2011
-
[56]
2021, , 656, A133, 10.1051/0004-6361/202140695
Querejeta , M., Schinnerer , E., Meidt , S., et al. 2021, , 656, A133, 10.1051/0004-6361/202140695
2021 doi
-
[57]
C., Ford , W
Rubin , V. C., Ford , W. K., J., & Thonnard , N. 1980, , 238, 471, 10.1086/158003
1980 doi
-
[58]
Sackett , P. D. 1997, , 483, 103, 10.1086/304223
1997 doi
-
[59]
Salim , S., Boquien , M., & Lee , J. C. 2018, , 859, 11, 10.3847/1538-4357/aabf3c
2018 doi
-
[60]
C., Janowiecki , S., et al
Salim , S., Lee , J. C., Janowiecki , S., et al. 2016, , 227, 2, 10.3847/0067-0049/227/1/2
2016 doi
-
[61]
2015, , 219, 4, 10.1088/0067-0049/219/1/4
Salo , H., Laurikainen , E., Laine , J., et al. 2015, , 219, 4, 10.1088/0067-0049/219/1/4
2015 doi
-
[62]
S \'a nchez , S. F. 2020, , 58, 99, 10.1146/annurev-astro-012120-013326
2020 doi
-
[63]
Schinnerer , E., & Leroy , A. K. 2024, , 62, 369, 10.1146/annurev-astro-071221-052651
2024 doi
- [64]
- [65]
-
[66]
2023, PhangsTeam/MegaTable: PHANGS mega-table pipeline release v4.0 , v4.0, Zenodo, 10.5281/zenodo.8049365
Sun, J. 2023, PhangsTeam/MegaTable: PHANGS mega-table pipeline release v4.0 , v4.0, Zenodo, 10.5281/zenodo.8049365
2023 doi
-
[67]
K., Schruba , A., et al
Sun , J., Leroy , A. K., Schruba , A., et al. 2018, , 860, 172, 10.3847/1538-4357/aac326
2018 doi
-
[68]
K., Ostriker , E
Sun , J., Leroy , A. K., Ostriker , E. C., et al. 2020 a , , 892, 148, 10.3847/1538-4357/ab781c
2020 doi
-
[69]
K., Schinnerer , E., et al
Sun , J., Leroy , A. K., Schinnerer , E., et al. 2020 b , , 901, L8, 10.3847/2041-8213/abb3be
2020 doi
-
[70]
K., Rosolowsky , E., et al
Sun , J., Leroy , A. K., Rosolowsky , E., et al. 2022, , 164, 43, 10.3847/1538-3881/ac74bd
2022 doi
-
[71]
K., Ostriker , E
Sun , J., Leroy , A. K., Ostriker , E. C., et al. 2023, , 945, L19, 10.3847/2041-8213/acbd9c
2023 doi
-
[72]
A., & Heckman , T
Thompson , T. A., & Heckman , T. M. 2024, , 62, 529, 10.1146/annurev-astro-041224-011924
2024 doi
-
[73]
S., Bahcall , J
van Albada , T. S., Bahcall , J. N., Begeman , K., & Sancisi , R. 1985, , 295, 305, 10.1086/163375
1985 doi
-
[74]
M., van Albada , T
van der Hulst , J. M., van Albada , T. S., & Sancisi , R. 2001, in Astronomical Society of the Pacific Conference Series, Vol. 240, Gas and Galaxy Evolution, ed. J. E. Hibbard , M. Rupen , & J. H. van Gorkom , 451
2001
- [75]
-
[76]
2011, , 49, 301, 10.1146/annurev-astro-083109-153241
---. 2011, , 49, 301, 10.1146/annurev-astro-083109-153241
2011 doi
-
[77]
C., & Searle , L
van der Kruit , P. C., & Searle , L. 1981, , 95, 105
1981
-
[78]
E., et al
Virtanen , P., Gommers , R., Oliphant , T. E., et al. 2020, Nature Methods, 17, 261, 10.1038/s41592-019-0686-2
2020 doi
-
[79]
Walter , F., Brinks , E., de Blok , W. J. G., et al. 2008, , 136, 2563, 10.1088/0004-6256/136/6/2563
2008 doi
-
[80]
C., & van der Hulst , J
Yim , K., Wong , T., Howk , J. C., & van der Hulst , J. M. 2011, , 141, 48, 10.1088/0004-6256/141/2/48
2011 doi
-
[81]
2014, , 148, 127, 10.1088/0004-6256/148/6/127
Yim , K., Wong , T., Xue , R., et al. 2014, , 148, 127, 10.1088/0004-6256/148/6/127
2014 doi
-
[82]
2013, , 772, 108, 10.1088/0004-637X/772/2/108
Zhang , L., Rix , H.-W., van de Ven , G., et al. 2013, , 772, 108, 10.1088/0004-637X/772/2/108
2013 doi
Reviewed August 6, 2026 · model on record in the stance chip above.
Discussion (0). Sign in to comment.