REVIEW 4 major objections 5 minor 1 cited by
MeerKAT radio continuum imaging of nearby star-forming spirals in the NGC 6221, NGC 3256/3263, and NGC 2434 galaxy groups
T0 review · 4 major / 5 minor · reviewed 2026-08-06 · deepseek-v4-flash
Pith's one-line read This paper finds that fourteen galaxies in three groups at different evolutionary stages obey the W3PAH-radio star-formation correlation, with mean qW3PAH = 2.5 ± 0.1, while ESO 059-G012 deviates by 3-sigma because its gas is exhausted.
desk verdict Useful MeerKAT continuum products and resolved maps, wrapped in a few claims that outrun the data; worth refereeing and worth accepting after moderate revisions. read the letter →
The pith
A machine-rendered reading of the paper's core claim, the machinery that carries it, and where it could break.
The reading
What carries the argument
The argument rests on the W3PAH-radio correlation and its $q_{\mathrm{W3PAH}}$ parameter. The machinery is the PAH-corrected WISE flux $F_{\mathrm{W3PAH}} = F_{\mathrm{W3}} - 0.158\,F_{\mathrm{W1}}$, which is meant to remove the contribution of evolved stellar populations from the 12 $\mu$m band and leave emission from polycyclic aromatic hydrocarbons in photodissociation regions, a direct tracer of recent star formation; this is compared against MeerKAT 1.3 GHz continuum, which traces free-free emission from ionized gas and synchrotron emission from supernova-accelerated cosmic-ray electrons. The correlation is quantified by the logarithm of the ratio of W3PAH flux to radio flux, normalized in the standard $q$-parameter convention, so deviations from the mean flag changes in either the star-forming gas or the radio-emitting relativistic particles. The same corrected flux also feeds a W3PAH-to-total-infrared calibration, while WISE colour-colour placement and in-band spectral index maps separate thermal and non-thermal regions and locate AGN candidates, providing the physical interpretation for each outlier.
What would settle it
Map the cold gas of ESO 059-G012 in CO(1-0) or deep H I to a sensitivity reaching its radio continuum upper limit. If a substantial molecular or atomic reservoir is present, the 'gas already consumed' interpretation fails and the high $q_{\mathrm{W3PAH}}$ would instead trace a problem with the W3PAH correction; if the galaxy is genuinely gas-poor, the interpretation is confirmed. Repeating the same $q$ measurement with an independent PAH tracer, such as the 7.7 $\mu$m or 11.3 $\mu$m PAH features, would separate tracer artifacts from real quenched galaxies.
Extended reading notes
Core claim
On the paper's own terms, the discovery is that the W3PAH-radio correlation, measured with a PAH-only infrared tracer, holds across three galaxy groups at different evolutionary stages. The paper obtains this by detecting 1.3 GHz continuum in fourteen group members with MeerKAT (synthesized beams of roughly $7{-}9$ arcsec and rms $3{-}7\,\mu$Jy beam$^{-1}$), measuring matched-aperture WISE W1, W2 and W3 fluxes, and forming $F_{\mathrm{W3PAH}} = F_{\mathrm{W3}} - 0.158\,F_{\mathrm{W1}}$ to remove evolved stellar contamination. A least-squares fit to $\log F_{1.3\,\mathrm{GHz}}$ versus $\log F_{\mathrm{W3PAH}}$ gives slope $0.99 \pm 0.11$ and scatter $0.3$; the mean $q_{\mathrm{W3PAH}} = 2.5 \pm 0.1$ agrees, within errors, with comparison samples, while ESO 059-G012 sits at $q_{\mathrm{W3PAH}} = 3.7$, three times more infrared than radio than the empirical relation predicts. The paper interprets this outlier, together with the negative W3PAH flux of NGC 2434, as evidence that late-stage group members can exhaust their star-forming gas; it also uses resolved $q_{\mathrm{W3PAH}}$ maps to locate AGN radio excess in the cores of NGC 3256 and NGC 6221, and spectral index maps to connect steep-spectrum synchrotron emission in the NGC 3256/3263 group to tidal interactions.
Load-bearing premise
The load-bearing premise is that the W3PAH flux, obtained by subtracting 15.8% of the W1 flux from the W3 flux, isolates polycyclic aromatic hydrocarbon emission that traces only star-forming regions; if old stellar light leaks into W3PAH for some galaxies, the identification of ESO 059-G012 as gas-exhausted would be an artifact of that correction rather than a real evolutionary state.
Editorial extensions
If this is right
- If the W3PAH-radio relation is as tight as this sample shows, W3PAH can be used as a dust-unbiased star-formation tracer inside galaxy groups, and radio continuum alone can be translated into star-formation rate at the same precision for normal star-forming members.
- A mean $q_{\mathrm{W3PAH}} = 2.5 \pm 0.1$ that is independent of radio and infrared luminosity means a single calibration constant can be applied across group members spanning dwarf galaxies to merging spirals.
- Outlier galaxies with $q_{\mathrm{W3PAH}} \gtrsim 3$ are plausibly gas-exhausted, so the $q$ parameter can be used to identify quenched galaxies in group and cluster surveys.
- Central $q_{\mathrm{W3PAH}}$ values below about 0.5 coincide with known or suspected low-luminosity AGN in NGC 3256 and NGC 6221, making resolved $q$ maps a viable AGN-finding tool in interacting systems.
- Spectral index maps that steepen away from galaxy disks and toward tidal tails, as seen for NGC 3263 and NGC 3256B, would confirm that tidal interactions accelerate cosmic rays and boost non-thermal radio emission.
Reading between the lines
- A direct test of the gas-exhaustion reading of ESO 059-G012 would be CO(1-0) or deep H I mapping: if a substantial cold gas reservoir is found, the high $q_{\mathrm{W3PAH}}$ value would more likely reflect a calibration or tracer problem than a quenched galaxy.
- The same MeerKAT-plus-WISE measurement, applied to complete group samples, could turn the $q_{\mathrm{W3PAH}}$ distribution into a group-evolution clock, since the paper's three stages produce different colour-colour placements and, in the late stage, gas-poor outliers.
- The paper itself cautions that the SED-derived dust content for NGC 2434 and ESO 059-G012 is weakly constrained by sparse infrared photometry; additional far-infrared measurements would decide whether these are truly quenched or simply under-fitted.
Signed reviews
Editorial analysis
A structured set of objections, weighed in public.
Referee Report
Summary. The paper presents MeerKAT 1.3 GHz radio continuum images and WISE mid-infrared photometry for galaxies in three nearby groups (NGC 6221, NGC 3256/3263, NGC 2434) chosen to represent early, intermediate, and late stages of group evolution. The authors measure radio flux densities, compute in-band spectral index maps, derive star formation rates from radio and W3PAH luminosities, and analyze the radio-W3PAH correlation. The central result is that all but one galaxy, ESO 059-G012, follow the radio-W3PAH relation; the outlier is interpreted as having already consumed its gas. The paper also discusses the Vela Cloud, evidence for low-luminosity AGN in NGC 6221 and NGC 3256, and compares SFRs derived from the two tracers.
Significance. If substantiated, the finding that the radio-W3PAH relation holds across group evolutionary stages supports the use of W3PAH as a star formation tracer in dense environments and identifies a candidate quenched galaxy in a late-stage group. The radio continuum images and the photometric catalogues are a useful observational contribution, and the data are made available through the SARAO archive and CDS. The paper uses a standard, well-tested MeerKAT pipeline and provides internal checks of the WISE photometry against catalogued values. However, the sample is small, and the outlier interpretation rests on a fixed stellar-subtraction prescription whose validity for quiescent early-type galaxies is not established.
major comments (4)
- [Section 3.4] The identification of ESO 059-G012 as the sole outlier, and the subsequent interpretation that it has consumed its gas, depends critically on the Cluver et al. (2017) prescription FW3PAH = W3 - 0.158*W1. This subtraction factor is calibrated on star-forming galaxies, and the manuscript itself shows its limitation for early-type systems: NGC 2434, another member of the late-stage group, has FW3PAH < 0 and is excluded from the analysis. If the true stellar contribution to W3 in quiescent early-type galaxies exceeds 0.158*W1, then FW3PAH is overestimated, qW3PAH is inflated, and ESO 059-G012's apparent radio deficiency becomes a subtraction artifact rather than evidence of gas exhaustion. The authors' own caveat in Section 4.1 ("the low dust content derived from the SED fitting of the galaxies NGC 2434 and ESO59-G012 might result from limitations in the model due to the lack of infrared data") reinforces that this is unverified. I request a robustness test: vary the subtraction factor over a plausible range (e.g., 0.10-0.25) and demonstrate that ESO 059-G012 remains an outlier, or alternatively use an independent PAH tracer or a model-based stellar contribution to W3.
- [Section 3.4] The mean value qW3PAH = 2.5 ± 0.1 is quoted without stating explicitly whether ESO 059-G012 is excluded. If the galaxy with qW3PAH = 3.7 is included, the mean would be substantially higher; if it is excluded, this should be stated. The same ambiguity applies to the fit parameters m = 0.99 ± 0.11 and b = 10.9 ± 1.4 in Eq. (1). Please clarify the exact sample used for the mean and the fit, and report the number of galaxies included.
- [Section 4.2.3] The abstract claims that the interaction among NGC 3263, NGC 3256B, and NGC 3256C is "causing the Vela Cloud complex," but this goes beyond the data presented in the paper. The Vela Cloud is an H I structure (English et al. 2010) that is not detected in the radio continuum or WISE data of this work, and no new kinematic or morphological evidence is presented to establish causation. The text in Section 4.2.3 correctly attributes the scenario to English et al. (2010). The abstract and summary should be reworded to 'consistent with the scenario proposed by English et al. (2010)' or similar, unless new evidence is explicitly presented.
- [Section 3.5] The SED fitting results for ESO 059-G012 and NGC 2434 have extremely large uncertainties (e.g., TMC for NGC 2434 is 10.1+10.5-10.1 K, essentially unconstrained). These results are used in Section 4.1 to support the interpretation that ESO 059-G012 has low dust content and hence has consumed its gas. Given the wide confidence ranges, the SED fitting cannot distinguish a genuinely quenched system from a poorly constrained model. I recommend either removing the physical interpretation based on these SED results for the two galaxies, or explicitly presenting them as speculative rather than supportive evidence.
minor comments (5)
- [Appendix C] In the caption of Fig. C.1, 'ESO 59-G0012' appears to be a typo for 'ESO 059-G012'.
- [Table 1] The uncertainty on the spectral index for NGC 3256 is listed as -0.9 ± 0.01, which seems implausibly small for an in-band determination over 324 MHz; check whether this should be ±0.1.
- [Equation (2)] Equation (2) defines qW3PAH using F1.4GHz in the denominator, but the text states that the radio flux is measured at 1.3 GHz. Please clarify whether the flux is converted to 1.4 GHz or whether the notation is inconsistent.
- [Table 3] There are inconsistencies between SFR values quoted in the text and Table 3: for NGC 3256 the text gives SFRW3PAH = 34 M_sun/yr while Table 3 lists 50; for NGC 3256B the text gives 1.4 while Table 3 lists 2.1. Please harmonize the values.
- [Figure 4] The bottom panel is described as a 'histogram of the squared differences between observed and fitted values,' but the figure appears to show a scatter plot of residuals or a distribution; please clarify the plot type and axes.
Circularity Check
No significant circularity: the radio-W3PAH test uses independent MeerKAT fluxes and an explicitly external W3PAH definition, and the outlier and external comparisons give the central claim independent content.
full rationale
The central claimed result is that most galaxies in the sample follow the radio-W3PAH correlation, with ESO 059-G012 as the exception. The radio fluxes are new MeerKAT measurements, and the W3PAH fluxes are defined by an external prescription from Cluver et al. (2017), FW3PAH = W3 - 0.158*W1, not fitted to the radio data in this paper. The correlation therefore has independent empirical content: it could have failed, and in fact it fails for ESO 059-G012. The fit in Eq. 1 is descriptive, but the paper does not present the fitted line as an independent prediction; the qW3PAH mean is a summary of the same ratio, and its significance is anchored by comparison with external relations (Yun et al. 2001; Shao et al. 2018; Grundy et al. 2023). The TIR-radio fit is a coordinate transform of the W3PAH-radio fit through the explicitly stated Cluver et al. (2017) TIR calibration, so it is not a hidden independent confirmation. The exclusion of NGC 2434 (negative FW3PAH) is a consequence of the external subtraction formula and is openly stated; whether that formula extrapolates to quiescent early-type galaxies is an accuracy or assumption concern, not a circularity. Self-citations (Koribalski & Dickey 2004; English et al. 2010; Koribalski et al. 2024) supply H I context and data-processing details rather than the load-bearing correlation claim. No step in the paper reduces, by construction or by self-citation, to its own inputs.
Assumptions & free parameters
free parameters (5)
- WISE W3PAH subtraction factor =
0.158 (15.8% of W1)
- SFR-to-radio proportionality constants =
0.03 (Condon et al. 2002) and 4.76 (mass extrapolation)
- SFR-W3PAH calibration constants =
1.13 slope and -10.24 intercept (Cluver et al. 2014)
- TIR-W3PAH calibration =
0.889 slope and 2.21 intercept (Cluver et al. 2017)
- GalaPy SED parameters =
Table E.1 lists ranges for age, tau_star, psi_max, f_PAH, etc.
assumptions (5)
- domain assumption The 15.8% W1 subtraction correctly isolates PAH emission in W3 from stellar photospheric contamination.
- domain assumption The radio continuum at 1.3 GHz traces star formation with a fixed relation, including the thermal and synchrotron components.
- domain assumption The W3PAH luminosity traces the total infrared luminosity through the Cluver et al. (2017) relation.
- domain assumption Chabrier IMF and the GalaPy In-Situ model are appropriate for these galaxies.
- domain assumption The WISE colour-colour diagram categories (W2-W3 thresholds and W1-W2 = 0.8 AGN line) are meaningful for this sample.
Cite this review
Pith. "Pith review of MeerKAT radio continuum imaging of nearby star-forming spirals in the NGC 6221, NGC 3256/3263, and NGC 2434 galaxy groups." pith.science (2026). https://pith.science/paper/KQFDCZVC
@misc{pith2026250622382,
  author       = {Pith},
  title        = {Pith review of: MeerKAT radio continuum imaging of nearby star-forming spirals in the NGC 6221, NGC 3256/3263, and NGC 2434 galaxy groups},
  year         = {2026},
  howpublished = {\url{https://pith.science/paper/KQFDCZVC}},
  note         = {Machine review of arXiv:2506.22382}
}
read the original abstract
Context. We present high-resolution MeerKAT 1.3 GHz radio continuum images of star-forming spirals in the nearby galaxy groups around NGC 6221, NGC 3256/3263 and NGC 2434. This sample spans the evolutionary timeline for galaxy groups, encompassing early, intermediate, and late stages, respectively. The NGC 6221 group contains an interacting galaxy pair with tidal debris, along with at least three dwarf galaxies. In contrast, the NGC 3256/3263 group represents a loose group consisting of several spiral as well as dwarf galaxies, while a massive elliptical galaxy dominates the NGC 2434 group. Aims. We study the star formation activity in all detected galaxies, as it is one of the dominant physical processes in their formation and evolution, seeking evidence of environmental impact. Methods. We use MeerKAT radio continuum data and archival WISE infrared data to locate and measure the star formation rate in all group members. In particular, we used polycyclic aromatic hydrocarbons (PAH) as tracers of gas heated due to star formation activity. Furthermore, we create in-band spectral index maps, providing insights into the underlying physical processes associated with the detected star-forming regions. Results. We found that galaxies are distributed differently in the WISE colour-colour diagram depending on their evolutionary group stage, as expected. Except for ESO 059-G012, the galaxies in our sample follow the radio-W3PAH correlation. A possible scenario that explains the ESO 059-G012 result is that the galaxy has already consumed the gas. We also found evidence that the interaction among the spiral galaxies NGC 3263, NGC 3256B and NGC 3256C is causing the Vela Cloud complex and that the galaxies NGC 6221 and NGC 3256 might host a low-luminosity AGN, as was previously proposed in the literature.
Figures
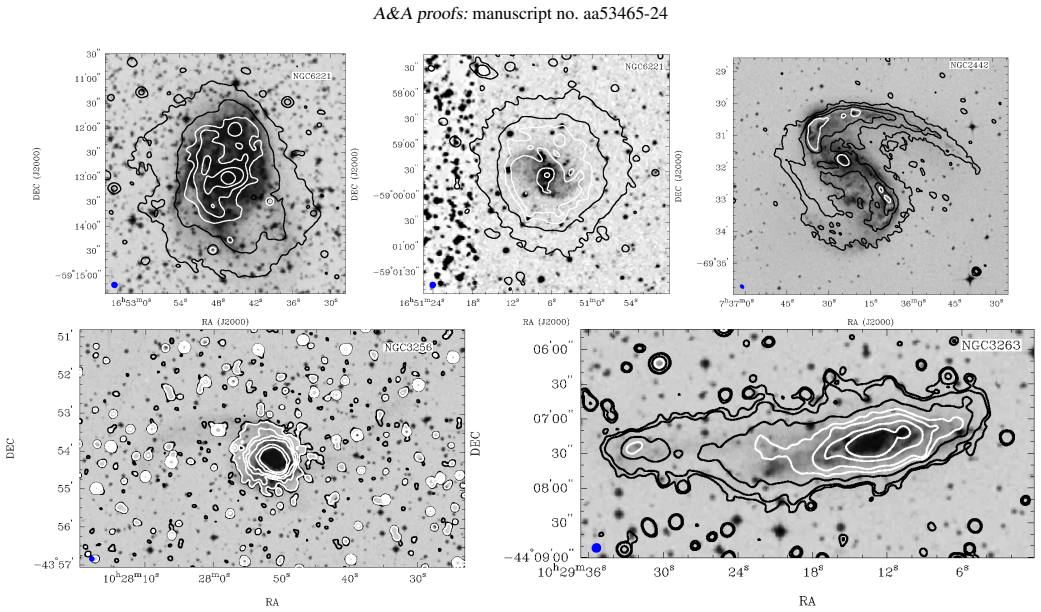


Figures from the paper (4 more)


Forward citations
Cited by 1 Pith paper
-
High resolution radio analysis of the starburst galaxy NGC 4527: signatures of an AGN core
New uGMRT radio maps resolve a compact non-thermal core in NGC 4527, suggesting a low-luminosity AGN, while two flanking sources trace a circumnuclear star formation ring.
Reference graph
Works this paper leans on
-
[1]
2021, , 507, 2643
An , F., Vaccari , M., Smail , I., et al. 2021, , 507, 2643
2021
-
[2]
2015, , 803, 51
Basu , A., Wadadekar , Y., Beelen , A., et al. 2015, , 803, 51
2015
-
[3]
F., McIntosh , D
Bell , E. F., McIntosh , D. H., Katz , N., & Weinberg , M. D. 2003, , 149, 289
2003
-
[4]
2024, , 977, 36
Bohn , T., Inami , H., Togi , A., et al. 2024, , 977, 36
2024
- [5]
-
[6]
2020, astropy/photutils: 1.0.1
Bradley , L., Sip o cz , B., Robitaille , T., et al. 2020, astropy/photutils: 1.0.1
work page 2020
-
[7]
2016, Photutils: Photometry tools , Astrophysics Source Code Library, record ascl:1609.011
Bradley , L., Sipocz , B., Robitaille , T., et al. 2016, Photutils: Photometry tools , Astrophysics Source Code Library, record ascl:1609.011
2016
-
[8]
Bressan , A., Silva , L., & Granato , G. L. 2002, , 392, 377
work page 2002
Show all 83 references
-
[9]
2016, , 590, A125
Cazzoli , S., Arribas , S., Maiolino , R., & Colina , L. 2016, , 590, A125
2016
-
[10]
2003, , 115, 763
Chabrier , G. 2003, , 115, 763
2003
-
[11]
E., Jarrett , T
Cluver , M. E., Jarrett , T. H., Dale , D. A., et al. 2017, , 850, 68
2017
-
[12]
E., Jarrett , T
Cluver , M. E., Jarrett , T. H., Hopkins , A. M., et al. 2014, , 782, 90
2014
-
[13]
Condon , J. J. 1992, , 30, 575
1992
-
[14]
J., Cotton , W
Condon , J. J., Cotton , W. D., & Broderick , J. J. 2002, , 124, 675
2002
-
[15]
Davies , L. J. M., Huynh , M. T., Hopkins , A. M., et al. 2017, , 466, 2312
2017
-
[16]
2017, , 602, A4
Delhaize , J., Smol c i \'c , V., Delvecchio , I., et al. 2017, , 602, A4
2017
-
[17]
T., et al
Delvecchio , I., Daddi , E., Sargent , M. T., et al. 2021, , 647, A123
2021
-
[18]
& Prodanovi \'c , T
Donevski , D. & Prodanovi \'c , T. 2015, , 453, 638
2015
-
[19]
C., & McCain , C
English , J., Koribalski , B., Bland-Hawthorn , J., Freeman , K. C., & McCain , C. F. 2010, , 139, 102
2010
-
[20]
P., Freeman , K
English , J., Norris , R. P., Freeman , K. C., & Booth , R. S. 2003, , 125, 1134
2003
-
[21]
English , J., Richardson , M. L. A., Ferrand , G., & Deg , N. 2024, CosmosCanvas: Useful color maps for different astrophysical properties
2024
-
[22]
1992, , 93, 211
Fouque , P., Gourgoulhon , E., Chamaraux , P., & Paturel , G. 1992, , 93, 211
1992
-
[23]
Garcia , A. M. 1993, VizieR Online Data Catalog, J/A+AS/100/47
1993
-
[24]
R., Wright , G
Graham , J. R., Wright , G. S., Meikle , W. P. S., Joseph , R. D., & Bode , M. F. 1984, , 310, 213
1984
-
[25]
A., Wong , O
Grundy , J. A., Wong , O. I., Lee-Waddell , K., et al. 2023, , 40, e012
2023
-
[26]
A., Armus , L., et al
Haan , S., Surace , J. A., Armus , L., et al. 2011, , 141, 100
2011
-
[27]
T., & Rowan-Robinson , M
Helou , G., Soifer , B. T., & Rowan-Robinson , M. 1985, , 298, L7
1985
-
[28]
K., Dey , S., Ronconi , T., et al
Humire , P. K., Dey , S., Ronconi , T., et al. 2025, , 699, A183
2025
-
[29]
2024, Galaxies, 12, 22
Irwin , J., Beck , R., Cook , T., et al. 2024, Galaxies, 12, 22
2024
-
[30]
H., Cluver , M
Jarrett , T. H., Cluver , M. E., Brown , M. J. I., et al. 2019, , 245, 25
2019
-
[31]
& MeerKAT Team
Jonas , J. & MeerKAT Team . 2016, in MeerKAT Science: On the Pathway to the SKA, 1
2016
-
[32]
Jonas , J. L. 2009, IEEE Proceedings, 97, 1522
2009
-
[33]
J \'o zsa , G. I. G., White , S. V., Thorat , K., et al. 2020 a , in Astronomical Society of the Pacific Conference Series, Vol. 527, Astronomical Data Analysis Software and Systems XXIX, ed. R. Pizzo , E. R. Deul , J. D. Mol , J. de Plaa , & H. Verkouter , 635
2020
-
[34]
J \'o zsa , G. I. G., White , S. V., Thorat , K., et al. 2020 b , CARACal: Containerized Automated Radio Astronomy Calibration pipeline
2020
-
[35]
L., Bohlin , R
Kinney , A. L., Bohlin , R. C., Calzetti , D., Panagia , N., & Wyse , R. F. G. 1993, , 86, 5
1993
-
[36]
1996, in Astronomical Society of the Pacific Conference Series, Vol
Koribalski , B. 1996, in Astronomical Society of the Pacific Conference Series, Vol. 106, The Minnesota Lectures on Extragalactic Neutral Hydrogen, ed. E. D. Skillman , 238
1996
-
[37]
& Dickey , J
Koribalski , B. & Dickey , J. M. 2004, , 348, 1255
2004
-
[38]
Koribalski , B. S. 2004, in IAU Symposium, Vol. 217, Recycling Intergalactic and Interstellar Matter, ed. P.-A. Duc , J. Braine , & E. Brinks , 34
2004
-
[39]
Koribalski , B. S. 2020, in IAU Symposium, Vol. 355, The Realm of the Low-Surface-Brightness Universe
2020
-
[40]
S., Staveley-Smith , L., Kilborn , V
Koribalski , B. S., Staveley-Smith , L., Kilborn , V. A., et al. 2004, , 128, 16
2004
-
[41]
S., Veronica , A., Dolag , K., et al
Koribalski , B. S., Veronica , A., Dolag , K., et al. 2024, , 531, 3357
2024
-
[42]
& Tully , R
Kourkchi , E. & Tully , R. B. 2017, , 843, 16
2017
-
[43]
2002, Science, 295, 82
Kroupa , P. 2002, Science, 295, 82
2002
-
[44]
& Valentijn , E
Lauberts , A. & Valentijn , E. A. 1989, The surface photometry catalogue of the ESO-Uppsala galaxies (.)
1989
-
[45]
Laustsen , S., Madsen , C., & West , R. M. 1987, Exploring the Southern Sky. A Pictorial Atlas from the European Southern Observatory (ESO) (.)
1987
-
[46]
K., Schinnerer , E., Hughes , A., et al
Leroy , A. K., Schinnerer , E., Hughes , A., et al. 2021, , 257, 43
2021
-
[47]
K., Schinnerer , E., Liu , D., et al
Leslie , S. K., Schinnerer , E., Liu , D., et al. 2020, , 899, 58
2020
-
[48]
2000, , 120, 645
L \' pari , S., D \' az , R., Taniguchi , Y., et al. 2000, , 120, 645
2000
-
[49]
& V \"o lk , H
Lisenfeld , U. & V \"o lk , H. J. 2000, , 354, 423
2000
-
[50]
& Dickinson , M
Madau , P. & Dickinson , M. 2014, , 52, 415
2014
-
[51]
D., Condon , J
Mauch , T., Cotton , W. D., Condon , J. J., et al. 2020, , 888, 61
2020
-
[52]
Menon , T. K. 1995, , 274, 845
1995
-
[53]
C., Sargent , M
Moln \'a r , D. C., Sargent , M. T., Leslie , S., et al. 2021, , 504, 118
2021
-
[54]
Murphy , E. J. 2013, , 777, 58
2013
-
[55]
J., Kenney , J
Murphy , E. J., Kenney , J. D. P., Helou , G., Chung , A., & Howell , J. H. 2009, , 694, 1435
2009
-
[56]
2020, , 643, A90
Nersesian , A., Viaene , S., De Looze , I., et al. 2020, , 643, A90
2020
-
[57]
Norris , R. P. & Forbes , D. A. 1995, , 446, 594
1995
-
[58]
2015, , 805, 162
Ohyama , Y., Terashima , Y., & Sakamoto , K. 2015, , 805, 162
2015
-
[59]
& Dwarakanath , K
Omar , A. & Dwarakanath , K. S. 2005, Journal of Astrophysics and Astronomy, 26, 89
2005
-
[60]
Pence , W. D. & Blackman , C. P. 1984, , 207, 9
1984
-
[61]
2020, , 641, A6
Planck Collaboration , Aghanim , N., Akrami , Y., et al. 2020, , 641, A6
2020
-
[62]
2013, , 87, 103014
Prodanovi \'c , T., Bogdanovi \'c , T., & Uro s evi \'c , D. 2013, , 87, 103014
2013
-
[63]
Reddy , N. A. & Yun , M. S. 2004, , 600, 695
2004
-
[64]
2024, , 685, A161
Ronconi , T., Lapi , A., Torsello , M., et al. 2024, , 685, A161
2024
-
[65]
D., Koribalski , B., Staveley-Smith , L., et al
Ryder , S. D., Koribalski , B., Staveley-Smith , L., et al. 2001, , 555, 232
2001
-
[66]
Ryder , S. D. & Koribalski , B. S. 2004, in IAU Symposium, Vol. 217, Recycling Intergalactic and Interstellar Matter, ed. P.-A. Duc , J. Braine , & E. Brinks , 44
2004
-
[67]
Salpeter , E. E. 1955, , 121, 161
1955
-
[68]
& Bedke , J
Sandage , A. & Bedke , J. 1994, The Carnegie atlas of galaxies , Vol. 638 (.)
1994
-
[69]
2019, , 632, A12
Schmidt , P., Krause , M., Heesen , V., et al. 2019, , 632, A12
2019
-
[70]
2009, , 398, 1573
Seymour , N., Huynh , M., Dwelly , T., et al. 2009, , 398, 1573
2009
-
[71]
S., Wang , J., Ho , L
Shao , L., Koribalski , B. S., Wang , J., Ho , L. C., & Staveley-Smith , L. 2018, , 479, 3509
2018
-
[72]
S., Steinhardt , C
Speagle , J. S., Steinhardt , C. L., Capak , P. L., & Silverman , J. D. 2014, , 214, 15
2014
-
[73]
J., et al
Stein , M., Heesen , V., Dettmar , R. J., et al. 2023, , 670, A158
2023
-
[74]
2016, , 826, 111
Stone , M., Veilleux , S., Mel \'e ndez , M., et al. 2016, , 826, 111
2016
-
[75]
S., Schinnerer , E., Murphy , E
Tabatabaei , F. S., Schinnerer , E., Murphy , E. J., et al. 2013, , 552, A19
2013
-
[76]
P., Ivison , R
Thomson , A. P., Ivison , R. J., Simpson , J. M., et al. 2014, , 442, 577
2014
-
[77]
C., Zeilinger , W
Vega Beltran , J. C., Zeilinger , W. W., Amico , P., et al. 1998, , 131, 105
1998
-
[78]
S., Williams , B
Verdes-Montenegro , L., Yun , M. S., Williams , B. A., et al. 2001, , 377, 812
2001
-
[79]
L., Eisenhardt , P
Wright , E. L., Eisenhardt , P. R. M., Mainzer , A. K., et al. 2010, , 140, 1868
2010
-
[80]
2024, , 975, 15
Yoon , I. 2024, , 975, 15
2024
-
[81]
S., Reddy , N
Yun , M. S., Reddy , N. A., & Condon , J. J. 2001, , 554, 803
2001
-
[82]
, " * write output.state after.block = add.period write newline
ENTRY address archiveprefix author booktitle chapter edition editor howpublished institution eprint journal key month note number organization pages publisher school series title type volume year label extra.label sort.label short.list INTEGERS output.state before.all mid.sent...
-
[83]
write newline
" write newline "" before.all 'output.state := FUNCTION n.dashify 't := "" t empty not t #1 #1 substring "-" = t #1 #2 substring "--" = not "--" * t #2 global.max substring 't := t #1 #1 substring "-" = "-" * t #2 global.max substring 't := while if t #1 #1 substring * t #2 gl...
Reviewed August 6, 2026 · model on record in the stance chip above.
Discussion (0). Continue with ORCID to comment.