REVIEW 2 major objections 5 minor 25 references
The real-time data processing and acquisition system for Project 8 Phase II
T0 review · 2 major / 5 minor · reviewed 2026-08-06 · deepseek-v4-flash
Pith's one-line read A three-channel DAQ triggers on electron chirps, cuts data by 96.7%, and varies by under 0.5%, so it drops out of the tritium spectrum analysis.
desk verdict Solid DAQ paper for Project 8 Phase II; the efficiency-vs-frequency claim is measured with 83mKr and may not transfer cleanly to tritium. read the letter →
The pith
A machine-rendered reading of the paper's core claim, the machinery that carries it, and where it could break.
The reading
What carries the argument
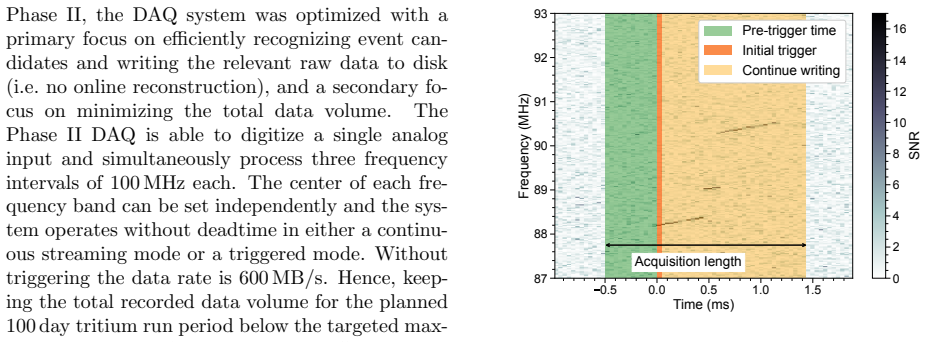
The load-bearing mechanism is the frequency-mask trigger combined with the event-builder finite state machine. The frequency-mask trigger stores a pre-recorded mask derived from the mean and standard deviation of per-bin noise power, and flags any FFT record whose power exceeds the mask; the event builder then decides which flagged records start, continue, or end an acquisition by using pre-trigger buffering, skip-tolerance gap filling, and an n-triggers requirement. This two-stage design is what lets the system reject 96.7% of the incoming data while still capturing event starts. A supporting piece is the fitted two-pole band-pass efficiency function used to choose channel center frequencies so that between-channel efficiency loss stays below 0.5%.
What would settle it
Inject calibrated chirp signals with known signal-to-noise ratio, duration, and start frequency directly into the RF chain ahead of the digitizer, run the production trigger, and compare the recorded-event fraction to the simulated efficiency curves of Section 3.3 and the frequency-efficiency fit of Section 3.4; a deviation larger than the quoted <0.5% frequency dependence, or an 18% loss that changes materially, would show the trigger is not as well understood as claimed.
Extended reading notes
Core claim
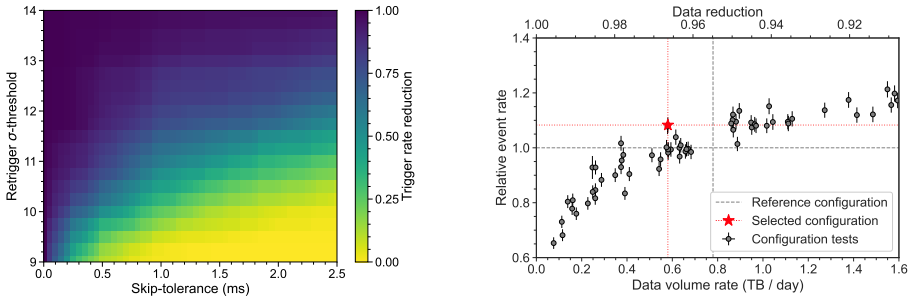
The Phase II DAQ is a single analog-to-digital conversion chain split on an FPGA into three independent channels, each down-converting a separate 100 MHz band and producing both time-domain and frequency-domain streams. A software trigger uses the frequency-domain stream: a frequency-mask trigger compares each 40.96 microsecond FFT record against a pre-recorded noise mask, and an event-builder state machine assembles acquisitions by adding a 2 ms pre-trigger, filling gaps up to 0.5 ms, and requiring two threshold crossings ($13.5\sigma$ high, $11\sigma$ low). The authors show that this configuration achieves 96.7% data reduction, no deadtime at Phase II trigger rates, and an 18% loss of offline-reconstructable events that is concentrated in low-SNR events, whose reconstructed start frequencies would be less precise anyway. They fit the trigger efficiency versus frequency with a two-sided band-pass filter function and place the three channel centers so that the efficiency drop between channels is below 0.5%, small enough to neglect in the tritium analysis; the DAQ, they conclude, could be eliminated as a source of systematic uncertainty in the spectrum.
Load-bearing premise
The load-bearing premise is that the simulated CRES chirps, with their chosen distribution of signal-to-noise ratios and durations, faithfully reproduce the signals of real electrons; the paper rests this on a reconstruction paper that is listed as in preparation and not publicly available.
Editorial extensions
If this is right
- The recorded tritium spectrum does not carry a DAQ-induced shape distortion at the level of the Phase II statistical precision, since the trigger efficiency varies by less than 0.5% across the analysis window.
- The 100-day tritium run stays within the 200 TB storage budget because triggered recording holds the data volume near 2 TB per day instead of 600 MB/s.
- The 18% of offline-reconstructable events that the trigger misses are mostly low-SNR events, so the recorded data are biased toward events with more precise reconstructed start frequencies.
- The same three-channel, mask-trigger, event-builder architecture can carry into later Project 8 phases, where the paper says higher event rates and cavity-based detection are expected.
Reading between the lines
- A direct consequence the authors leave implicit is that the frequency-dependent efficiency curve, though flat enough for Phase II, will need to be folded into the fit or made flatter once a larger-statistics Phase III spectrum is analyzed.
- The claim that the DAQ can be eliminated as a systematic uncertainty is only as strong as the simulated signal model; injecting calibrated synthetic chirps at the antenna input would give a direct, model-independent check of the efficiency curves.
- Deliberately discarding low-SNR events to improve frequency resolution trades a small efficiency loss for a bias in the measured spectrum; whether that bias is benign depends on the offline fit, not on the trigger alone.
- The multi-channel design also enables a cheap systematic check the paper did not emphasize: recording the same frequency band in two channels with different thresholds during production, so the efficiency difference can be measured on real data rather than simulation.
Editorial analysis
A structured set of objections, weighed in public.
Referee Report
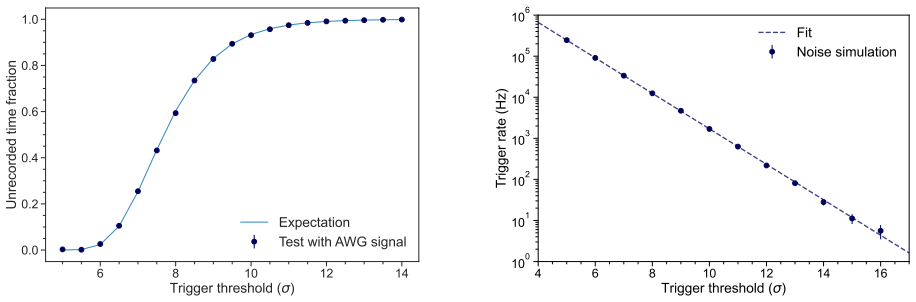
Summary. The paper describes the Project 8 Phase II data acquisition system, comprising a ROACH2 ADC/FPGA front end that digitizes a 1.6 GHz IF band and digitally downconverts three independent 100 MHz channels, and the Psyllid software trigger that processes frequency-domain spectra in real time and writes triggered time-domain acquisitions to HDF5/Egg files. The authors report that the system operates without deadtime at production trigger rates, achieves a 96.7% data reduction, and has a trigger efficiency whose dependence on frequency across the tritium analysis band is below 0.5%, leading them to conclude in Section 3.5 that the DAQ can be eliminated as a source of systematic uncertainty in the tritium spectrum analysis. The paper also documents trigger parameter optimization with 83mKr data, simulation studies of trigger efficiency versus SNR and event duration, and a measured channel-edge efficiency rolloff fitted with a band-pass filter function.
Significance. If the central claims hold, this is a valuable instrumentation paper for the CRES community and for neutrino-mass experiments more broadly. The strengths are substantial: the deadtime performance is tested directly with an AWG white-noise source (Section 3.1); the 96.7% data reduction is a measured operational quantity; the frequency-efficiency scan using three parallel channels and a stationary reference channel (Section 3.4.1) is a clean and clever measurement; and the paper openly discloses known limitations, including HDF5 thread-safety crashes, file-split event loss, and the 5-sigma deadtime edge. The software (Psyllid, Midge, Monarch) is publicly available with DOIs, which supports reproducibility. The significance would be higher if the paper fully supported the claim that the DAQ is not a source of systematic uncertainty in the tritium spectrum, because that claim goes beyond the measured 83mKr-based hardware rolloff.
major comments (2)
- [Section 3.4.2 and Section 3.5] The central conclusion that the DAQ 'could be eliminated as a source of systematic uncertainty' rests on the measured efficiency-vs-frequency profile, but that profile was obtained with 83mKr K-line electrons only (Section 3.4.1, Figure 16b) and then applied to tritium running conditions. The efficiency-vs-SNR curve in Figure 13 is strongly nonlinear, and Section 3.3.2 states that low-SNR events, which are preferentially missed by the trigger, are detected at different frequencies because they have large longitudinal trajectories and experience different average magnetic fields. A population of lower-SNR, frequency-correlated events can therefore steepen the frequency dependence of the trigger efficiency relative to the 83mKr K-line sample, even if the hardware rolloff is identical. The paper does not report a direct measurement or simulation of efficiency versus frequency under tritium-like SNR conditions, and the statement in Section 3.3.2 that the trigger inefficiency 'narrows the spread of detected frequencies' actually indicates a spectral-shape effect rather than a negligible one. Please either provide a tritium-like efficiency-vs-frequency measurement/simulation, or explicitly quantify this transfer systematic in the tritium analysis and adjust the Section 3.5 claim accordingly.
- [Section 3.3] The simulation-based results in Section 3.3, including the 18% loss of reconstructable events reported in Section 3.3.2 and the SNR/duration efficiency curves in Figures 13-15, depend on the assertion that Locust-generated signals 'well reproduce' real CRES electrons. This assertion is cited to reference [11], which is listed as 'in preparation (2022)' and is not publicly available. Because this unpublished reference also underlies the claim that low-SNR events are frequency-correlated, the reader cannot independently verify a load-bearing part of the systematic-uncertainty argument. Please include a validation figure comparing simulated and real event properties, or cite a publicly available analysis that establishes this fidelity.
minor comments (5)
- [Section 2.1] There is a typo in 'measurig' in the sentence describing why the starting frequency is critical.
- [Figure 12] The y-axis label 'Counts per 40.96 s' appears to be a unit error; the record length is 40.96 microseconds, so the label should presumably read 'per 40.96 µs'.
- [Figure 16b] The residuals panel label 'Residuals ( )' is missing the unit; it should indicate that residuals are in units of sigma or in relative efficiency.
- [Section 2.4.5] The HDF5 thread-safety crash is described qualitatively; please state how frequently crashes occurred during Phase II operations, how they were detected, and whether any runs were lost as a result.
- [Section 3.1] The 5-sigma deadtime test shows a 0.28% unrecorded fraction instead of the expected >99.99% recorded fraction; please state explicitly what mechanism caused this shortfall (e.g., buffer overflow, packet loss) and confirm that no analogous loss is expected at the >=13 sigma thresholds used in production.
Circularity Check
Simulation fidelity for the 18% event-loss claim rests on an unpublished self-citation; the central DAQ-systematic claim is independently measured.
-
self citation load bearing
[Section 3.3, 'Trigger performance in simulation', first paragraph (Locust setup); reference [11]]
"The distributions of track duration and number of tracks in an event are found by doing an exponential and geometric fit respectively to the reconstructed real data. The SNR distribution is obtained from the calculated power coupled to a waveguide by simulated electrons in a magnetic trap (see, for example, Figure 15). It was shown that this way, the signal of real CRES electrons is well reproduced [11]."
The simulated trigger-efficiency curves (Figures 13-15) and the resulting claim that 'the trigger misses 18% of all events that could be reconstructed offline' (Section 3.5) depend on the assertion that Locust-generated signals 'well reproduce' real CRES electrons. That assertion is supported solely by reference [11], an unpublished 'in preparation (2022)' paper by the same collaboration. The simulation inputs are themselves fits to reconstructed real data, and the cited validation is not machine-checked, code-reproduced, or otherwise independently available in this paper. Thus the load-bearing premise of the simulation-based performance numbers reduces to an unverified self-citation rather than to an independent external result.
full rationale
The paper's central claim that the DAQ 'could be eliminated as a source of systematic uncertainty' is supported by direct measurements: the deadtime test with an arbitrary waveform generator (Section 3.1), the parallel 83mKr trigger-parameter scans (Section 3.2.2), the tone-injection SNR scan (Figure 16a), and the 83mKr-based efficiency-vs-frequency scan (Figure 16b). Equation (2) is a characterization fit to those data, and the <0.5% efficiency drop is a design requirement imposed on the fitted curve, not a prediction of an independent quantity; using the fit to choose channel locations does not make the resulting efficiency claim circular. The main non-circular concern is the transfer of the 83mKr-measured efficiency shape to tritium running conditions, which is an extrapolation and a potential correctness risk rather than a circularity. The only identified circular pattern is the load-bearing self-citation of reference [11] for the simulation's fidelity, which affects the 18% event-loss claim but not the directly measured frequency-efficiency result. Overall, no prediction in the paper reduces by construction to its fitted inputs, so the circularity score is moderate.
Assumptions & free parameters
free parameters (6)
- pre-trigger time =
2 ms
- skip-tolerance =
0.5 ms
- n-triggers =
2
- FMT high-threshold =
13.5 sigma
- FMT low-threshold =
11 sigma
- Gain fit parameters (A, fcut1, fcut2, p1, p2) =
A=1.001±0.002, fcut1=89.8±0.1 MHz, fcut2=8.4±0.1 MHz, p1=31.4±1.3, p2=-2.3±0.2
assumptions (3)
- standard math Electron cyclotron frequency is inversely proportional to total energy (Equation 1).
- standard math Noise power in a frequency bin is exponentially distributed.
- domain assumption Locust simulations with parameters drawn from real-event fits reproduce the signal properties of actual CRES electrons.
Cite this review
Pith. "Pith review of The real-time data processing and acquisition system for Project 8 Phase II." pith.science (2026). https://pith.science/paper/YY5MNLKE
@misc{pith2026250622392,
  author       = {Pith},
  title        = {Pith review of: The real-time data processing and acquisition system for Project 8 Phase II},
  year         = {2026},
  howpublished = {\url{https://pith.science/paper/YY5MNLKE}},
  note         = {Machine review of arXiv:2506.22392}
}
abstract
In Phase II of the Project 8 neutrino mass experiment, electrons from the decays of tritium or ${}^{83\mathrm{m}}$Kr are detected via their $\approx$26 GHz cyclotron radiation while contained within a circular waveguide. The signal from a given electron is characterized as a brief chirp, lasting $\lesssim$10 ms and changing in frequency by $\lesssim$1 MHz/ms. To detect these signals, the Project 8 collaboration developed a data acquisition (DAQ) system tailored to the signal properties. The DAQ is responsible for simultaneously selecting up to three 100 MHz-wide frequency windows to study, detect, and trigger on likely signals from different electron kinetic energies, and for writing the relevant data to disk. We describe the Phase II DAQ system in detail and address how the system was used for data-taking operations.
Figures


Figures from the paper (13 more)




Reference graph
Works this paper leans on
-
[11]
A. Ashtari Esfahani, et al., Reconstruction of electron events from cyclotron radiation emission spectroscopy for the Project 8 experiment, in preparation (2022)
work page 2022
-
[1]
G. Drexlin, V. Hannen, S. Mertens, C. Weinheimer, Current direct neutrino mass experiments, Adv. High Energy Phys. 2013 (2013) 293986. arXiv:1307.0101, doi:10.1155/2013/293986
arXiv 2013
-
[2]
J. A. Formaggio, A. L. C. de Gouvˆ ea, R. G. H. Robert- son, Direct Measurements of Neutrino Mass, Phys. Rept. 914 (2021) 1–54. arXiv:2102.00594, doi:10. 1016/j.physrep.2021.02.002
arXiv 2021
-
[3]
A. Ashtari Esfahani, et al., Determining the neu- trino mass with cyclotron radiation emission spec- troscopy—Project 8, J. Phys. G 44 (5) (2017) 054004. arXiv:1703.02037, doi:10.1088/1361-6471/aa5b4f
arXiv 2017
-
[4]
B. Monreal, J. A. Formaggio, Relativistic cyclotron radiation detection of tritium decay electrons as a new technique for measuring the neutrino mass, Phys. Rev. D 80 (2009) 051301. doi:10.1103/PhysRevD.80. 051301. URL https://link.aps.org/doi/10.1103/PhysRevD. 80.051301
-
[5]
Electron Radiated Power in Cyclotron Radiation Emission Spectroscopy Experiments
A. Ashtari Esfahani, et al., Electron Radiated Power in Cyclotron Radiation Emission Spectroscopy Exper- iments, Phys. Rev. C 99 (5) (2019) 055501. arXiv: 1901.02844, doi:10.1103/PhysRevC.99.055501
work page Pith review arXiv 2019
-
[6]
D. M. Asner, et al., Single electron detection and spec- troscopy via relativistic cyclotron radiation, Phys. Rev. Lett. 114 (16) (2015) 162501. arXiv:1408.5362, doi: 10.1103/PhysRevLett.114.162501
work page Pith review arXiv 2015
-
[7]
A. Ashtari Esfahani, et al., Tritium Beta Spectrum Measurement and Neutrino Mass Limit from Cyclotron Radiation Emission Spectroscopy, Phys. Rev. Lett. 131 (10) (2023) 102502. arXiv:2212.05048, doi:10. 1103/PhysRevLett.131.102502
arXiv 2023
Show all 25 references
-
[8]
Ashtari Esfahani, et al., Cyclotron radiation emis- sion spectroscopy of electrons from tritium β decay and Kr83m internal conversion, Phys
A. Ashtari Esfahani, et al., Cyclotron radiation emis- sion spectroscopy of electrons from tritium β decay and Kr83m internal conversion, Phys. Rev. C 109 (3) (2024) 035503. arXiv:2303.12055, doi:10.1103/PhysRevC. 109.035503
2024 arXiv
- [9]
-
[10]
A. A. Esfahani, et al., Project 8 apparatus for cyclotron radiation emission spectroscopy with 83mkr and tritium (2025). arXiv:2503.08807. URL https://arxiv.org/abs/2503.08807
2025 arXiv
-
[12]
N. A. Patel, et al., Characterizing the performance of a high-speed ADC for the SMA digital backend, Journal of Astronomical Instrumentation 3 (01) (2014) 1450001
2014
-
[13]
H. Jiang, et al., Digitizing the Yuan Tseh Lee Array for microwave background anisotropy by 5Gsps ADC boards, in: 2012 19th IEEE International Conference on Electronics, Circuits, and Systems (ICECS 2012), 2012, pp. 304–307. doi:10.1109/ICECS.2012.6463741
2012
-
[14]
Hickish, et al., A decade of developing radio- astronomy instrumentation using CASPER open- source technology, Journal of Astronomical Instrumen- tation 5 (04) (2016) 1641001
J. Hickish, et al., A decade of developing radio- astronomy instrumentation using CASPER open- source technology, Journal of Astronomical Instrumen- tation 5 (04) (2016) 1641001
2016
-
[15]
K. K. Parhi, D. G. Messerschmitt, Pipeline interleaving and parallelism in recursive digital filters. I. Pipelining using scattered look-ahead and decomposition, IEEE Transactions on Acoustics, Speech, and Signal Process- ing 37 (7) (1989) 1099–1117. doi:10.1109/29.32286
1989 doi
-
[16]
Claessens, B
C. Claessens, B. H. LaRoque, N. S. Oblath, Psyl- lid v1.9.3, https://github.com/project8/psyllid (2019). doi:10.5281/zenodo.2621401. URL https://doi.org/10.5281/zenodo.2621401
2019 doi
-
[17]
N. S. Oblath, et al., Monarch, accessed: 2020-5-13 (Aug. 2018). doi:10.5281/zenodo.1325961. URL https://github.com/project8/monarch 21
2020 doi
-
[18]
URL http://www.hdfgroup.org/HDF5
The HDF Group, Hierarchical data format version 5, accessed: 2019-10-4 (2000-2010). URL http://www.hdfgroup.org/HDF5
2019
-
[19]
Oblath, B
N. Oblath, B. LaRoque, N. Buzinsky, dripline- org/dripline: Dripline3 First Production Release (May 2021). doi:10.5281/zenodo.4768475. URL https://doi.org/10.5281/zenodo.4768475
2021 doi
-
[20]
B. H. LaRoque, Cyclotron Radiation Emission Spec- troscopy: first demonstration and performance bench- marks from the Project 8 experiment, Ph.D. thesis, UCSB (2017)
2017
-
[21]
Furse, N
D. Furse, N. S. Oblath, Midge, https://github.com/project8/midge (2019). doi:10.5281/zenodo.2621395. URL https://doi.org/10.5281/zenodo.2621395
2019 doi
-
[22]
D. L. Furse, Techniques for Direct Neutrino Mass Mea- surement Utilizing Tritium β-Decay, Ph.D. thesis, MIT (2015)
2015
-
[23]
IEEE and The Open Group, The Open Group Base Specifications, Tech. Rep. 7 (2018). URL https://pubs.opengroup.org/onlinepubs/ 9699919799/functions/V2_chap02.html#tag_15_10
2018
-
[24]
The Linux Kernel Archives, https://www.kernel.org/ doc/Documentation/networking/packet_mmap.txt, ac- cessed: 2020-02-21 (2009)
2009
-
[25]
A. A. Esfahani, et al., Locust: C++ software for simu- lation of RF detection, New Journal of Physics 21 (11) (2019) 113051. doi:10.1088/1367-2630/ab550d. URL https://doi.org/10.1088/1367-2630/ab550d 22
2019 doi
Reviewed August 6, 2026 · model on record in the stance chip above.
Discussion (0). Sign in to comment.