REVIEW 4 major objections 5 minor 22 references
A Correlation-Based Design of RIS for Reduced Power Consumption and Simplified Control Circuitry
T0 review · 4 major / 5 minor · reviewed 2026-08-06 · deepseek-v4-flash
Pith's one-line read Grouping correlated RIS elements into shared control lines cuts power use by up to 92% while preserving coverage.
desk verdict The Connected-RIS grouping idea has merit, but the power model is internally inconsistent; the 86-92% savings figure is not supported. read the letter →
The pith
A machine-rendered reading of the paper's core claim, the machinery that carries it, and where it could break.
The reading
What carries the argument
The load-bearing mechanism is the correlation test applied to the phase-shift matrices. For each steering direction, Algorithm 1 generates a matrix $\Psi_q$ from the channel phases; Algorithm 2 then computes the phase difference for every element pair across all $Q$ matrices, and a pair is marked correlated if the difference never exceeds the threshold $\psi_{\rm th}$ (about 28–31° in the simulations). Because the correlated pairs turn out to be the elements sharing a column, the design collapses the control structure: one load impedance and one DC control line per column, instead of per element. The same grouping also redefines the unit count in the power model, which is the source of the reported 86–92% saving.
What would settle it
Build or simulate a Connected-RIS prototype with column-shared controls and measure the beam pattern while the user's elevation angle moves away from the design value; if the gain falls by more than the 3–6 dB margin used to size the surface, the shared-column premise fails. Alternatively, recompute the panel power using the per-element supporting-power figure of about 3.7 mW cited from [9] instead of the per-column unit power; if the saving drops below the claimed 86–92%, the reported reduction is an artifact of the power model.
Extended reading notes
Core claim
The central claim is that the phase-shift values needed to steer a RIS across the azimuth coverage region $-80^\circ$ to $80^\circ$ are correlated along columns: for each column, the phase difference between any two elements remains below a threshold $\psi_{\rm th}$ for every steering direction in that range. The paper defines two elements as correlated when this condition holds across all the phase-shift matrices $\{\Psi_q\}$ generated for the coverage sector, and the correlation analysis for three deployment cases (RIS near the base station, midway, and near the user) shows the correlated clusters are entire columns. This leads to the Connected-RIS architecture, where only the first row of elements is independently controlled and each column is driven by one shared control signal. The paper shows that this cuts the number of load impedances from $N^2$ to $N_z$ — for instance, from 6,889 to 83 for an $83\times 83$ surface — and, under its power model that charges per controlled unit rather than per physical element, reduces panel power from about 78–108 W to about 6 W across the deployment cases, with the RIS gain remaining sufficient for fair coverage and the achievable rate practically unchanged.
Load-bearing premise
The whole saving rests on the assumption that every element in a column can be driven by a single shared control signal without changing the beam, because their phase-shift differences stay below a fixed threshold for every steering direction in the coverage range — a property the paper verifies only for a fixed elevation angle.
Editorial extensions
If this is right
- An $83\times 83$ Connected-RIS can cover the whole $160^\circ$ sector with 52 codewords, versus 80 for the min-gain fully controlled RIS, and the codeword storage shrinks to about 12,948 bits from 1,075,684 bits.
- In the paper's case study, both a dynamically reconfigured panel and a fixed 52-panel layout consume about 314 W, compared with 5,629 W for the 6-dB fully controlled RIS and 2,279 W for the min-gain RIS.
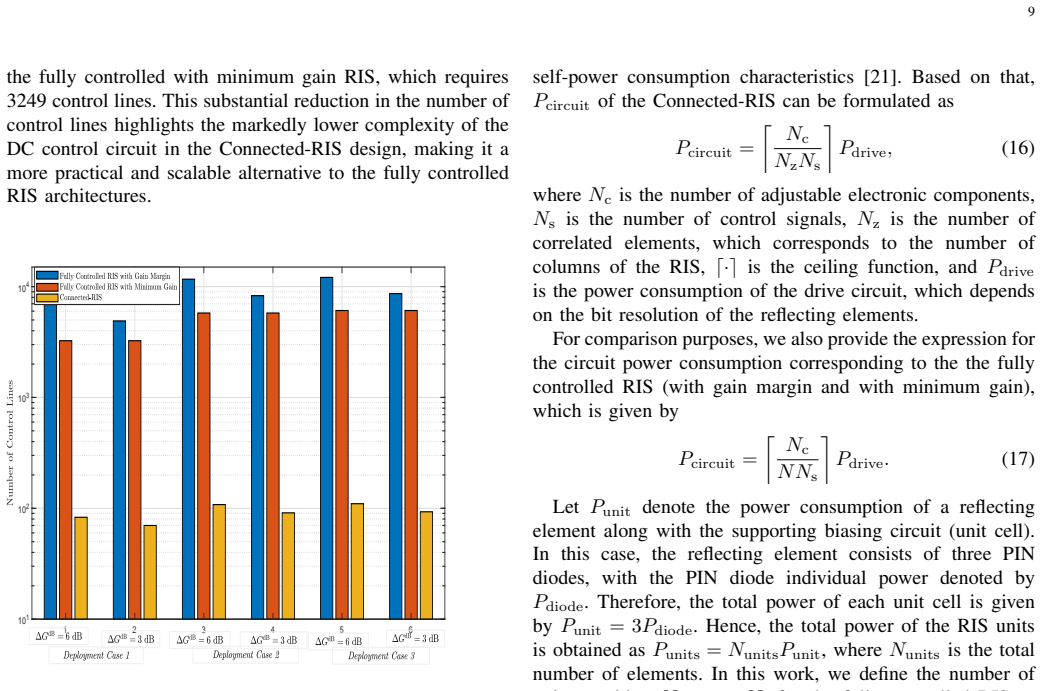
- Control signals drop by 83–98% across the deployment cases, so the DC wiring, FPGAs, and interfaces scale with the number of columns $N_z$ rather than the element count $N^2$, easing large-aperture implementation.
- The fair-coverage methodology (equating the RIS-assisted received power to the direct BS-UE link, plus a 3 or 6 dB margin) gives a direct way to size the minimum number of elements for any deployment before applying the correlation grouping.
Reading between the lines
- The column-correlation result is established for fixed elevation angles; if user elevation varies, the vertical phase gradient changes across a column, so the shared-control grouping would need to be re-derived for each elevation slice or abandoned.
- The magnitude of the power saving is largely determined by the paper's decision to count one unit per column rather than per element; if per-element supporting circuitry (about 3.7 mW per element in the cited measurements) were charged, the saving would shrink toward the control-line reduction only.
- A natural extension is to treat the correlation threshold $\psi_{\rm th}$ as a tunable design parameter that trades a small gain loss for even coarser grouping, instead of fixing it near 30° by simulation.
Signed reviews
Editorial analysis
A structured set of objections, weighed in public.
Referee Report
Summary. The paper proposes Connected-RIS, a reconfigurable intelligent surface in which elements whose required phase shifts remain within a threshold across all azimuth steering directions in [-80 degrees, 80 degrees] are connected and share one control signal. It derives a fair-coverage RIS sizing rule using a 3GPP path-loss model, performs a correlation analysis over azimuth angles in three deployment cases, and compares the Connected-RIS with fully controlled min-gain and gain-margin RIS baselines in terms of number of loads, control lines, power consumption, gain, and data rate. The headline claims are reductions of 86-92% in power and 83-98% in control signals while maintaining sufficient gain for fair coverage.
Significance. The architectural idea is timely and, if properly validated, could be useful for reducing RIS control complexity. The paper's strength is its concrete design flow: a coverage-based sizing method, a clear grouping criterion, and comparisons against two reasonable baselines. However, the main quantitative results currently rest on an unvalidated and internally inconsistent power model and on threshold values fitted to the data, so the claimed savings are not yet established. The fixed-elevation assumption also needs to be reconciled with the claim of three-dimensional beamforming.
major comments (4)
- [V-B, Table II, Eqs. (16)-(17)] The power-consumption model and Table II are internally inconsistent. For Deployment Case 1, the min-gain RIS has 57x57=3249 elements; with the stated Punit=15 mW, Punits alone is 48.735 W. Adding Pcontrol=4.8 W and the smallest possible Pcircuit from Eq. (17), namely Pdrive=75 mW, gives at least 53.61 W, but Table II reports 43.815 W. The Connected-RIS rows are also inconsistent with the stated 70/83 column counts: the reported 5.86 W and 6.045 W imply Nunits of about 66 and 78 under the stated Punit and Pcontrol values, not 70 and 83. More fundamentally, Eqs. (16)-(17) yield Pcircuit approximately equal to Pdrive for a large array regardless of N, so they do not capture the dependence of drive power on the number of control signals that the paper's own motivation in Refs. [9], [20], [21] emphasizes. Because the abstract's 86-92% savings figure is computed from Table II, the paper's central quantitative claim is not supported by the model as presented.
- [IV-A, Fig. 6] The threshold psi_th is chosen per deployment case to maximize the number of correlated columns, e.g., psi_th=31 degrees for Case 1 with DeltaG=3 dB and psi_th=30 degrees for Case 1 with DeltaG=6 dB, with analogous choices for Cases 2 and 3. The reported control-line and power reductions are therefore obtained at threshold values fitted to the same data used to compute the savings. No a priori criterion for selecting psi_th and no sensitivity analysis around the chosen values are provided, so the 83-98% control-signal reduction is not established as a robust design prediction.
- [IV-A, V-C] The entire grouping procedure assumes a fixed elevation angle theta_UE. Because columns are grouped as single control signals, any variation in elevation changes the vertical phase gradient across a column and can make the within-column phase differences exceed psi_th. The paper does not evaluate this case, so the abstract's claim of three-dimensional passive beamforming is not supported by the fixed-elevation analysis; either the design's scope should be explicitly limited to fixed-elevation deployments or a variable-elevation validation is needed.
- [V-B, Eq. (15), definition of Nunits] The model sets Nunits=Nz for the Connected-RIS, i.e., it counts unit-cell power only for the first row of each column. Grouping control lines does not by itself remove the PIN diodes or bias circuits of the remaining N-Nz elements unless a specific circuit topology is described in which an entire column is driven by a single load. Without such a topology, the Connected-RIS unit-cell power is undercounted by a factor of approximately N/Nz, which directly affects the claimed savings.
minor comments (5)
- [Section II vs. Section V-A] The symbol N_z is defined as the number of rows in Section II but as the number of columns/groups in Section V-A; please use a distinct symbol for the number of groups.
- [Eq. (13) and Section III-B] The use of N is inconsistent: Eq. (13) defines N as the square root of the linear gain, while the text speaks of "N^2 >= 4799 elements" and then reports sizes such as 70x70; please clarify whether N is the number of elements per side or the total number of elements.
- [Algorithm 1, line 13] The update rule "phi_{q+1} = phi_q + DeltaPhi/2" introduces an unexplained factor of one-half; please verify whether this factor is intended.
- [Algorithm 2] The threshold comparison should explicitly wrap the phase differences to [0, 2*pi) before comparison with psi_th, otherwise aliasing at the 2*pi boundary can produce false correlations.
- [Figures 6, 8, 9] The axis tick labels in the preprint appear corrupted, e.g., "0 1 02 03 04 05 06 07 08 09 0"; the published version should use the original uncorrupted figures.
Circularity Check
Headline savings (86-92% power, 83-98% control signals) reduce by construction: control lines equal the number of correlation groups by definition, and the threshold ψth is tuned to maximize that group count, so the percentages are the fitted objective, not independent predictions.
-
self definitional
[Section V-A (Control and Load Impedance) and Section IV-A (definition of the Connected-RIS group structure)]
"In the Connected-RIS architecture, the first element of each column is a reconfigurable unit modeled by a load impedance Zi, where i ∈ {1, . . . , Nz}. Here, Nz denotes the number of groups of correlated elements, which corresponds to the number of columns in the structure."
The headline control-signal reduction is a definitional consequence, not an independently predicted result. Section V-A defines the Connected-RIS so that only the first element of each column is a reconfigurable unit, giving exactly Nz control lines for a surface with N elements; hence the saving reported in the abstract (83-98%) is the arithmetic identity 1 − Nz/N once the grouping is adopted. The correlation analysis (Algorithms 1-2) only determines which elements may share a line; the magnitude of the saving is fixed by the definition that each column shares one control signal.
-
fitted input called prediction
[Section IV-A (Fig. 6 threshold selection) and Section V-B (Table II savings claims)]
"Since the threshold value ψth directly impacts the number of correlated elements, next we analyze this relationship. Figure 6 illustrates the relationship between the number of correlated columns and the threshold value ψth for the three deployment cases described in section III-B. For instance, in deployment case 1, where the RIS is near the BS, the maximum number of correlated elements occurs at ψth = 31◦ for ∆GdB = 3 and at ψth = 30◦ for ∆GdB = 6, indicating optimal threshold values for these configurations. ..."
The savings percentages are the value of the fitted objective. With Eqs. (15)-(17), the Connected-RIS power is PP = PFPGA + Nz·Punit + small, monotonically decreasing in the number of groups Nz, so maximizing the number of correlated columns maximizes the headline savings. The paper explicitly tunes the threshold to achieve this maximum ('the maximum number of correlated elements occurs at ψth = 31◦ ... indicating optimal threshold values'), and then reports the resulting reduction (92.5%, hence '86-92%') as a demonstrated finding. The same dataset is used for the fit and for the reported outcome, so the quantitative claim is forced by the parameter choice; the paper itself notes that at lower thresholds (ψth = 15◦) correlation is 'notably reduced,' which would shrink the savings.
1 more flagged steps
-
other
[Section V-B, Eqs. (15)-(17) and Table II]
"Let Punit denote the power consumption of a reflecting element along with the supporting biasing circuit (unit cell). ... the total power of the RIS units is obtained as Punits = NunitsPunit ... In this work, we define the number of units as either Nunits = N, for the fully controlled RIS ... We assume that the power consumption of a RIS unit is Punit = 15 mW."
Flagged as missing support under the reviewing rule. The text claims Table II is 'Based on these values' (Punit = 15 mW, PFPGA = 4.8 W, Pdrive = 75 mW) together with Eqs. (15)-(17), but the min-gain RIS row cannot be produced from them: in Deployment Case 1 the min-gain RIS has N = 57×57 = 3249 elements, so the unit-cell power alone is 3249×0.015 = 48.735 W, and adding the 4.8 W FPGA gives 53.535 W, already above the tabulated 43.815 W before any Pcircuit term. Thus the headline 86-92% figure is computed from table entries that the paper's own stated model does not yield; the claimed derivation from the power model is absent. This is an internal inconsistency weighed in the verdict rather than a reduction.
full rationale
Where the paper is not circular: the column correlation that motivates the Connected-RIS is computed from phase-shift matrices generated from an external 3GPP/Rician channel model plus the standard phase-conjugation rule (Eq. (14), ref. [19]), and the beamforming validity of grouping whole columns is checked against that same external model in Sections V-C and V-D (Figs. 10-14). So the claim that a Connected-RIS still provides fair coverage has independent content. Where the paper is partly circular: the two headline quantitative claims — 'reduces the power consumption by almost 86-92% and the control signals by 83-98%' — reduce by construction. Control lines in the Connected-RIS are, by its definition (Section V-A), exactly the number of columns/groups Nz, so the control-signal saving is the identity 1 − Nz/N, and the power figures follow from PP = PFPGA + NzPunit + small versus N·Punit + small for the fully controlled surface. The bottom-line Nz is not predicted but chosen: the threshold ψth is explicitly set to maximize the number of correlated columns (Fig. 6), so the reported percentages are the value of the fitted objective, and a smaller threshold (ψth = 15°) would give smaller, unreported savings. Additionally, Table II is inconsistent with the stated power model: for Deployment Case 1, the min-gain row (43.815 W) lies below the unit-cell power plus FPGA power (48.735 + 4.8 = 53.535 W) for the stated 57×57 surface, so the specific table-driven numbers are asserted rather than derived (a consistent recomputation would still give roughly 92% savings versus the 3dB-RIS). Self-citation is negligible and not load-bearing: the authors' own [7] appears only as contextual prior work, and no uniqueness theorem is imported, so the self-citation-related patterns do not apply. Verdict: partial circularity — the quantitative savings are forced by the architecture definition and the fitted threshold, while the performance assessment is independent. Score 5.
Assumptions & free parameters
free parameters (2)
- Correlation threshold ψth =
30-31 degrees (Case 1), 24-29 degrees (Case 2), 28-31 degrees (Case 3), depending on gain margin
- Gain margin ΔG^dB =
3 dB or 6 dB
assumptions (5)
- domain assumption The optimal phase shift of each RIS element is the negative sum of the BS-RIS and RIS-UE channel phases (Eq. 14).
- domain assumption Fair coverage is defined as the RIS-assisted path providing received power at least equal to the direct BS-UE path (Eq. 9).
- ad hoc to paper Elements with phase-difference below threshold ψth across all steering angles can share one control signal (Section IV-A).
- ad hoc to paper Power model: P_circuit = ceil(N_c/(N_z*N_s)) P_drive for Connected-RIS and P_circuit = ceil(N_c/(N*N_s)) P_drive for fully controlled (Eqs. 16-17), with N_units = N_z for Connected-RIS.
- domain assumption The elevation angle θUE is fixed (and implicitly small/zero), so the vertical phase gradient across the RIS is constant and columns become correlated.
Cite this review
Pith. "Pith review of A Correlation-Based Design of RIS for Reduced Power Consumption and Simplified Control Circuitry." pith.science (2026). https://pith.science/paper/OFIYQN5T
@misc{pith2026250622702,
  author       = {Pith},
  title        = {Pith review of: A Correlation-Based Design of RIS for Reduced Power Consumption and Simplified Control Circuitry},
  year         = {2026},
  howpublished = {\url{https://pith.science/paper/OFIYQN5T}},
  note         = {Machine review of arXiv:2506.22702}
}
abstract
Aiming at simplifying the hardware structure and reducing the energy consumption in wireless communication via reconfigurable intelligent surfaces (RIS), this paper introduces a novel RIS design founded on the correlation between the phase shift values of the surface elements. First, a correlation analysis is conducted, considering the azimuth angle of a target device within a coverage region spanning from $-80^{\circ}$ to $80^{\circ}$. The correlation is demonstrated for different deployment cases, creating the basis for the new RIS structure, termed Connected-RIS, where correlated elements are designed to share the same control signal. The fundamental performance of the proposed design is then analyzed in terms of control signals, power consumption, and communication system performance, comparing it to two RIS structures with full control: one with the same size as the proposed design, and the other employing the minimum number of elements necessary to satisfy the fair coverage criterion. The correlation-based RIS design enables three-dimensional passive beamforming and significantly reduces the number of required load impedances and control signals, thereby lowering the hardware cost and simplifying the control circuitry. It also achieves substantial power savings as compared to the baseline schemes, while maintaining sufficient gain for a fair radio coverage. For instance, numerical simulations demonstrate that the proposed design reduces the power consumption by almost 86-92\% and the control signals by 83-98\% compared to operation with fully controlled RIS.
Figures


Figures from the paper (11 more)




Reference graph
Works this paper leans on
-
[9]
Power consumption analysis of a reconfigurable intelligent surface for self-sustained operations,
A. Rafique, A. Mehmood, N. Hassan, M. Mehmood, and M. Zubair, “Power consumption analysis of a reconfigurable intelligent surface for self-sustained operations,” in Proc. IEEE Veh. Techno. Conf. (VTC2024- Spring), June 2024, pp. 1–5
work page 2024
-
[20]
Static power consumption modeling and measurement of reconfigurable intelligent surfaces,
J. Wang et al., “Static power consumption modeling and measurement of reconfigurable intelligent surfaces,” in Proc. Eu. Sig. Proc. Conf. (EUSIPCO). IEEE, Mar. 2023, pp. 890–894
work page 2023
-
[21]
Reconfigurable intelligent surface: Power consumption modeling and practical measurement validation,
——, “Reconfigurable intelligent surface: Power consumption modeling and practical measurement validation,” IEEE Trans. Commun. , vol. 72, no. 9, pp. 5720–5734, Sep. 2024
work page 2024
-
[1]
5G-advanced toward 6G: Past, present, and future,
W. Chen et al. , “5G-advanced toward 6G: Past, present, and future,” IEEE J. Sel. Areas Commun. , vol. 41, no. 6, pp. 1592–1619, June 2023
work page 2023
-
[2]
Design and Prototyping of Transmissive RIS-Aided Wireless Communication
J. Zhang, R. Xiong, J. Liu, T. Mi, and R. Qiu, “Design and prototyping of transmissive RIS-aided wireless communication,” arXiv preprint arXiv:2402.05570, Feb. 2024
work page Pith review arXiv 2024
-
[3]
6G wireless communications networks: A compre- hensive survey,
M. Alsabah et al., “6G wireless communications networks: A compre- hensive survey,” IEEE Access, vol. 9, pp. 148 191–148 243, Nov. 2021
work page 2021
-
[4]
Towards smart and reconfigurable environment: Intelligent reflecting surface aided wireless network,
Q. Wu and R. Zhang, “Towards smart and reconfigurable environment: Intelligent reflecting surface aided wireless network,” IEEE Commun. Mag., vol. 58, no. 1, pp. 106–112, Jan. 2020
2020
-
[5]
X. Pei et al., “RIS-aided wireless communications: Prototyping, adaptive beamforming, and indoor/outdoor field trials,” IEEE Trans. Commun. , vol. 69, no. 12, pp. 8627–8640, Dec. 2021
work page 2021
Show all 22 references
-
[6]
Reconfigurable intelligent surface as- sisted multiuser MISO systems exploiting deep reinforcement learning,
C. Huang, R. Mo, and C. Yuen, “Reconfigurable intelligent surface as- sisted multiuser MISO systems exploiting deep reinforcement learning,” IEEE J. Sel. Areas Commun. , vol. 38, no. 8, pp. 1839–1850, 2020
2020
-
[7]
Leveraging UA Vs with intelligent reflecting surfaces for energy-efficient communications with cell-edge users,
Z. Mohamed and S. A ¨ıssa, “Leveraging UA Vs with intelligent reflecting surfaces for energy-efficient communications with cell-edge users,” in Proc. IEEE Int. Conf. Commun. (ICC) , June 2020, pp. 1–6
2020
-
[8]
A reconfigurable intelligent surface at mmwave based on a binary phase tunable metasurface,
J. Gros et al. , “A reconfigurable intelligent surface at mmwave based on a binary phase tunable metasurface,” IEEE Open J. Commun. Soc. , vol. 2, pp. 1055–1064, May 2021
2021
-
[10]
Enhancing energy efficiency for reconfigurable intelligent surfaces with practical power models,
Z. Li et al., “Enhancing energy efficiency for reconfigurable intelligent surfaces with practical power models,” 2023. [Online]. Available: https://arxiv.org/abs/2310.15901
2023 arXiv
-
[11]
Reconfigurable intelligent surface-based wireless commu- nications: Antenna design, prototyping, and experimental results,
L. Dai et al., “Reconfigurable intelligent surface-based wireless commu- nications: Antenna design, prototyping, and experimental results,” IEEE Access, vol. 8, pp. 45 913–45 923, Mar. 2020
2020
-
[12]
On the impact of control signaling in RIS-empowered wireless communications,
F. Saggese et al., “On the impact of control signaling in RIS-empowered wireless communications,” IEEE Open J. Commun. Soc. , vol. 5, pp. 4383–4399, July 2024
2024
-
[13]
Reconfigurable intelligent surfaces: Interplay of unit cell and surface-level design and performance under quantifiable benchmarks,
A. Rafique et al. , “Reconfigurable intelligent surfaces: Interplay of unit cell and surface-level design and performance under quantifiable benchmarks,” IEEE Open J. Commun. Soc. , vol. 4, pp. 1583–1599, July 2023
2023
-
[14]
Active reconfigurable intelligent surface: Fully-connected or sub-connected?
K. Liu, Z. Zhang, L. Dai, S. Xu, and F. Yang, “Active reconfigurable intelligent surface: Fully-connected or sub-connected?” IEEE Commun. Letts., vol. 26, no. 1, pp. 167–171, Jan. 2022
2022
-
[15]
5G: system architecture for the 5G system (3GPP TS 23.501 version 15.3.0 release 15),
3GPP, “5G: system architecture for the 5G system (3GPP TS 23.501 version 15.3.0 release 15),” 3GPP, Tech. Rep. ETSI TS 123 501 V15.3.0 (2018-09), 2018
2018
-
[16]
5G: study on channel model for frequencies from 0.5 to 100 GHz (3GPP TR 38.901 version 14.3.0 release 14),
——, “5G: study on channel model for frequencies from 0.5 to 100 GHz (3GPP TR 38.901 version 14.3.0 release 14),” 3GPP, Tech. Rep. ETSI TR 138 901 V14.3.0 (2018-01), 2018
2018
-
[17]
Wave-front transformation with gradient metasurfaces,
N. Estakhri and A. Al `u, “Wave-front transformation with gradient metasurfaces,” Phys. Rev. X , vol. 6, p. 041008, Oct. 2016. [Online]. Available: https://link.aps.org/doi/10.1103/PhysRevX.6.041008
2016 doi
-
[18]
RIS-assisted high-speed communications with time- varying distance-dependent rician channels,
K. Wang et al. , “RIS-assisted high-speed communications with time- varying distance-dependent rician channels,” Applied Sciences, vol. 12, no. 22, 2022. [Online]. Available: https://www.mdpi.com/2076-3417/ 12/22/11857
2022
-
[19]
Wireless communications through reconfigurable intel- ligent surfaces,
E. Basar et al., “Wireless communications through reconfigurable intel- ligent surfaces,” IEEE Access, vol. 7, 2019
2019
-
[22]
RIS energy efficiency optimization with practical power models,
Z. Li et al. , “RIS energy efficiency optimization with practical power models,” in Proc. Int. Wireless Commun. Mobile Comput. (IWCMC) , June 2023, pp. 1172–1177
2023
Reviewed August 6, 2026 · model on record in the stance chip above.
Discussion (0). Continue with ORCID to comment.