REVIEW 6 minor 14 references
Phone physics and the Gateway Arch: Fun with friends and physics at the AAPT Winter Meeting in St. Louis
T0 review · 0 major / 6 minor · reviewed 2026-08-06 · deepseek-v4-flash
Pith's one-line read Phone barometer data give a better height estimate for the Gateway Arch tram ride than double-integrated accelerometer data, matching the known 192-meter height within a few meters.
desk verdict A modest but honest classroom-resource paper whose central barometer-vs-accelerometer comparison holds up, and the supplied dataset is the real value. read the letter →
The pith
A machine-rendered reading of the paper's core claim, the machinery that carries it, and where it could break.
The reading
What carries the argument
The central objects are two complementary sensor pipelines. The barometer pipeline converts pressure to height using the hydrostatic relation $\Delta P = \rho g \Delta h$, or PhyPhox's barometric formula, giving a direct vertical displacement. The accelerometer pipeline uses Euler's method to integrate Z-axis acceleration twice, subtracting an offset tuned so that the round trip returns to its starting height; a variant splits the ride at the midpoint rest and resets velocity there, following the practice recommended in the speed-estimation literature. The comparison of these two pipelines on the same ride is what carries the claim that pressure wins.
What would settle it
Repeat the Gateway Arch tram ride with a phone that also logs gyroscope orientation; if the gyroscope-corrected double integration gives a peak height within a few meters of 192 meters, or beats the barometer's 198 meters, the claim that the barometer is the stronger representation for this ride would fail. Alternatively, a pressure-sensor ride on an elevator of known height that produced a height error larger than the accelerometer's would also undercut it.
Extended reading notes
Core claim
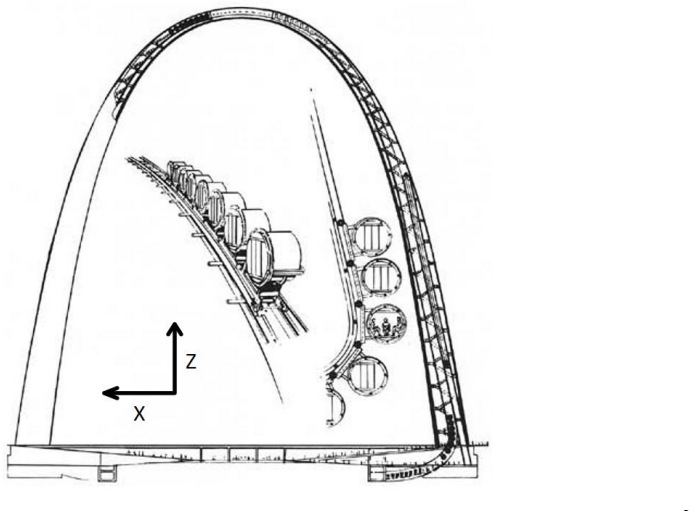
On the paper's own terms, the central discovery is comparative: a phone's pressure sensor is a more reliable vertical ruler than its accelerometer for a ride that is slow and whose orientation changes. Pressure-derived altitude peaks at roughly 198 meters versus the Gateway Arch's known height of 192 meters, while two numerical integrations of the Z-acceleration produce 262 meters, or 251 meters when the data are split at the rest stop and each segment receives its own accelerometer offset. The paper also explains why: the tram rides like a Ferris wheel, tilting the phone relative to Earth's vertical, so even one-degree orientation changes can corrupt the acceleration signal, and integration compounds the error quadratically in time. The barometer path also preserves qualitative details the accelerometer misses, such as the tram gently slowing to a stop on the descent.
Load-bearing premise
The argument relies on the accelerometer branch being a fair but imperfect method: if the phone's Z-axis does not stay close enough to Earth's vertical during the ride, then the accelerometer heights are measuring something other than vertical displacement and the comparison with the barometer is fixed in advance.
Editorial extensions
If this is right
- A classroom can use the supplied dataset to see that pressure-based height tracks the known 192-meter Arch height while double integration overshoots by about 36 percent.
- For short phone-accelerometer experiments, drift is tolerable: the paper notes that the 60-meter overshoot over 450 seconds would be about 3 centimeters in a 10-second experiment.
- Qualitative motion features survive integration: the mid-ride slowdown appears in both methods, so accelerometer data still support discussions of velocity and acceleration.
- The split-and-reset method improves the accelerometer estimate from 262 meters to 251 meters, showing that using known rest positions is a cheap fix for integration drift.
- Horizontal motion is less reliable: the X-displacement is roughly plausible at about 90 meters across the leg-to-center distance, while the Y-displacement is meaningless, warning students about integrating noise-dominated signals.
Reading between the lines
- A natural follow-up is to record gyroscope data alongside pressure and acceleration and rotate the measured acceleration into Earth's frame before integrating; the paper's one-degree-tilt estimate suggests this could eliminate much of the 60-meter overshoot.
- The comparison should transfer to elevators, stair climbs, or drone ascents: pressure should remain the better height estimate whenever the device's orientation drifts by more than a degree during the motion.
- The roughly 90-meter horizontal excursion from the accelerometer nearly reproduces the Arch's leg-to-center distance of 96 meters, so even imperfect horizontal data may be usable as an order-of-magnitude exercise.
- Because air density is the main environmental parameter in the pressure method, temperature-logged repeat runs could turn the 198-meter versus 192-meter difference into a lesson about uncertainty and assumptions.
Editorial analysis
A structured set of objections, weighed in public.
Referee Report
Summary. The paper reports a smartphone-based measurement of the vertical motion of the Gateway Arch tram during a round trip to the observation deck. Using the PhyPhox app on a Samsung Galaxy S23, the authors collected simultaneous barometer and accelerometer data. They analyze the data with four methods: (1) pressure change with constant air density, (2) PhyPhox's built-in barometric formula, (3) double numerical integration of the Z-axis accelerometer with a single fitted offset, and (4) double integration with separate offsets for the ascent and descent segments, including a velocity reset at a known stop. The barometric methods give a maximum vertical displacement of 198 m, the accelerometer methods give 262 m (Method 3) and 251 m (Method 4), while the known height of the Gateway Arch is 192 m and a pixel count of the tram path in Figure 1 yields about 203 m. The authors conclude that the barometer provides a more reliable height estimate than double-integrated acceleration, and they attribute the accelerometer errors to sensor offset drift, noise, and the tram's tilting orientation. Raw data, spreadsheets, and a teacher's guide are made available.
Significance. If the result holds, the paper offers a useful, low-cost classroom activity for comparing sensor types and for teaching the pitfalls of numerical integration. The central comparison is supported by the reported data: barometer-derived displacement is much closer to the known height of the Arch than either accelerometer integration approach. A particular strength is that the barometric measurement is independent of the fitted accelerometer offsets, so the main conclusion is not circular. The manuscript is transparent about limitations, including the tilt of the phone's Z-axis, the need to fit offsets, and the failure of the horizontal Y-axis channel. The authors also cite relevant prior work, including Monteiro and Martí and the recent offset-compensation method of Yu. The availability of raw data and a teacher's guide increases the paper's value for instructors.
minor comments (6)
- [Eq. (1), barometric pressure analysis] The sentence following Eq. (1), 'the value in the numerator of the ratio is a change in weight,' is confusing because the ratio has already been reduced to ΔP; please rewrite it to say that the numerator ρgAΔh is the weight of the air column of height Δh and that dividing by the area A gives the pressure change.
- [Method 3, discussion of offset error] The statement that the error grows quadratically with time is correct and useful, but it would be clearer to state explicitly that the 60 m overshoot corresponds to the fitted offset shift from 9.8234 to 9.8263 m/s², so readers can scale the effect to experiments of different duration.
- [Figures 5 and 6] The figures are captioned 'Z-direction Velocity & Height via Method 4,' but the text refers to 'the following two height plots'; please clarify in the captions which panel is velocity and which is height, or split them into separate figures with unambiguous captions.
- [Horizontal directions analysis] The phrase 'accelerator sensor offsets' appears to be a typo for 'accelerometer sensor offsets'; please correct it for consistency with the rest of the text.
- [Comparison of barometer height to arch height] The paper compares the barometric 198 m result to the pixel-counted 203±2 m path length from Figure 1 and calls the difference reasonable, but the pixel-counted value is a path length along the curved track, not a vertical displacement; the more direct comparison is to the 192 m arch height, which yields a 6 m difference, and the paper should clarify whether the tram's underground loading level explains part of that difference.
- [Data availability] The supplemental material is mentioned only through reference [1]; for a teaching-oriented paper, it would be helpful to include a direct URL or repository identifier in the main text so readers can easily locate the raw data and teacher's guide.
Circularity Check
No significant circularity: barometer and accelerometer comparisons are independent, with only a legitimate endpoint calibration.
full rationale
The paper's central comparative claim is that barometer-derived height (198 m via Method 1) matches the known Gateway Arch height better than double-integrated accelerometer height (262 m via Method 3, 251 m via Method 4). This is an empirical comparison between two independent sensor channels. The barometric height uses the pressure-altitude relation with an assumed air density and is not derived from the accelerometer data. The accelerometer analyses use a physically motivated calibration: the offset is varied until the round-trip displacement returns to its starting value, or the velocity is reset at a known rest point. These are boundary-condition calibrations, not fits to the quantity being compared; the maximum displacement remains an output of the integration. The paper also discloses key limitations (tilt, offset drift, air-density assumptions) that affect the accelerometer branch more than the barometer branch, which strengthens rather than undermines the comparison. No self-citation is load-bearing, and no known result is merely renamed. The only minor issue is that the pixel-counted 203 m path length is not the same geometric quantity as vertical height, but this does not make the derivation circular and does not affect the relative ranking of methods.
Assumptions & free parameters
free parameters (3)
- Acceleration offset (ascent, single trip) =
9.8263 m/s^2
- Acceleration offset (ascent, split) =
9.826 m/s^2
- Acceleration offset (descent, split) =
9.812 m/s^2
assumptions (6)
- standard math Euler integration with fixed time steps yields position from acceleration
- domain assumption Barometric formula relating pressure to altitude as implemented in PhyPhox
- domain assumption Air density is 1.225 kg/m^3
- domain assumption The phone is at rest when data collection is restarted on the descent
- domain assumption The tram's path is a weighted catenary
- domain assumption The phone's Z-axis is approximately aligned with the Earth's vertical throughout the ride
Cite this review
Pith. "Pith review of Phone physics and the Gateway Arch: Fun with friends and physics at the AAPT Winter Meeting in St. Louis." pith.science (2026). https://pith.science/paper/56UUQQ3N
@misc{pith2026250622746,
  author       = {Pith},
  title        = {Pith review of: Phone physics and the Gateway Arch: Fun with friends and physics at the AAPT Winter Meeting in St. Louis},
  year         = {2026},
  howpublished = {\url{https://pith.science/paper/56UUQQ3N}},
  note         = {Machine review of arXiv:2506.22746}
}
read the original abstract
As a famous landmark and feat of engineering, the Gateway Arch was a popular destination at the 2025 AAPT Winter Meeting in St. Louis. The visit to the observation deck of the Gateway Arch is unique, climbing the steps after exiting the small tram capsules and seeing a floor that continues to slope upward assures that you are in fact at the very top. Everyone in our group excitedly took pictures, pointing out local features like the Dred Scott Courthouse. There were many selfies at the pinnacle, and we discussed how to work them into future questions for our students. During our tram ride to the top observation deck of the arch, we lamented that we should have brought pendula to measure the acceleration due to gravity. You can take physics teachers out of the physics conference, but you apparently can't get us to stop talking about physics teaching. Recognizing that we had accelerometers on our phones we collected data on the descent. The authors wanted to collect more complete measurements and returned two days later to repeat the journey, the results of which we present here. For readers wishing to repeat with their students, or who want to apply more advanced data analysis techniques, the authors have made the raw data, our spreadsheets, and a teacher's guide available.
Figures


Figures from the paper (1 more)

Reference graph
Works this paper leans on
-
[1]
Readers can access the Appendix as supplemental material
-
[2]
Gateway Arch - Tram System, https://www.nps.gov/jeff/planyourvisit/tram-system.htm
-
[3]
https://www.nps.gov/parkhistory/online_books/jeff/adhi2-4b.htm
Bob Moore, Urban Innovation and Practical Partnerships: An Administrative History of Jefferson National Expansion Memorial, 1980-1991, 1994. https://www.nps.gov/parkhistory/online_books/jeff/adhi2-4b.htm
work page 1980
-
[4]
Rhyner, Studying the motion of an elevator, Phys
Charles R. Rhyner, Studying the motion of an elevator, Phys. Teach. 36, 111–113 (1998) https://doi.org/10.1119/1.880007
-
[5]
Kinser; Relating Time-Dependent Acceleration and Height Using an Elevator
Jason M. Kinser; Relating Time-Dependent Acceleration and Height Using an Elevator. Phys. Teach. 1 April 2015; 53 (4): 220–221. https://doi.org/10.1119/1.4914561
-
[6]
M. Monteiro and A. Martí, “Using smartphone pressure sensors to measure vertical velocities of elevators, stairways, and drones,” Phys. Educ. 52, 15010 (2016).https://doi.org/10.1088/1361-6552/52/1/015010
-
[7]
Littleton, Richard Secco; Smartphones and Gravitational Acceleration II: Applications
Meryem Berrada, Joshua A.H. Littleton, Richard Secco; Smartphones and Gravitational Acceleration II: Applications. Phys. Teach. 1 October 2020; 58 (7): 473–476. https://doi.org/10.1119/10.0002064
-
[9]
Compensating smartphone accelerometers for more precise classroom experiments
Hoon Yu, “Compensating smartphone accelerometers for more precise classroom experiments.” Phys. Teach., 63, 189-192. (2025) https://doi.org/10.1119/5.0202891
Show all 14 references
-
[10]
https://github.com/phyphox/phyphox-experiments/blob/master/elevator.phyphox
-
[11]
A Quick Derivation relating altitude to air pressure,
Portland State Aerospace Society, “A Quick Derivation relating altitude to air pressure,” https://archive.psas.pdx.edu/RocketScience/PressureAltitude_Derived.pdf
-
[12]
https://www.engineeringtoolbox.com/air-density-specific-weight-d_600.html
-
[13]
https://phyphox.org/wiki/index.php/Integrated_acceleration
-
[14]
Ustun, I., & Cetin, M. (2019). Speed Estimation using Smartphone Accelerometer Data. Transportation Research Record, 2673(3), 65-73. https://doi.org/10.1177/0361198119836977
2019 doi
-
[15]
Mathematics of the gateway arch
Osserman, Robert. "Mathematics of the gateway arch." Notices of the AMS 57.2 (2010): 220-229. https://www.ams.org/journals/notices/201002/rtx100200220p.pdf
2010
Reviewed August 6, 2026 · model on record in the stance chip above.
Discussion (0). Continue with ORCID to comment.