Localized kernel method for separation of linear chirps
Pith reviewed 2026-05-19 07:03 UTC · model grok-4.3
The pith
A localized kernel modification to the signal separation operator extracts linear chirps despite crossings, low SNR, and discontinuities.
A machine-rendered reading of the paper's core claim, the machinery that carries it, and where it could break.
Core claim
The authors amplify and modify the Signal Separation Operator using localized kernels. This allows separation of linear chirp signals even when their instantaneous frequencies cross, when SNR is very low, and when the signals contain discontinuities. They analyze the noisy case to relate minimal separation, minimal amplitude, SNR, and sampling frequency. Results are reported on a simulated dataset of seven signals.
What carries the argument
Localized kernel modification of the Signal Separation Operator, which restricts the separation calculation to local time windows to manage crossings and noise.
If this is right
- Crossing points between chirps no longer require separate detection or special treatment.
- Separation remains feasible at SNR levels lower than those tolerated by the unmodified operator.
- Discontinuous signals can be processed by treating slow-variation segments separately.
- The derived bounds give explicit guidance for choosing sampling frequency given expected noise and separation.
Where Pith is reading between the lines
- The same localization idea could be tried on real radar or audio recordings that contain crossing trajectories.
- The noise bounds might supply error estimates for other time-frequency decomposition techniques.
- Adaptive sampling strategies could use the separation-SNR relation to decide how densely to sample a signal.
- Testing on nonlinear chirps would reveal whether the localization step generalizes beyond the linear case.
Load-bearing premise
The instantaneous frequencies and amplitudes of the component signals change continuously and slowly over time.
What would settle it
A numerical test with two linear chirps that cross at an SNR below the derived bound, where the recovered frequencies and amplitudes show large errors, would show the claimed robustness does not hold.
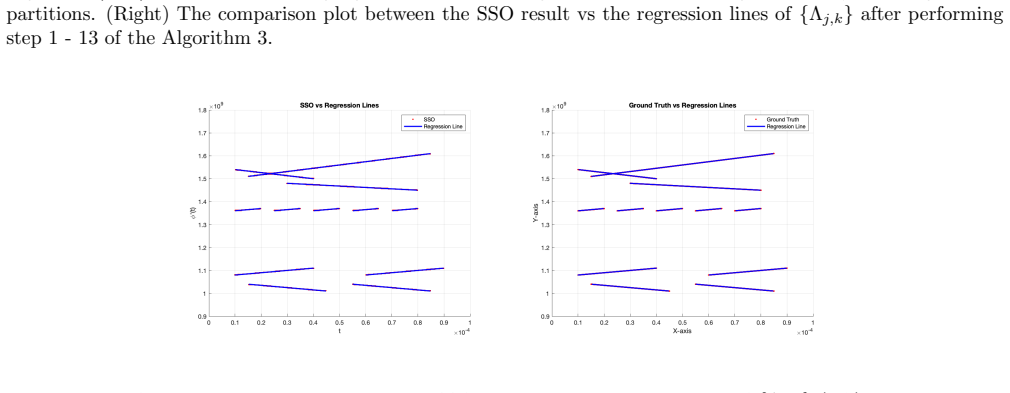
Figures


read the original abstract
The task of separating a superposition of signals into its individual components is a common challenge encountered in various signal processing applications, especially in domains such as audio and radar signals. A previous paper by Chui and Mhaskar proposes a method called Signal Separation Operator (SSO) to find the instantaneous frequencies and amplitudes of such superpositions where both of these change continuously and slowly over time. In this paper, we amplify and modify this method in order to separate chirp signals in the presence of crossovers, a very low SNR, and discontinuities. We give a theoretical analysis of the behavior of SSO in the presence of noise to examine the relationship between the minimal separation, minimal amplitude, SNR, and sampling frequency. Our method is illustrated with a few examples, and numerical results are reported on a simulated dataset comprising 7 simulated signals.
Editorial analysis
A structured set of objections, weighed in public.
Referee Report
Summary. The manuscript extends the Signal Separation Operator (SSO) of Chui and Mhaskar to separate superpositions of linear chirps that may exhibit crossing instantaneous frequencies, discontinuous amplitudes, and very low SNR. It supplies a theoretical noise analysis for the base SSO that relates minimal separation, minimal amplitude, SNR, and sampling frequency, and reports numerical results on a simulated dataset of 7 signals together with illustrative examples.
Significance. If the modifications to SSO can be shown to remain stable when the slow-variation assumption is violated, the work would strengthen practical signal-separation tools for radar and audio applications. The numerical experiments on simulated data offer empirical evidence, yet the absence of error bounds or stability results for the modified operator under crossovers and discontinuities limits the theoretical contribution.
major comments (2)
- [theoretical noise analysis section] The theoretical noise analysis (described in the section on behavior of SSO in the presence of noise) derives bounds under the assumption that instantaneous frequencies and amplitudes vary continuously and slowly. The central claim, however, requires the amplified and modified SSO to succeed precisely when this assumption is violated by crossovers and amplitude discontinuities; no new bounds or stability statements are supplied for the modified operator in those regimes.
- [numerical results section] The numerical results on the 7 simulated signals demonstrate performance, but the manuscript does not report quantitative error metrics (e.g., separation error or frequency estimation RMSE) specifically at crossover points or at the claimed very-low-SNR levels, making it difficult to verify that the modifications achieve the stated improvements over the base SSO.
minor comments (1)
- [introduction/methods] Notation for the modified kernel or localization parameters could be introduced more explicitly when first describing the amplification of the original SSO.
Simulated Author's Rebuttal
We appreciate the referee's careful reading of the manuscript and constructive comments. We address each major comment point by point below, indicating revisions where appropriate.
read point-by-point responses
-
Referee: [theoretical noise analysis section] The theoretical noise analysis (described in the section on behavior of SSO in the presence of noise) derives bounds under the assumption that instantaneous frequencies and amplitudes vary continuously and slowly. The central claim, however, requires the amplified and modified SSO to succeed precisely when this assumption is violated by crossovers and amplitude discontinuities; no new bounds or stability statements are supplied for the modified operator in those regimes.
Authors: We agree that the provided noise analysis applies to the base SSO under the continuous slow-variation assumption and relates minimal separation, amplitude, SNR, and sampling frequency as described. The modifications to the SSO are introduced precisely to extend applicability to crossovers and discontinuities, which violate that assumption. We do not supply new theoretical bounds for the modified operator in these regimes, as a rigorous stability analysis at such singular points would require an entirely separate theoretical development. The manuscript instead supports the practical utility of the modifications through numerical evidence on simulated signals. In revision we will add an explicit statement clarifying the scope of the theoretical analysis and noting that performance under violations is demonstrated empirically. revision: partial
-
Referee: [numerical results section] The numerical results on the 7 simulated signals demonstrate performance, but the manuscript does not report quantitative error metrics (e.g., separation error or frequency estimation RMSE) specifically at crossover points or at the claimed very-low-SNR levels, making it difficult to verify that the modifications achieve the stated improvements over the base SSO.
Authors: We accept the point that quantitative metrics would allow clearer verification. The current numerical section reports results on seven simulated signals that include crossovers, discontinuities, and low-SNR cases, but presents them primarily through illustrative examples rather than tabulated error measures at those specific locations. In the revised manuscript we will add quantitative tables reporting separation error and frequency-estimation RMSE at crossover points and across the tested low-SNR levels, together with direct comparisons against the base SSO. revision: yes
- Deriving new theoretical bounds or stability statements for the modified operator under crossovers and amplitude discontinuities
Circularity Check
Moderate circularity via self-citation load-bearing on unmodified SSO analysis
specific steps
-
self citation load bearing
[Abstract]
"A previous paper by Chui and Mhaskar proposes a method called Signal Separation Operator (SSO) to find the instantaneous frequencies and amplitudes of such superpositions where both of these change continuously and slowly over time. In this paper, we amplify and modify this method in order to separate chirp signals in the presence of crossovers, a very low SNR, and discontinuities. We give a theoretical analysis of the behavior of SSO in the presence of noise to examine the relationship between the minimal separation, minimal amplitude, SNR, and sampling frequency."
The load-bearing theoretical analysis is explicitly for the original SSO under its continuous-slow-variation premise, yet the paper's strongest claim is that the amplified/modified version succeeds precisely when that premise is violated (crossovers, discontinuities). With overlapping authorship, the extension of the base bounds to the modified operator is not shown by new equations but rests on the prior self-cited result.
full rationale
The paper's central contribution is an amplification and modification of the prior SSO operator to handle crossovers, discontinuities, and very low SNR for linear chirps. However, the provided theoretical noise analysis derives bounds only for the base SSO under its original slow-continuous-variation assumptions (as stated in the abstract). Because one author (Mhaskar) overlaps with the cited prior work, the justification for applying those bounds to the modified operator reduces to a self-citation whose validity for the new regimes is not independently re-derived. This creates moderate load-bearing dependence without violating the 'no speculation' rule, as the abstract itself flags the modifications while the analysis section remains tied to the base case.
Axiom & Free-Parameter Ledger
axioms (1)
- domain assumption Instantaneous frequencies and amplitudes change continuously and slowly over time
Reference graph
Works this paper leans on
-
[1]
St´ ephane Boucheron, G´ abor Lugosi, and Pascal Massart.Concentration inequalities: A nonasymptotic theory of independence. Oxford university press, 2013
work page 2013
-
[2]
Radar signal separation and recognition based on semantic segmentation
Hou Changbo, Hua Lijie, Liu Guowei, and Lin Yun. Radar signal separation and recognition based on semantic segmentation. In 2020 7th International Conference on Dependable Systems and Their Applications (DSA) , pages 385–390, 2020
work page 2020
-
[3]
A radar signal deinterleaving method based on semantic segmentation with neural network
Wang Chao, Sun Liting, Liu Zhangmeng, and Huang Zhitao. A radar signal deinterleaving method based on semantic segmentation with neural network. IEEE Transactions on Signal Processing , 70:5806–5821, 2022
work page 2022
-
[4]
Charles K Chui and H. N. Mhaskar. Signal decomposition and analysis via extraction of frequencies. Applied and Computational Harmonic Analysis , 40(1):97–136, 2016
work page 2016
-
[5]
I. Daubechies, J. Lu, and H. T. Wu. Synchrosqueezed wavelet transforms: an empirical mode decomposition-like tool. Applied and computational harmonic analysis , 30(2):243–261, 2011
work page 2011
-
[6]
I. Daubechies and S. Maes. A nonlinear squeezing of the continuous wavelet transform based on auditory nerve models. Wavelets in medicine and biology , pages 527–546, 1996. 21
work page 1996
-
[7]
Baron Gaspard Riche De Prony. Essai ´ experimental et analytique: sur les lois de la dilatabilit´ e de fluides ´ elastique et sur celles de la force expansive de la vapeur de l’alkool,a diff´ erentes temp´ eratures. Journal de l’´ ecole polytechnique, 1(22):24–76, 1795
-
[8]
Rashi Dutt, Anuradha Baloria, Ram Chandra Prasad V., Radhakrishna ESMP, and Amit Acharyya. Discrete wavelet transform based unsupervised underdetermined blind source separation methodology for radar pulse deinterleaving using antenna scan pattern. IET Radar, Sonar and Navigation , 13(8):1350–1358, 2019
work page 2019
-
[9]
A density-based algorithm for discovering clusters in large spatial databases with noise
Martin Ester, Hans-Peter Kriegel, J¨ org Sander, Xiaowei Xu, et al. A density-based algorithm for discovering clusters in large spatial databases with noise. In kdd, volume 96, pages 226–231, 1996
work page 1996
- [10]
-
[11]
A robust machine learning approach for signal separation and classification
Simone Filice, Danilo Croce, and Roberto Basili. A robust machine learning approach for signal separation and classification. In Jo˜ ao M. Sanches, Luisa Mic´ o, and Jaime S. Cardoso, editors, Pattern Recognition and Image Analysis, pages 749–757, Berlin, Heidelberg, 2013. Springer Berlin Heidelberg
work page 2013
-
[12]
Licursi de Mello and Fernando Rangel de Sousa
Rafael G. Licursi de Mello and Fernando Rangel de Sousa. Precise techniques to detect superimposed radar pulses on esm systems. IET Radar, Sonar and Navigation , 12(7):735–741, 2018
work page 2018
-
[13]
D. Gabor. Theory of communication. part 1: The analysis of information. Journal of the Institution of Electrical Engineers-Part III: Radio and Communication Engineering , 93(26):429–441, 1946
work page 1946
-
[14]
Radar emitter sorting and recognition based on time-frequency image union feature
Wang Gongming, Chen Shiwen, Hu Xueruobai, and Yuan Junjian. Radar emitter sorting and recognition based on time-frequency image union feature. In 2019 IEEE 4th International Conference on Signal and Image Processing (ICSIP), pages 165–170, 2019
work page 2019
-
[15]
N. E. Huang, Z. Shen, S. R. Long, M. C. Wu, H. H. Shih, Q. Zheng, N.C. Yen, C. C. Tung, and H. H. Liu. The empirical mode decomposition and the Hilbert spectrum for nonlinear and non-stationary time series analysis. Proceedings of the Royal Society of London. Series A: Mathematical, Physical and Engineering Sciences, 454(1971):903–995, 1998
work page 1971
-
[16]
Pulse-compression radar signal sorting using the blind source separation algrithms
Li Jiang, Lin Li, and Guo qing Zhao. Pulse-compression radar signal sorting using the blind source separation algrithms. In 2015 International Conference on Estimation, Detection and Information Fusion (ICEDIF) , pages 268–271, 2015
work page 2015
-
[17]
Underdetermined blind source separation of radar signals based on genetic annealing algorithm
Hongbin Jin, Weilin Luo, Hao Li, and Lingyan Dai. Underdetermined blind source separation of radar signals based on genetic annealing algorithm. The Journal of Engineering , 2022(3):261–273, 2022
work page 2022
-
[18]
Shashank S. Joshil, Cuong M. Nguyen, V. Chandrasekar, J. Christine Chiu, and Yann Blanchard. Separat- ing cloud and drizzle signals in radar doppler spectra using a parametric time domain method. Journal of Atmospheric and Oceanic Technology, 37(9):1669 – 1680, 2020
work page 2020
-
[19]
Radar pulse on pulse identification parallel fft and power envelope algorithm
Jordan Juliano, Jaron Lin, Alex Erdogan, and Kiran George. Radar pulse on pulse identification parallel fft and power envelope algorithm. In 2020 11th IEEE Annual Ubiquitous Computing, Electronics and Mobile Communication Conference (UEMCON), pages 0609–0613, 2020
work page 2020
-
[20]
Janne Lehtom¨ aki.Analysis of energy based signal detection . University of Oulu, 2005
work page 2005
-
[21]
Lin Li, Ningning Han, Qingtang Jiang, and Charles K Chui. A chirplet transform-based mode retrieval method for multicomponent signals with crossover instantaneous frequencies. Digital Signal Processing , 120:103262, 2022
work page 2022
-
[22]
Pulse separation using independent component analysis
Jaron Lin, Jordan Juliano, Alex Erdogan, and Kiran George. Pulse separation using independent component analysis. In 2020 11th IEEE Annual Ubiquitous Computing, Electronics and Mobile Communication Conference (UEMCON), pages 0946–0950, 2020
work page 2020
-
[23]
Improved method for deinterleaving radar signals and estimating pri values
Yanchao Liu and Qunying Zhang. Improved method for deinterleaving radar signals and estimating pri values. IET Radar, Sonar and Navigation , 12(5):506–514, 2018. 22
work page 2018
-
[24]
Lpi radar signal detection based on radial integra- tion of choi-williams time-frequency image
Yongjian Liu, Peng Xiao, Hongchao Wu, and Weihua Xiao. Lpi radar signal detection based on radial integra- tion of choi-williams time-frequency image. Journal of Systems Engineering and Electronics , 26(5):973–981, 2015
work page 2015
-
[25]
Audio source separation, volume 433
Shoji Makino. Audio source separation, volume 433. Springer, 2018
work page 2018
-
[26]
H. N. Mhaskar and J. Prestin. On local smoothness classes of periodic functions. Journal of Fourier Analysis and Applications, 11(3):353–373, 2005
work page 2005
-
[27]
Robust and tractable multidimensional exponential analysis
HN Mhaskar, S Kitimoon, and Raghu G Raj. Robust and tractable multidimensional exponential analysis. arXiv preprint arXiv:2404.11004 , 2024
-
[28]
Multichannel audio source separation with deep neural networks
Aditya Arie Nugraha, Antoine Liutkus, and Emmanuel Vincent. Multichannel audio source separation with deep neural networks. IEEE/ACM Transactions on Audio, Speech, and Language Processing, 24(9):1652–1664, 2016
work page 2016
-
[29]
Image seg- mentation for radar signal deinterleaving using deep learning
Mustafa Atahan Nuhoglu, Yasar Kemal Alp, Mehmet Ege Can Ulusoy, and Hakan Ali Cirpan. Image seg- mentation for radar signal deinterleaving using deep learning. IEEE Transactions on Aerospace and Electronic Systems, 59(1):541–554, 2023
work page 2023
-
[30]
A mle-based blind signal separation method for time–frequency overlapped signal using neural network
Lihui Pang, Yilong Tang, Qingyi Tan, Yulang Liu, and Bin Yang. A mle-based blind signal separation method for time–frequency overlapped signal using neural network. EURASIP Journal on Advances in Signal Process- ing, 2022(1):121, 2022
work page 2022
-
[31]
A blind source separation method: Nonlinear chirp component analysis
Xujun Peng, Zhiyu Shi, Pengfei Jin, Xiaoyan Zhang, Zheng Yang, and Xuelei Feng. A blind source separation method: Nonlinear chirp component analysis. Mechanical Systems and Signal Processing , 216:111491, 2024
work page 2024
-
[32]
Zhiyu Shao, Jiangheng He, and Shunshan Feng. Separation of multicomponent chirp signals using morphological component analysis and fractional fourier transform.IEEE Geoscience and Remote Sensing Letters, 17(8):1343– 1347, 2020
work page 2020
-
[33]
Jia Su, Mengru Xi, Yanyun Gong, Mingliang Tao, Yifei Fan, and Ling Wang. Time-varying wideband in- terference mitigation for sar via time-frequency-pulse joint decomposition algorithm. IEEE Transactions on Geoscience and Remote Sensing , 60:1–16, 2022
work page 2022
-
[34]
Time-chirp distribution for detection and estimation of lpi radar signals
Ewa Swiercz, Krzysztof Konopko, and Dariusz Janczak. Time-chirp distribution for detection and estimation of lpi radar signals. In 2020 21st International Radar Symposium (IRS) , pages 362–367, 2020
work page 2020
-
[35]
Gaurav Thakur, Eugene Brevdo, Neven S Fuckar, and Hau-Tieng Wu. The synchrosqueezing algorithm for time-varying spectral analysis: Robustness properties and new paleoclimate applications. Signal processing, 93(5):1079–1094, 2013
work page 2013
-
[36]
Power and waveform resource allocation method of lpi netted radar for target search and tracking
Longhao Xie, Wenxing Ren, Ziyang Cheng, Ming Li, and Huiyong Li. Power and waveform resource allocation method of lpi netted radar for target search and tracking. IET Radar, Sonar and Navigation , 19(1):e70022, 2025
work page 2025
-
[37]
Flowsep: Language-queried sound separation with rectified flow matching
Yi Yuan, Xubo Liu, Haohe Liu, Mark D Plumbley, and Wenwu Wang. Flowsep: Language-queried sound separation with rectified flow matching. In ICASSP 2025-2025 IEEE International Conference on Acoustics, Speech and Signal Processing (ICASSP), pages 1–5. IEEE, 2025
work page 2025
-
[38]
Parameterized model based blind intrinsic chirp source separation
Peng Zhou, Yang Yang, Shiqian Chen, Zhike Peng, Khandaker Noman, and Wenming Zhang. Parameterized model based blind intrinsic chirp source separation. Digital Signal Processing, 83:73–82, 2018. 23
work page 2018
discussion (0)
Sign in with ORCID, Apple, or X to comment. Anyone can read and Pith papers without signing in.