REVIEW 3 major objections 4 minor 1 cited by
Crowded Field Photometry with Rubin: Exploring 47 Tucanae with Data Preview 1
T0 review · 3 major / 4 minor · reviewed 2026-08-06 · deepseek-v4-flash
Pith's one-line read Forced photometry at difference-imaging positions pushes the recoverable radius in 47 Tucanae from roughly 28 pc to roughly 14 pc and identifies 14,744 candidate members.
desk verdict A useful, honest demonstration of Rubin DP1's crowded-field limits, but the 14 pc / 14,744 numbers need an external cross-match before they are quoted as more than a catalog exercise. read the letter →
The pith
A machine-rendered reading of the paper's core claim, the machinery that carries it, and where it could break.
The reading
What carries the argument
The central object is the diaForcedSource catalog: per-visit forced PSF photometry measured at the position of each DIAObject, that is, every source flagged by the difference-imaging pipeline. Because this catalog bypasses the coadd pipeline's detection and deblending stages, it recovers objects even where the coadd catalog is incomplete; taking the median across visits in each band, with error and scatter cuts below 0.25 mag, yields 116,963 objects whose positions are fixed by the differencing step.
What would settle it
Take a high-resolution space-telescope image of the inner 15 pc of 47 Tucanae and match each forced-photometry source to a uniquely resolved star; if a large fraction of the 14,744 candidates near the core has no unique stellar counterpart, then the roughly 14 pc recovery radius and the member count are contaminated by blended light.
Extended reading notes
Core claim
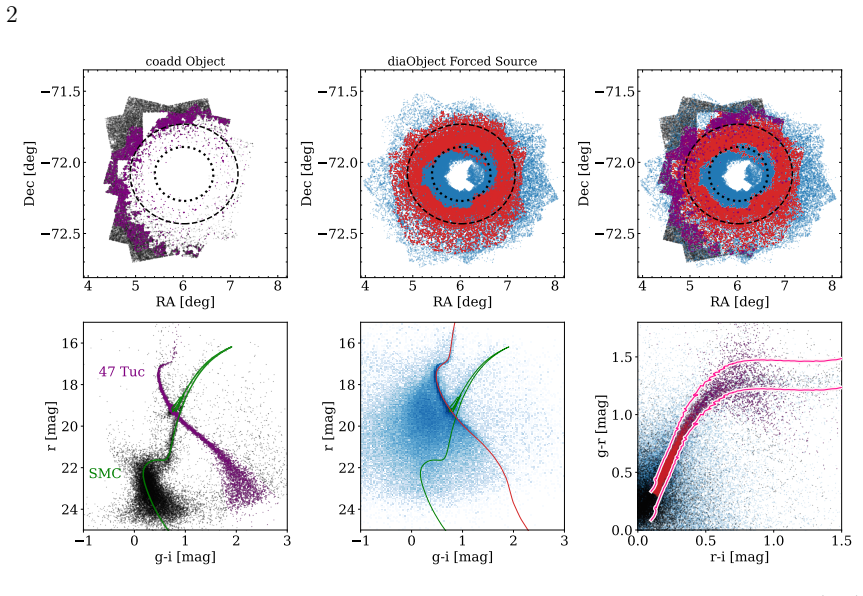
The central claim is that forced photometry at DIAObject positions recovers sources down to roughly 14 pc from the cluster center, nearly a factor of two deeper than the coadd-object catalog's roughly 28 pc limit, and yields 14,744 potential cluster members. The standard coadd pipeline fails inside about 28 pc due to the extreme source density; using forced PSF photometry at difference-image source positions bypasses the detection and deblending stages, producing a color-magnitude diagram with a well-sampled isochrone down to r about 21 mag and clearly visible giant and horizontal branches. The paper also shows that the coadd-object catalog produces a remarkably clean CMD and recovers 4,506 candidate cluster members, comparable to earlier work, establishing the baseline quality of the early data release.
Load-bearing premise
Everything hangs on the assumption that the photometry measured at difference-imaging positions in the crowded core is light from single stars, even though those pixels contain light from many blended, unresolved stars and the paper does not deblend them.
Editorial extensions
If this is right
- Forced photometry at difference-image positions can roughly double the spatial reach of ground-based photometry in crowded globular-cluster cores, reaching about 14 pc versus about 28 pc for standard coadd catalogs.
- With this method the recovered sample of candidate cluster members is 14,744, more than three times the 4,506 coadd objects.
- The resulting CMD resolves cluster sequences, including the main sequence to r about 21 mag and the giant and horizontal branches, even where individual-source photometry is systematically biased.
- The coadd-object catalog is already sufficient for clean, deep photometry in moderately crowded fields, showing that early data can produce science-grade color-magnitude diagrams.
- Algorithm choices, such as detection and deblending versus forced photometry, dominate completeness and reliability in dense stellar fields.
Reading between the lines
- If the forced-photometry candidates near the core are individually real rather than blends, the same forced-photometry approach could be used to map mass segregation and multiple stellar populations in 47 Tucanae and other clusters as more visits accumulate.
- The spurious blue plume near the core suggests a testable correction: cross-match each forced-photometry source against a high-resolution core catalog and flag sources without a unique stellar counterpart as blends instead of fitting them.
- The method's gain should scale with the number of visits; with more epochs, the median forced photometry should sharpen and the effective recovery radius may shrink further.
- Other crowding-limited problems, such as dense fields near the Galactic plane or resolved stellar populations in nearby galaxies, could benefit from the same differencing-first, forced-measurement-second workflow.
Editorial analysis
A structured set of objections, weighed in public.
Referee Report
Summary. This paper analyzes Rubin Observatory Data Preview 1 imaging of the globular cluster 47 Tucanae, comparing two pipeline products: the coadd-based object catalog and the diaForcedSource forced-photometry catalog. The coadd catalog yields clean color-magnitude diagrams and identifies 4506 candidate cluster members but shows a sharp loss of sources within roughly 28 pc of the cluster center due to crowding. Using forced photometry at positions identified by image differencing (DIAObjects), the authors report recovery of sources down to about 14 pc from the center and find 14744 potential members after the same CMD and color-color cuts. The paper acknowledges systematics in the forced photometry, including a spurious blue plume near the core, but still claims nearly a factor-of-two improvement in radial reach and more than a factor of three in member count.
Significance. If the central claims are validated, this paper provides an early, useful demonstration that Rubin's forced photometry at DIAObject positions can extend structural studies into crowded globular cluster cores, a regime where standard coadd pipelines fail. The work makes good use of public DP1 data and the LSDB analysis framework, and it is honest about the systematics in forced photometry. However, the headline numbers — the ~14 pc recovery radius and the 14744 member count — are not yet supported by an independent check against high-resolution imaging or a quantitative completeness/reliability analysis. As a result, the paper's main quantitative conclusions are conditional on an unverified assumption that each forced measurement traces a single, real star. With external validation and sensitivity analysis, this would become a valuable technical reference for Rubin crowded-field work; without those, the significance is limited to a plausibility demonstration.
major comments (3)
- [Section 3] The central claim that forced photometry recovers sources down to ~14 pc from the cluster center and yields 14744 members rests on treating each diaForcedSource measurement as photometry of an individual star. The paper explicitly states that the forced PSF measurements are not deblended and that bad subtractions can cause centroid offsets, and it shows a plume of spurious sources blue of (g-i)~0.6 that aligns with the core. Without an independent cross-match of the core detections against high-resolution imaging (e.g., HST/ACS or Gaia) or a radial completeness/reliability curve, the ~14 pc recovery radius and the 14744 member count are not established. A substantial fraction of the deepest detections could be blends or subtraction artifacts, which directly undermines the paper's headline result.
- [Sections 2 and 3] The candidate member counts (4506 and 14744) are derived from a hand-tuned isochrone region centered on a MIST isochrone with log10(age/yr)=10.3, [Fe/H]=-0.78, and m-M=13.0, plus a Davenport et al. (2014) color-color locus cut. The distance modulus is adopted without justification or citation; standard values for 47 Tuc are typically near 13.27. The width of the isochrone region is set by the mean r-band uncertainty, but no sensitivity analysis is provided. Since the claimed factor-of-three increase in candidate members is a headline result, the paper should either justify m-M from the literature, report how the counts change with the selection region width, or calibrate the selection against known proper-motion or high-resolution members. As written, the membership numbers are not robust to reasonable choices of these free parameters.
- [Section 3 and Figure 1] The 'inner completeness radii' of ~28 pc and ~14 pc are stated in the figure caption as approximate, but the method for estimating them is not described in the text. The coadd catalog's 'sharp falloff' is mentioned qualitatively, but no radial surface-density profile, completeness curve, or quantitative definition (e.g., radius at which the observed density drops below a fraction of a King profile) is shown for either catalog. Without a quantitative definition, the factor-of-two improvement in radial reach is anecdotal rather than demonstrated.
minor comments (4)
- [Section 3] There is a typo: 'removed sources with only 1 detection any of in the gri bands' should read 'removed sources with only 1 detection in any of the gri bands.'
- [Abstract] The abstract's phrase 'recovering well-defined color magnitude diagrams for 47 Tuc Small Magellanic Cloud' is missing a conjunction or punctuation; it should likely be 'for 47 Tuc and the Small Magellanic Cloud.'
- [Figure 1 caption] The caption refers to 'the stellar locus cut described in the text (pink lines),' but the text never describes pink lines or their placement; clarify the color coding in the caption.
- [Section 2] The selection 'with 25 > g >14 mag' is written in a nonstandard order; consider rewriting as 'with 14 < g < 25 mag' for clarity.
Circularity Check
No significant circularity: catalog measurements and empirical cuts are independent of the paper's claims.
full rationale
The paper is an observational catalog analysis, not a model-derived prediction. The central claims—that the coadd-object catalog loses sources inside roughly 28 pc and that forced photometry at DIAObject positions extends recovery to about 14 pc with 14,744 candidate members—follow directly from measured catalog properties and quality cuts, not from any parameter fitted to the target quantity. The color-magnitude selection uses a MIST isochrone (Choi et al. 2016; Dotter 2016) and a color-color stellar locus (Davenport et al. 2014) as independent external calibrations; although Davenport is a coauthor of the present paper, the cited locus is an empirical stellar-locus relation external to this analysis, and the same cut is applied to both catalogs. The recovery radii are measured spatial completeness limits rather than quantities defined by the selection. The acknowledged systematics—un-deblended forced PSF photometry, bad-subtraction centroid offsets, and the spurious blue plume near the core—are correctness risks that a high-resolution cross-match could address, but they do not make any step of the derivation circular by construction.
Assumptions & free parameters
free parameters (6)
- Isochrone region width =
hand-tuned by mean r-band uncertainty
- Adopted distance modulus m-M =
13.0
- Median photometric error threshold =
< 0.25 mag
- Detection standard deviation threshold =
< 0.25 mag
- Minimum detections per band =
2 (remove sources with only 1 detection)
- Color-color locus distance threshold =
< 0.2 mag
assumptions (3)
- domain assumption MIST isochrone with log10(age/yr)=10.3, [Fe/H]=-0.78, m-M=13.0 describes the 47 Tuc main sequence and giant branch
- domain assumption The Davenport et al. (2014) stellar color-color locus is valid for stars in the 47 Tuc field and does not exclude genuine cluster members
- domain assumption DIAObject positions and forced photometry measure individual stars rather than blended light in the crowded core
Cite this review
Pith. "Pith review of Crowded Field Photometry with Rubin: Exploring 47 Tucanae with Data Preview 1." pith.science (2026). https://pith.science/paper/OUUU2PDX
@misc{pith2026250703228,
  author       = {Pith},
  title        = {Pith review of: Crowded Field Photometry with Rubin: Exploring 47 Tucanae with Data Preview 1},
  year         = {2026},
  howpublished = {\url{https://pith.science/paper/OUUU2PDX}},
  note         = {Machine review of arXiv:2507.03228}
}
abstract
We analyze imaging from Data Preview 1 of the Vera C. Rubin Observatory to explore the performance of early LSST pipelines in the 47 Tucanae field. The coadd-\texttt{object} catalog demonstrates the depth and precision possible with Rubin, recovering well-defined color magnitude diagrams for 47 Tuc Small Magellanic Cloud. Unfortunately, the existing pipelines fail to recover sources within $\sim$28 pc of the cluster center, due to the extreme source density. Using Rubin's forced photometry on stars identified via Difference Imaging, we can recover sources down to $\sim$14 pc from the cluster center, and find 14744 potential cluster members with this extended dataset. While this forced photometry has significant systematics, our analysis showcases the potential for detailed structural studies of crowded fields with the Rubin Observatory.
Figures
Forward citations
Cited by 1 Pith paper
-
Optical Counterparts to X-ray sources in LSST DP1
A multi-catalog X-ray to LSST DP1 crossmatch finds 2314 optical counterparts, most reliable in the E-CDF-S field, with no strong accreting compact object candidates found.
Reference graph
Works this paper leans on
-
[1]
, " * write output.state after.block = add.period write newline
ENTRY address archivePrefix author booktitle chapter doi edition editor eprint howpublished institution journal key month number organization pages publisher school series title misctitle type volume year version url label extra.label sort.label short.list INTEGERS output.state before.all mid.sentence after.sentence after.block FUNCTION init.state.consts ...
-
[2]
write newline
" write newline "" before.all 'output.state := FUNCTION format.url url empty "" new.block "" url * "" * if FUNCTION format.eprint eprint empty "" archivePrefix empty "" archivePrefix "arXiv" = new.block " " eprint * " " * new.block " " eprint * " " * if if if FUNCTION format.doi doi empty "" " " doi * " " * if FUNCTION format.pid doi empty eprint empty ur...
-
[3]
- [1] #1 = = ^ ^ ^ .\!\!^ d .\!\!^ h .\!\!^ m .\!\!^ s .\!\!^ @mss
thebibliography [1] 20pt to REFERENCES 6pt =0pt -12pt 10pt plus 3pt =0pt =0pt =1pt plus 1pt =0pt =0pt -12pt =13pt plus 1pt =20pt =13pt plus 1pt \@M =10000 =-1.0em =0pt =0pt 0pt =0pt =1.0em @enumiv\@empty 10000 10000 `\.\@m \@noitemerr \@latex@warning Empty `thebibliography' environment \@ifnextchar \@reference \@latexerr Missing key on reference command E...
2021
-
[4]
Baumgardt H., Vasiliev E., 2021, @doi [Monthly Notices of the Royal Astronomical Society] 10.1093/mnras/stab1474 , 505, 5957
-
[5]
Caplar N., et al., 2025, Using LSDB to enable large-scale catalog distribution, cross-matching, and analytics, @doi 10.48550/arXiv.2501.02103 , https://ui.adsabs.harvard.edu/abs/2025arXiv250102103C
-
[6]
D., 2016, @doi [The Astrophysical Journal] 10.3847/0004-637X/823/2/102 , 823, 102
Choi J., Dotter A., Conroy C., Cantiello M., Paxton B., Johnson B. D., 2016, @doi [The Astrophysical Journal] 10.3847/0004-637X/823/2/102 , 823, 102
-
[7]
Choi Y., et al., 2025, 47 Tuc in Rubin Data Preview 1: Exploring Early LSST Data and Science Potential , @doi 10.48550/arXiv.2507.01343 , http://arxiv.org/abs/2507.01343
-
[8]
Davenport J. R. A., et al., 2014, @doi [Monthly Notices of the Royal Astronomical Society] 10.1093/mnras/stu466 , 440, 3430
Show all 13 references
-
[9]
Dotter A., 2016, @doi [The Astrophysical Journal Supplement Series] 10.3847/0067-0049/222/1/8 , 222, 8
2016 doi
-
[10]
A., et al., 2018, @doi [Proceedings of the Royal Society of London Series A] 10.1098/rspa.2017.0616 , 474, 20170616
Forbes D. A., et al., 2018, @doi [Proceedings of the Royal Society of London Series A] 10.1098/rspa.2017.0616 , 474, 20170616
2018
-
[11]
Rubin Observatory Science Pipelines Developers 2025, The LSST Science Pipelines Software : Optical Survey Pipeline Reduction and Analysis Environment , @doi https://doi.org/10.71929/rubin/2570545
2025
-
[12]
Rubin Observatory 2025, The Vera C
Vera C. Rubin Observatory 2025, The Vera C. Rubin Observatory Data Preview 1 , @doi 10.71929/rubin/2570536
2025
-
[13]
write newline
" write newline "" before.all 'output.state := FUNCTION fin.entry write newline FUNCTION new.block output.state before.all = 'skip after.block 'output.state := if FUNCTION new.sentence output.state after.block = 'skip output.state before.all = 'skip after.sentence 'output.stat...
Reviewed August 6, 2026 · model on record in the stance chip above.
Discussion (0). Continue with ORCID to comment.