REVIEW 2 major objections 4 minor 96 references
Photodesorption of SO2 and SO from UV-irradiated SO2 ices
T0 review · 2 major / 4 minor · reviewed 2026-08-06 · deepseek-v4-flash
Pith's one-line read This paper reports the first ISM-relevant laboratory measurement of how vacuum-ultraviolet photons release SO2 and SO from SO2 ice, giving yields of about 2e-4 and 6e-5 molecules per photon at 14 K, and a theoretical band strength for the…
desk verdict Solid SO2 photodesorption yields and a useful SO3 band strength; the tentative SO yield rides on a m/z=48 assignment that needs a quantitative check. read the letter →
The pith
A machine-rendered reading of the paper's core claim, the machinery that carries it, and where it could break.
The reading
What carries the argument
The central experimental object is the calibrated quadrupole mass spectrometer signal: ion currents at m/z 64, 48, and 32 are converted into photodesorption column densities using a calibration constant derived from CO photodesorption, electron-impact ionization cross-sections, measured fragmentation fractions, QMS sensitivity as a function of mass, and species-dependent pumping speeds. The SO yield is the residual in the m/z=48 signal after subtracting the SO2 fragmentation contribution, and its tentative identification relies on the absence of a companion m/z=32 signal that an ozone contribution would produce. On the infrared side, the paper runs density-functional-theory vibrational calculations on a periodic eight-molecule amorphous SO3 ice model to sum the intensities of the antisymmetric stretching vibrations into a band strength, with the ice density assumed equal to that of liquid SO3 and a 15 percent uncertainty budget derived from density variation.
What would settle it
Irradiate an isotopically labeled SO2 ice, such as 18O-substituted or 34S-substituted SO2, and watch the excess photodesorption signal around mass 48: if the excess shifts to the mass of the labeled SO product, the tentative SO assignment is confirmed, whereas if it shifts to the mass of an ozone isotopolog or remains at 48, the claimed SO yield does not measure SO. A simpler concurrent check is to search for the companion m/z=32 signal during irradiation; the paper reports none, which favors SO over O3, but an isotopolog run would settle it directly.
Extended reading notes
Core claim
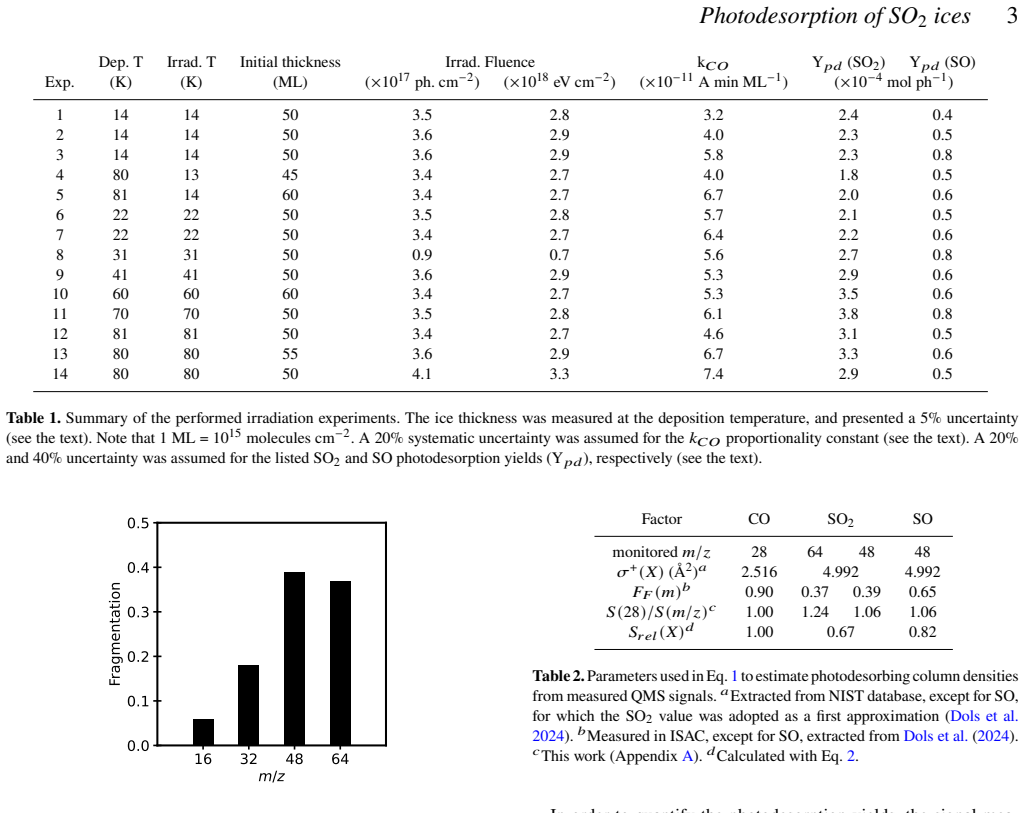
On the paper's own terms, the discovery is a set of quantitative laboratory constraints: VUV-irradiated SO2 ice photodesorbs SO2 at a yield of roughly 2.3e-4 molecules per photon at 14 K, rising to 3.8e-4 at 70 K and declining at 80 K, and it also releases SO at a tentative yield of roughly 6e-5 molecules per photon at 14 K, with the SO yield insensitive to temperature and fluence. The SO2 yield is comparable to that of CO2 but one to two orders of magnitude below CO and NH3, showing that photodesorption efficiency is molecule-specific. The fluence-independence of the SO signal is interpreted as evidence for a photochemical desorption mechanism, in which SO desorbs promptly upon its formation from photodissociated SO2, rather than through an energy-transfer process that would accumulate surface photoproducts. In addition, the paper provides the first reported infrared band strength for SO3 in an amorphous ice, 1.1e-16 cm molecule-1 at about 1395 cm-1 (7.2 micron), and demonstrates that using this value rather than the SO2 band strength changes derived SO3 ice column densities by at least a factor of two.
Load-bearing premise
The tentative SO yield rests on the assumption that the excess mass-48 signal, after removing the SO2 fragmentation contribution, is photodesorbing SO rather than ozone or another 48-amu molecule; the paper itself states that isotopolog experiments would be required to confirm this.
Editorial extensions
If this is right
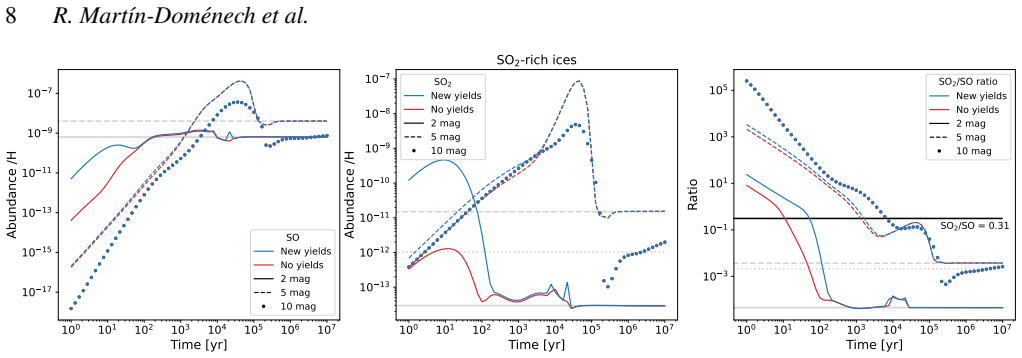
- Astrochemical models can now treat UV photodesorption of SO2 and SO with lab-measured yields instead of scaling from other molecules; the paper's models show the effect is largest at extinctions below about 5 magnitudes and in the first roughly 100 years of cloud evolution.
- The strong temperature dependence of the SO2 yield, peaking near the amorphous-to-crystalline transition at 70 K, means models of warmer ice mantles should use temperature-dependent desorption rates rather than a single low-temperature value.
- With the new SO3 band strength, the 7.2 micron feature becomes a quantitative tool: 5-sigma detection thresholds of about 4e15 cm-2 toward bright continua are within reach of JWST/MIRI, though methanol and continuum-subtraction contamination must be removed first.
- The fluence-independence of the SO signal implies prompt photochemical desorption, so SO is injected into the gas phase at the moment of its formation, which couples the photochemistry of the ice directly to the gas-phase sulfur budget.
Reading between the lines
- If the SO assignment survives isotopolog tests, the photochemical desorption of a photoproduct from its parent ice would be a rare direct laboratory demonstration of a mechanism that many models invoke to explain unsaturated molecules in cold gas.
- The nearly linear relationship between the computed SO3 band strength and the assumed ice density in the appendix suggests that a single experimental measurement of amorphous SO3 ice density would sharpen every JWST-derived SO3 column density; until then, the 15 percent density-induced uncertainty is the limiting error.
- Because SO2 photodesorption efficiency changes with temperature and crystallinity, similar experiments on mixed ices (for example SO2 in water- or CO-dominated mantles) could reveal whether the yields measured here over- or underestimate desorption in realistic interstellar grain mantles.
- The paper's model uses a static isobaric PDR structure, leaving open whether dynamical front motion would enhance the photodesorption contribution; a time-dependent PDR model with the new yields would be a natural next test.
Signed reviews
Editorial analysis
A structured set of objections, weighed in public.
Referee Report
Summary. This paper reports laboratory measurements of VUV photodesorption yields for SO2 ice and, tentatively, for SO, over a temperature range of 14–80 K, using the ISAC setup with a calibrated quadrupole mass spectrometer and simultaneous IR spectroscopy. The authors find a SO2 yield of about 2.3×10^-4 molecules per incident photon at 14 K, increasing to about 3.8×10^-4 at 70 K and then decreasing at 80 K, with a tentative SO yield of about 6×10^-5 molecules per photon at 14 K that shows no clear temperature trend. They also use DFT calculations to derive a band strength of 1.1×10^-16 cm molecule^-1 for the ~1395 cm^-1 SO3 IR feature. The photodesorption yields are then implemented in the Nautilus gas-grain chemical model for the Horsehead PDR, and the SO3 band strength is used to estimate JWST/MIRI detectability thresholds for SO3 in interstellar ices.
Significance. If the results hold, this paper provides the first ISM-relevant laboratory constraints on non-thermal desorption of SO2 and SO, quantities that astrochemical models currently lack. The SO2 yield is well supported by duplicate experiments, documented calibrations, and deposited data, and the temperature dependence is a useful input for models of UV-illuminated icy environments. The DFT-based SO3 band strength is a valuable addition for future JWST searches, and the synthetic ice spectra illustrate a concrete observational strategy. The paper is also transparent about the tentative nature of the SO assignment, which is appropriate given the unresolved carrier ambiguity. The main scientific impact will depend on whether the SO result can be confirmed, because the modeling conclusions in Section 4.2 use that yield as a quantitative input.
major comments (2)
- [Section 3.2, Table 1, ninth column] The SO photodesorption yield is obtained by subtracting the SO2 fragmentation contribution from the measured m/z=48 QMS signal and assigning the residual to SO, but O3 is not quantitatively excluded. The O3 column density needed to explain the excess is on the order of 2×10^13 cm^-2 (about 0.02 ML), which is small compared with the ~1 ML of SO3 detected and likely below the detection limit of the IR spectra; the absence of the 1040 cm^-1 O3 band therefore does not provide a quantitative upper limit. In addition, the m/z=32 argument is qualitative because no baseline noise level or upper limit is reported, even though the expected O3 m/z=32 signal would be roughly five times the m/z=48 excess. The adopted SO ionization cross-section and fragmentation fraction from SO2/Dols et al. (2024) add systematic uncertainty that is not included in the quoted 40% uncertainty. The authors correctly recommend isotopolog experiments; until such data or a quantitative O3 upper limit are available, the SO yield should be presented as an upper limit rather than a measured value.
- [Section 4.2, Fig. 6] The Nautilus models treat the tentative SO yield as a quantitative input, and the conclusion that SO photodesorption is a main gas-phase source at extinctions below 5 mag depends on the m/z=48 carrier being SO rather than O3. If the carrier is O3, the SO yield would need to be removed from the model, and the predicted SO abundance and SO2/SO ratio at low extinction would change. The modeling section should either explicitly frame the SO run as a provisional scenario contingent on confirmation of the carrier, or defer the quantitative SO modeling until the identification is established.
minor comments (4)
- [Section 3.2 and Fig. 5 caption] The text and the Figure 5 caption state that the SO photodesorption rate is calculated 'using Eq. 3', but Eq. 3 is the IR band-strength relation; the QMS calibration uses Eq. 1, and this appears to be a typographical error.
- [Section 3.1] The word 'assginment' should be 'assignment' in the phrase about the SO3 IR feature.
- [References] The reference list contains some typographical errors, including 'Dufuor' for 'Dufour' in the Le Gal et al. entry and 'Wesemberg' for what is presumably 'Wesenberg' in the 2007 paper; please verify these names.
- [Section 4.2] The citation 'Le Gal et al. 20217' should be 'Le Gal et al. 2021'.
Circularity Check
No significant circularity: the photodesorption yields and SO3 band strength are produced by direct measurement and first-principles calculation, not by fitting to the quantities they are later used to interpret.
full rationale
The central results are experimentally measured or theoretically computed, and the model applications use them as fixed inputs. The SO2 photodesorption yield is obtained from the baseline-subtracted m/z = 64 QMS signal through Eq. 1 and the measured photon fluence; the SO yield is the residual m/z = 48 signal after subtracting the SO2 fragmentation contribution. No parameter in Eq. 1 is fitted to these desorption signals: k_CO is calibrated with a pure CO ice (Appendix A), ionization cross-sections are taken from NIST and Dols et al. (2024), and the QMS sensitivity is calibrated using noble gases. The Nautilus models in Section 4.2 insert the measured yields and compare the resulting abundances to observations; the observed SO2/SO ratio is not used to adjust or invert the yields, so no fitted-input-called-prediction pattern is present. The SO3 IR band strength is obtained from DFT calculations with CASTEP and linear-response theory, using a stated density assumption; it is not derived from the observed SO3 IR absorbance and is applied afterward to convert absorbance into column density. The tentative assignment of the m/z = 48 excess to SO rather than O3 is an acknowledged experimental ambiguity (the authors state that isotopolog experiments would be required to confirm it), but it is not a circular reduction: the carrier choice does not presuppose the reported SO yield. The only self-referential element is the validation citation to 'Escribano et al., in prep.' for the DFT method, but this is not load-bearing because the calculation itself is presented with standard methods and stated assumptions that do not include the target band strength. Overall, the derivation chain is self-contained against external benchmarks such as NIST cross-sections, noble-gas calibrations, and literature IR band strengths.
Assumptions & free parameters
free parameters (4)
- SO3 amorphous ice density =
1.92 g cm-3 (liquid SO3 density assumed)
- QMS sensitivity function for m/z > 40 =
k*QMS*S = 1.05e15 - 6.7e12 x (m/z) A mbar-1 Angstrom2
- SO electron-impact ionization cross-section =
4.992 Angstrom2 (adopted from SO2)
- k_CO proportionality constant per experiment =
3.2 to 7.4 x 10⁻¹¹ A min ML-1 (Table 1)
assumptions (6)
- domain assumption The excess m/z=48 QMS signal during irradiation originates from photodesorbing SO molecules rather than O3 or other 48-amu species.
- domain assumption The QMS signal conversion via Eq. 1 with CO calibration is applicable to SO2 and SO.
- domain assumption The density of amorphous SO3 ice equals the liquid density (1.92 g cm-3).
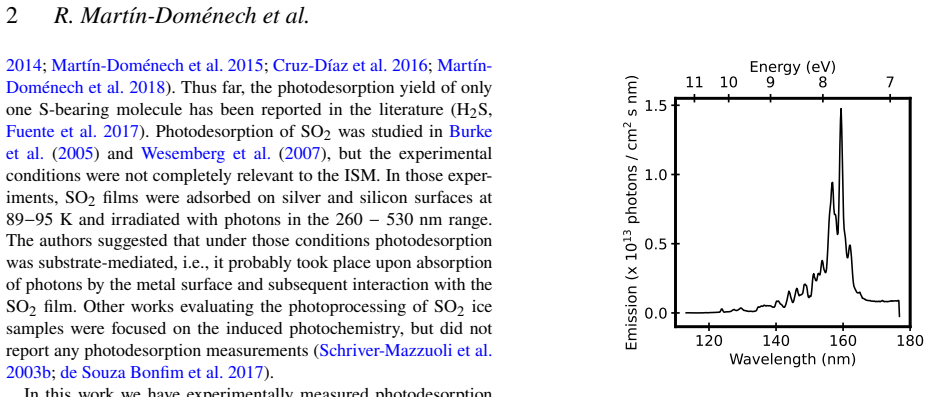
- domain assumption The UV absorption cross-section and the about 30% absorbed photon fraction are known well enough to define yields per incident photon.
- domain assumption The static isobaric PDR structure with the Meudon code and the Nautilus network adequately represents the Horsehead PDR for testing the yields.
- domain assumption DFT with PBE, Grimme dispersion, and an 8-molecule periodic box reproduces amorphous ice IR band strengths.
Cite this review
Pith. "Pith review of Photodesorption of SO2 and SO from UV-irradiated SO2 ices." pith.science (2026). https://pith.science/paper/6HP5FDN5
@misc{pith2026250706081,
  author       = {Pith},
  title        = {Pith review of: Photodesorption of SO2 and SO from UV-irradiated SO2 ices},
  year         = {2026},
  howpublished = {\url{https://pith.science/paper/6HP5FDN5}},
  note         = {Machine review of arXiv:2507.06081}
}
read the original abstract
The detection of high gas-phase abundances of SO2 and SO in the cold envelope of an intermediate mass protostar suggests that these molecules might form on icy dust grains and subsequently desorb to the gas phase by non-thermal desorption processes such as photodesorption. In this work we report photodesorption yields for SO2 and, tentatively, SO upon ultraviolet photon irradiation of SO2 ice samples at temperatures between 14 and 80 K. Photodesorption yields were measured directly in the gas phase using a calibrated quadrupole mass spectrometer. Yields of 2.3 x 10⁻⁴ molecule/photon and 6 x 10⁻⁵ molecule/photon were estimated for SO2 and SO at 14 K (respectively). The SO2 photodesorption yield increased with temperature up to a value of 3.8 x 10⁻⁴ molecule/photon at 70 K, followed by a decrease at 80 K that could be due to crystallization of the sample. The signal assigned to SO photodesorption did not significantly change with temperature. The estimated photodesorption yields were included in the Nautilus gas-grain chemical model to evaluate their contribution to the SO2 and SO gas-phase abundances in an astrophysical environment. In addition, we also present a theoretically estimated band strength for the 1395 cm-1 SO3 IR feature (A = 1.1 x 10⁻¹⁶ cm molecule-1). SO3 is the main detected product in irradiated SO2 ices, and a potential contributor to the 7.2 um band observed in some interstellar ice IR spectra.
Figures

Figures from the paper (5 more)




Reference graph
Works this paper leans on
-
[1]
write newline
" write newline "" before.all 'output.state := FUNCTION fin.entry write newline FUNCTION new.block output.state before.all = 'skip after.block 'output.state := if FUNCTION new.sentence output.state after.block = 'skip output.state before.all = 'skip after.sentence 'output.state := if if FUNCTION not #0 #1 if FUNCTION and 'skip pop #0 if FUNCTION or pop #1...
-
[2]
Abergel A., et al., 2003, A&A, 410, 577
2003
-
[3]
Anthony-Twarog B.J., 1982, AJ, 87, 1213
1982
-
[4]
Artur de la Villarmois E., et al., 2018, A&A, 614, A26
2018
-
[5]
Artur de la Villarmois E., J rgensen J.K., Kristensen L.E., Bergin E.A., Harsono D., Sakai N., van Dishoeck E.F., Yamamoto S., 2019, A&A, 626, A71
2019
-
[6]
Bertin M., et al.,2012, Phys. Chem. Chem. Phys., 14, 9929
2012
-
[7]
Boissier J., et al., 2007, A&A, 475, 1131
2007
-
[8]
Boogert A.C.A., Schutte W.A., Helmich F.P., Tielens A.G.G.M., Wooden D.H., 1997, A&A, 317, 929
1997
Show all 96 references
-
[9]
Booth A., Ilee J.D., Walsh C., Kama M., Keyte L., van Dishoeck E.F., Hideko N., A&A, 669, A53
-
[10]
Booth A., van der Marel N., Leemker M., van Dishoeck E.F., Ohashi S., 2021, A&A, 651, L6
2021
-
[11]
Booth A., Walsh C., Kama M., Loomis R.A., Maud L.T., Juh\'asz A., 2018, A&A, 611, A16
2018
-
[12]
arXiv:1801.01547
Bron E., Ag\'undez M., Goicoechea J.R., Cernicharo J., 2018, arXix e-prints, p. arXiv:1801.01547
2018 arXiv
-
[13]
Sci., 585, 123
Burke D.J., Vondrak T., Meech S.R., 2005, Surf. Sci., 585, 123
2005
-
[14]
et al., 2016, MNRAS, 462, 1, S253
Calmonte U. et al., 2016, MNRAS, 462, 1, S253
2016
-
[15]
1992, MNRAS 258, 125
Cecchi-Pestellini C., & Aiello S. 1992, MNRAS 258, 125
1992
-
[16]
Chaabouni H., Schriver-Mazzuoli L., Schriver A., 2000, J. Phys. Chem. A, 104, 3498
2000
-
[17]
Charnley S.B., 1997, ApJ, 481, 396
1997
-
[18]
R., 2014, ApJ, 781, 15
Chen Y.-J., Chuang K.-J., Mu\ noz Caro G.M., Nuevo, M., Chu C.-C., Yih T.S., Ip W.-H., Wu C.-Y. R., 2014, ApJ, 781, 15
2014
-
[19]
Kristall., 220, 567--570
Clark S.J., Segall M.D., Pickard C.J., Hasnip P.J., Probert M.J., Refson K., Payne M.C., 2005, Z. Kristall., 220, 567--570
2005
-
[20]
Cruz-D\'iaz G.A., Mart\'in-Dom\'enech R., Mu\ noz Caro G.M., Chen Y.-J., 2016, A&A, 592, A68
2016
-
[21]
Cruz-D\'iaz G.A., Mu\ noz Caro G.M., Chen Y.-J., Yih T.-S., 2014a, A&A, 562, A119
-
[22]
Cruz-D\'iaz G.A., Mu\ noz Caro G.M., Chen Y.-J., 2014c, MNRAS, 439, 2370
-
[23]
Cruz-D\'iaz G.A., Mu\ noz Caro G.M., Chen Y.-J., Yih T.-S., 2014c, A&A, 562, A120
-
[24]
Dalton J.B., Cruikshank D.P., Stephan K., McCord T.B., Coustenis A., Carlson R.W., Coradini A., 2010, Chemical Composition of Icy Satellite Surfaces, 153
2010
-
[25]
Dartois E., et al., 2024, NatAs, 8, 359
2024
-
[26]
Chem., 75, 685
de Laeter J.R., B\"ohlke, J.R., De Bievre, P., et al.\ 2003, Pure Appl. Chem., 75, 685
2003
-
[27]
de Souza Bonfim V., de Castilho R.B., Baptista L., Pilling S., 2017, PCCP, 19, 26906
2017
-
[28]
del Burgo Olivares C., Carrascosa H., Escribano B., Mu\ noz Caro G.M., Mart\'in-Dom\'enech R., 2024, MNRAS, 527-3, 8829
2024
-
[29]
Dols V., Paterson W.R., Bagenal F., 2024, J. Geophys. Res: Sp. Phys., 129, e2023JA031763
2024
-
[30]
Dutrey A., et al., 2011, A&A, 535, A104
2011
-
[31]
el Akel M., Kristensen L.E., Le Gal R., van der Walt S.J., Pitts R.L., Dulieu F., A&A, 659, A100
-
[32]
et al., in prep
Escribano B. et al., in prep
-
[33]
Facchini S., Teague R., Bae J., Benisty M., Keppler M., Isella A., 2021, AJ, 162-3, id.99
2021
-
[34]
Ferrante R.F., Moore M.H., Spiliotis M.M., Hudson R.L., 2008, ApJ, 684, 1210
2008
-
[35]
Fillion J.-H., et al., 2014, Farady Discuss., 168, 533
2014
-
[36]
Fuente A., Cernicharo J., Ag\'undez M., Bern\'e O., Goicoechea J.R., Alonso-Albi T., Marcelino N., 2010, A&A, 524, A19
2010
-
[37]
Fuente A., et al., 2017, ApJL, 851-2, L49
2017
-
[38]
Garozzo M., Fulvio D., Gomis O., Palumbo M.E., Strazzulla G., 2008, Plan. and Sp. Sci., 56, 1300
2008
-
[39]
Gerakines P.A., Schutte W.A., Greenberg J.M., van Dishoeck E.F., 1995, A&A, 296, 810
1995
-
[40]
Goicoechea L.J., Shalyapin V.N., 2016, A&A, 596, A77
2016
-
[41]
Goicoechea J.R., Pety J., Gerin M., Teyssier D., Roueff E., Hily-Blant P., Baek S., 2006, A&A, 456, 565
2006
-
[42]
Goicoechea J.R., Pety J., Gerin M., Hily-Blant P., Le Bourlout J., 2009, A&A, 498, 771
2009
-
[43]
Gratier P., Pety J., Guzm\'an V., Gerin M., Goicoechea J.R., Roueff E., Faure A., 2013, A&A, 557, A101
2013
-
[44]
Guzm\'an V.V., et al., 2013, A&A, 560, A73
2013
-
[45]
Guzm\'an V.V., Pety J., Gratier P., Goicoechea J.R., Gerin M., Roueff E., Le Petit F., Le Bourlot J., 2014, Faraday Discussions, 168, 103
2014
-
[46]
Guzm\'an V.V., Pety J., Goicoechea J.R., Gerin M., Roueff E., Gratier P., \"Oberg K.I., 2015, ApJ, 800, L33
2015
-
[47]
Gonz\'alez-D\'iaz C., Carrascosa H., Mu\ noz Caro G.M., Satorre M.\'A., Chen Y.-J., 2022, MNRAS, 517, 5744
2022
-
[48]
Gredel R., Lepp S., Dalgarno A., Herbst E., 1989, ApJ, 347, 289
1989
-
[49]
Grimme S., 2006, J. Comput. Chem., 27, 1787
2006
-
[50]
Guilloteau S., et al., 2016, A&A, 592, A124
2016
-
[51]
Rev., 136, B864
Hohenberg P., Kohn W., 1964, Phys. Rev., 136, B864
1964
-
[52]
Hern\'andez-Vera C., et al., 2023, A&A, 677, A152
2023
-
[53]
& Schiff H.I., 1956, J
Herron J.T. & Schiff H.I., 1956, J. Chem. Phys., 24, 1266
1956
-
[54]
Holtom P.D., Dawes A., Mukerji R.J., Davis M.P., Webb S.M., Hoffman S.V., Mason N.J., 2006, PCCP, 8, 714
2006
-
[55]
Joblin C., et al., 2018, A&A 615, A129
2018
-
[56]
Kaiser R.I., Jansen P., Petersen K., Roessler K., 1995, Rev. Sci. Instrum., 66, 5226
1995
-
[57]
Kaufman M.J., Wolfire M.G., Hollenbach D.J., Luhman M.L., 1999, ApJ, 527, 795
1999
-
[58]
Rev., 140, A1133
Kohn W., Sham L.J., 1965, Phys. Rev., 140, A1133
1965
-
[59]
Laas J., Caselli P., 2019, A&A, 624, A108
2019
-
[60]
Le Gal R., et al., 2021, ApJSS, 257-1, id.12
2021
-
[61]
Le Gal R., Herbst E., Dufuor G., Gratier P., Ruaud M., Vidal T.H.G., Wakelam V., 2017, A&A, 605, A88
2017
-
[62]
Le Petit F., Nehm\'e C., Le Bourlot J., Roueff E., 2006, ApJS, 164, 506
2006
-
[63]
Le Roy L., et al., 2015, A&A, 583, A1
2015
-
[64]
Maillard V., Bron E., Le Petit F., 2021, A&A 656, A65
2021
-
[65]
& Kaiser R.I., 2013, ApJ, 773, 184
Maity S. & Kaiser R.I., 2013, ApJ, 773, 184
2013
-
[66]
Mart\'in-Dom\'enech R., Cruz-D\'iaz G.A., Mu\ noz Caro G.M., 2018, MNRAS, 473, 2575
2018
-
[67]
Mart\'in-Dom\'enech R., Manzano-Santamar\'ia J., Mu\ noz Caro G.M., Cruz-D\'iaz G.A., Chen Y.-J., Herrero V.J., Tanarro I., 2015, A&A, 584, A14
2015
-
[68]
Mart\'in-Dom\'enech R., Mu\ noz Caro G.M., Cruz-D\'iaz G.A., 2016, A&A, 589, A107
2016
-
[69]
et al., 2023, NatAs, 7, 431
McClure M.K. et al., 2023, NatAs, 7, 431
2023
-
[70]
Moore M.H., 1984, Icarus, 59, 114
1984
-
[71]
Moore M., Hudson R.L., Carlson R.W., 2007, Icarus, 189, 409
2007
-
[72]
of Phys.: Cond
Mozo R., Agusta M.K., Rahman M.M., A Diño W., Rodulfo E., Kasai H., 2007, Jour. of Phys.: Cond. Matter, 19, 36, 365244
2007
-
[73]
et al., 2022, Front
Mifsud D.V. et al., 2022, Front. in Chem., 10, id.1003163
2022
-
[74]
Mu\ noz Caro G.M., et al., 2010, A&A, 522, A108
2010
-
[75]
\"Oberg K.I., Fuchs G.W., Awad Z., Fraser H.J., Schlemmer S., van Dishoeck E.F., Linnartz H., 2007, 662-1, L23
2007
-
[76]
Perdew J.P., Burke K., Ernzerhof M., 1996, Phys. Rev. Lett., 77, 3865--3868
1996
-
[77]
Podio L., Codella C., Gueth F., et al., 2015, A&A, 581, A85
2015
-
[78]
Pollack J.B., Toon O.B., Boese R., 1980, J. Geophys. Res., 85, 8223
1980
-
[79]
Refson K., Tulip P.R., Clark S.J., 2006, Phys. Rev. B., 73, 155114
2006
-
[80]
2002, Phys
Rejoub R., Lindsay B.G., Stebbings R.F. 2002, Phys. Rev. A, 65, 042713
2002
-
[81]
Rivière-Marichalar P., et al., 2019, A&A, 628, A16
2019
-
[82]
Ruaud M., Wakelam V., Hersant F., 2016, MNRAS, 459, 3756
2016
-
[83]
Sakai N., Oya Y., L\'opez-Sepulcre A., et al., 2016, ApJL, 820, L34
2016
-
[84]
Sakai N., Oya Y., Sakai T., et al., 2014a, ApJL, 791, L38
-
[85]
Sakai N., Sakai T., Hirota T., et al., 2014b, Nature, 507, 78
-
[86]
Schriver-Mazzuoli L., Chaabouni H., Schriver A., 2003a, J. Mol. Str., 644, 151
-
[87]
Schriver-Mazzuoli L., Schriver A., Chaabouni H., 2003b, Can. J. Phys., 81, 301
-
[88]
Semenov D., Favre C., Fedele D., et al., 2018, A&A, 617, A28
2018
-
[89]
J., Greenberg J
Shen C. J., Greenberg J. M., Schutte W. A., van Dishoeck E. F., 2004, A&A, 415, 203
2004
-
[90]
Taillard A., et al., 2025a, A&A, 694, A263
-
[91]
Taillard A., et al., 2025b, A&A, submitted
-
[92]
van der Tak F.F.S., Boonman A.M.S., Braakman R., van Dishoeck E:F., 2003, A&A, 412, 133
2003
-
[93]
Wakelam V., Gratier P., Loison J.C., Hickson K.M., Penguen J., Mechineau A., 2024, A&A, 689, A63
2024
-
[94]
Wesemberg C., Autzen O., Hasselbrink E., 2007, Appl. Phys. A, 88, 559
2007
-
[95]
Yarnall Y.Y., Hudson R.L., 2022, ApJL, 931, L4
2022
-
[96]
Yung Y.L., Demore W.B., 1982, Icarus, 51, 199
1982
Reviewed August 6, 2026 · model on record in the stance chip above.
Discussion (0). Continue with ORCID to comment.