REVIEW 3 major objections 6 minor 2 cited by
The EDGE-CALIFA survey: Star formation relationships for galaxies at different stages of their evolution
T0 review · 3 major / 6 minor · reviewed 2026-08-06 · deepseek-v4-flash
Pith's one-line read This paper argues that star formation quenching requires a collapse in star formation efficiency in galactic centres, not molecular gas depletion alone, based on 643 CALIFA galaxies with CO data.
desk verdict Solid stage-resolved study with a strong central claim that is undercut by low CO detection rates in the retired groups. read the letter →
The pith
A machine-rendered reading of the paper's core claim, the machinery that carries it, and where it could break.
The reading
What carries the argument
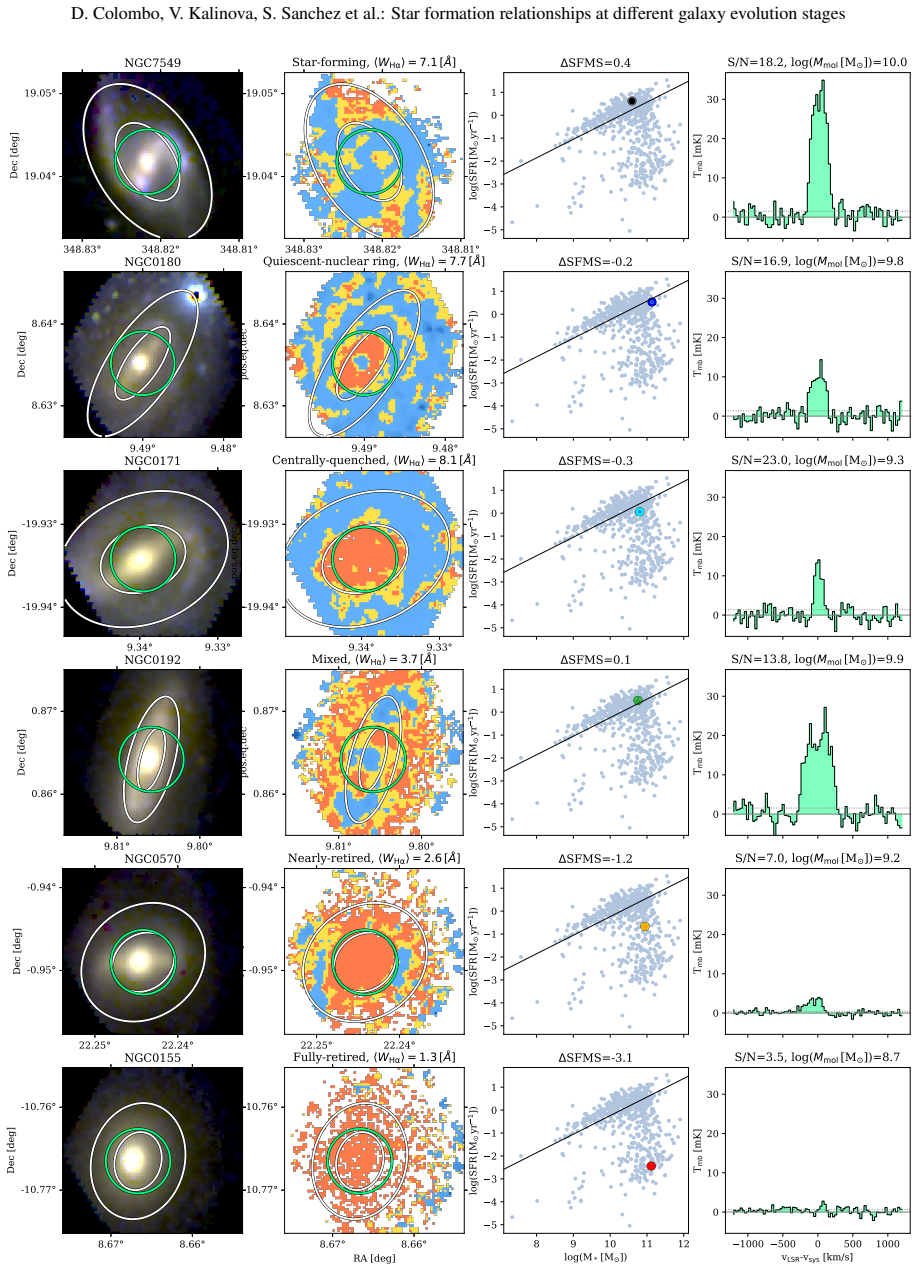
The central machinery is the QueStNA emission-line classification, which assigns each galaxy a quenching stage from the spatial pattern of H-$\alpha$ equivalent width ($W_{\mathrm{H}\alpha} > 6$ \AA{} marking star-forming regions, $W_{\mathrm{H}\alpha} < 3$ \AA{} marking retired regions, and the range between them marking mixed ionisation), together with the iEDGE homogenised database of CO(1-0) and CO(2-1) fluxes and CALIFA optical maps. Beam quantities measured within the 26.3-arcsec APEX beam, which has a median size of about one effective radius, are compared with global quantities to isolate central behaviour. The quantitative analysis is carried by Bayesian linear regressions that treat CO non-detections as upper limits, flaring plots that compare each stage's median to the star-forming median, two-dimensional Kolmogorov-Smirnov tests, and principal component analysis eigenvalue ratios that diagnose whether a three-dimensional relation is line-like.
What would settle it
Resolve the central half effective radius of nearly and fully retired galaxies in sensitive CO observations: if their central molecular gas is detected and forms stars at normal efficiencies, the claimed central efficiency collapse would disappear; if the central SFE deficit persists at sub-kiloparsec resolution, the inside-out quenching claim would be confirmed.
Extended reading notes
Core claim
The central claim is that star formation quenching is a two-stage process: a steady loss of molecular gas relative to stellar mass brings galaxies from the star-forming sequence into the green valley, and then a collapse in star formation efficiency, most pronounced in the central regions, carries them into retirement. The evidence includes median star formation efficiencies that are nearly constant for the star-forming, quiescent-nuclear-ring, and centrally quenched stages, then fall by factors of 20 to 30 for the nearly retired and fully retired stages. The molecular gas--stellar mass relation flattens from a slope near 1.08 for star-forming galaxies to about 0.57 for fully retired galaxies, while the star formation rate--molecular gas relation steepens from about 0.79 to values above 2 as the intercept drops, so retired galaxies sit at much lower efficiency for a given gas mass. Principal component analysis shows a line-like three-dimensional relation among star formation rate, stellar mass, and molecular gas mass only for the star-forming group, with the other stages scattered in that space. Taken together, the paper argues that a significant decrease in star formation efficiency is necessary to retire the centres of galaxies beyond the star formation green valley.
Load-bearing premise
The retired-stage conclusions depend on treating CO non-detections as upper limits and on taking the 26.3-arcsec beam, roughly one effective radius, as the galaxy centre while the quenching classification defines the centre within half an effective radius.
Editorial extensions
If this is right
- The molecular gas fraction $f_{\rm mol}$ declines continuously across quenching stages, so gas removal is real and matters, but it is not the whole story.
- Star formation efficiency is flat from the star-forming stage through the centrally quenched and quiescent-nuclear-ring stages, with the onset of the efficiency loss occurring at the green-valley (mixed) stage.
- Central star formation efficiency in nearly and fully retired galaxies drops by more than two orders of magnitude relative to the star-forming stage, while the global drop is about one order of magnitude, so the centre leads the quenching.
- The scaling relations change systematically: the SFR--$M_{\rm mol}$ slope steepens from about 0.79 to 2.11, while the $M_{\rm mol}$--$M_*$ slope flattens from about 1.08 to 0.57, implying retired galaxies are gas-poor relative to their stellar mass and inefficient at using the gas they retain.
- Only star-forming galaxies show a line-like three-dimensional relation among SFR, $M_*$, and $M_{\rm mol}$; the other quenching stages scatter in that parameter space, so stage-specific scaling relations are needed.
Reading between the lines
- If the central claim is confirmed, galaxy evolution models should treat quenching as requiring an efficiency-reduction channel rather than gas exhaustion alone; prescriptions that only remove gas will struggle to reproduce the red sequence.
- The result implies that CO surveys of green-valley and retired galaxies should prioritise sensitivity to low-surface-brightness molecular gas, since non-detections currently dominate the fully retired stage and the fitted relations depend on how those upper limits are treated.
- The inside-out efficiency drop is consistent with dynamical suppression or loss of the feedback support that sustains star formation in dense centres, and a direct test would compare central turbulence, shear, and molecular-cloud properties in retired galaxies at sub-kiloparsec resolution.
- Because active galactic nuclei were excluded from the analysis, the central efficiency collapse in this sample cannot be attributed to instantaneous AGN feedback, pointing instead to long-term preventative or dynamical mechanisms operating after gas depletion begins.
Editorial analysis
A structured set of objections, weighed in public.
Referee Report
Summary. This paper uses the iEDGE database (643 CALIFA galaxies with CO data from APEX, CARMA, and ACA) to classify galaxies into six QueStNA quenching stages on the basis of WHα maps and BPT diagnostics, then compares sSFR, Mmol, SFE, and fmol across stages, both globally and in the central ('beam') regions. The main results are that SFE is roughly constant for the SF, QnR, and cQ stages and declines for MX, nR, and fR; that this decline is more pronounced in the centre than globally; that the Mmol-M* relations become shallower and the SFR-Mmol relations steeper with quenching; and that a 3D SFR-M*-Mmol relation exists only for the SF group. The paper concludes that quenching beyond the green valley cannot be explained by molecular gas depletion alone and requires a significant SFE decrease, particularly in galaxy centres.
Significance. If established, the result that molecular gas remains present but is used with reduced efficiency in the centres of retired galaxies would be an important constraint on quenching mechanisms, favoring efficiency-drop scenarios over pure gas exhaustion and supporting inside-out quenching. The paper has real strengths: a large homogenized multi-telescope sample, explicit automatic classification quality flags, linmix regressions that treat upper limits, 2D KS tests, and stacked CO spectra that do not depend on SFR calibration assumptions. However, the central claim rests on the retired-stage SFE measurements, which are the least secure part of the dataset; the paper itself concedes in §4.1 that the retired-stage scaling relations may be driven by upper limits, and that same caveat extends to the SFE drop that carries the abstract's conclusion.
major comments (3)
- [§3.3 / Fig. 7 and §4.2 / Fig. 13] The central claim that a significant SFE decrease is necessary to quench galaxy centres is carried by the flaring plots, which use only CO-detected galaxies (S/N>3). In the retired stages the detection fraction is low: 54% for nR and 27% for fR (Table 1). Because nR and fR are selected to have uniformly low Hα-based SFR, the detected subsample is biased toward the highest Mmol at a given low SFR; if the true SFE were constant, this selection would mechanically lower the measured median SFE = SFR/Mmol. The paper itself states in §4.1 that the retired-group relations can be driven by upper limits and that it cannot fully establish with this sample that retired KS laws actually exist, and this caveat applies equally to the SFE drop that supports the abstract's conclusion. The authors should add a quantitative upper-limit-aware analysis—for example survival-analysis medians for Table 2, linmix full-sample predictions evaluated at the group medians, or an injection test that assigns non-detections SF-like SFE and re-derives the flaring ratios—and show that the beam SFE decline survives.
- [§3.3 / §4.2 and Section 2] The 'centre' used in the inside-out quenching claim is not the same aperture as the QueStNA central classification. The cQ and QnR stages are defined by WHα patterns within 0.5 Re (K21; Appendix A), and §4.2 discusses quenching within 0.5 Reff. The beam measurements, however, are the APEX 26.3'' FWHM CO aperture, which the authors themselves state corresponds to a median of 1 Re (Section 2). For a typical galaxy, a 1-Re aperture includes a substantial part of the disc, so the beam SFE decrement may be diluted relative to the true central value or may reflect processes at a different radius than the 0.5-Re 'centre' invoked in the abstract. The quantitative inside-out comparison should either use an aperture-matched central definition or explicitly quantify the Re distribution and the fraction of the beam that lies within 0.5 Re for the galaxies in each stage.
- [§3.4 / Table 3 and §4.1] The reported steepening of the SFR-Mmol relation with quenching rests on linmix fits for groups in which non-detections dominate: the nR slope is 2.11 with a fitted range of roughly 1.94-2.32 and the fR slope is 1.58 with a fitted range of roughly 1.47-1.71, but the Spearman coefficients for detections-only samples are 0.49 and 0.43, and the fitted relations are explicitly acknowledged in §4.1 to be possibly driven by upper limits. As the paper says, retired KS laws cannot be established. Since the abstract presents the steepening as one of the main findings, the authors should either soften the claim to 'consistent with, but not conclusive of, steepening' or perform a sensitivity test that fits all stages using a common S/N or Mmol completeness threshold, so that the slope comparison is not confounded by the very different detection fractions across stages.
minor comments (6)
- [Throughout] There are numerous typographical and formatting issues, including 'K21]kalinova2021' (several occurrences), 'e fficient' and 'efficiency' inconsistencies, 'redshit' for 'redshift', and 'Quantities (expect rP and rS)' in the Table 3 notes, which should be 'except'.
- [§3.3 and Fig. 7] The text refers to 'Fig. 7 left and middle panels' but the figure as presented has two panels (global and beam); also the Fig. 7 caption labels the star formation efficiency line as 'SFR, cyan' instead of 'SFE, cyan'.
- [Fig. 1 and Section 2] The APEX beam size is given as 26.2'' in the Fig. 1 caption and 26.3'' in Section 2; these values should be harmonized.
- [Abstract and §4.1] The abstract states that a significant SFE decrease is 'necessary' to retire galaxy centres, while §4.1 explicitly says the retired-stage relations may be driven by upper limits and that retired KS laws cannot be fully established; the abstract should be tempered to match this caveat.
- [§4.3] The sentence claiming that excluding active galaxies allows the authors to 'rule out AGN-driven gas depletion as the primary mechanism for quenching in our sample' is too strong, since BPT-based AGN selection can miss diluted or previously active nuclei; the subsequent qualifying discussion is appropriate, but the strong wording should be revised.
- [Fig. 4] The stacked CO spectra are a valuable non-model-dependent check, but no error bars or quantitative significance tests are provided for the amplitude differences between stages or between active and non-active subsamples; adding these would strengthen the AGN gas-retention point.
Circularity Check
Partial circularity: the sSFR decline is built into the WHα-based stage definitions, and the central central-SFE drop is vulnerable to CO-detection selection in low-detection retired classes.
-
self definitional
[Section 1 (QueStNA definition) and Section 3.2 (sSFR distributions)]
"objects completely retired with WHα < 3 Å everywhere within 2 Re, thus 'fully retired' (fR) ... The trend of the averages is clearly descending across the quenching stages."
The Quenching stages are defined by WHα thresholds, and the SFR maps are derived from Hα. WHα is an Hα equivalent width, i.e., Hα per unit stellar continuum, which is a direct proxy for specific star formation rate. Therefore the monotonic decrease in sSFR from SF to fR is largely a restatement of the classification criteria rather than an independent empirical result. This definitional coupling does not by itself force the SFE trend, because SFE involves the independent CO-based Mmol, but it makes the sSFR part of the paper's evidence partly tautological.
-
other
[Section 3.3 (flaring plots) and Section 4.1 (limitation statement); detection rates in Table 3.1 and Fig. 5]
"To avoid systemic biases introduced by Mmol upper limits, we will use only CO-detected galaxies. ... the retired groups are largely influenced by non-detections (in particular, the fR stage is dominated by them) and the relationships we measured can be driven by upper limits."
The central inside-out SFE-drop conclusion is based on flaring plots computed from CO detections only, while the retired classes have low detection rates (nR 46/79, fR 20/73 in Table 3.1). Since SFE = SFR/Mmol, restricting to detections selects galaxies with the highest Mmol at a given low SFR, mechanically lowering the measured SFE of the retired classes. The paper itself concedes that retired-group relations 'can be driven by upper limits' and that 'retired KS laws' cannot be fully established, so the headline claim that a significant SFE decrease is necessary is not independent of the censoring/detection rule used to estimate it.
full rationale
The paper is not circular in its entirety: the molecular gas mass, molecular-to-stellar mass ratio, and the Mmol-based scaling relations are derived from independent CO observations and are not fixed by the WHα-based QueStNA classification. However, two parts of the argument are coupled to the inputs by construction or by selection. First, the steep decline of sSFR across quenching stages is close to definitional, because the stages are defined by Hα equivalent-width thresholds and sSFR is measured from Hα. Second, the central claim that retired galactic centres require a large SFE decrease relies on flaring plots that use CO detections only; for nR and especially fR, the low detection rate biases the detected subsample toward high Mmol at fixed SFR, which lowers SFE = SFR/Mmol. The paper's own §4.1 acknowledges that the retired-group relations and detections are strongly influenced by upper limits, weakening the independence of the headline conclusion. The self-citations (K21, Colombo et al. 2020/2025, Sánchez et al. 2021) are used for classification, data, and context, but no uniqueness theorem is invoked to force the analysis, so they are not load-bearing in a circular way. Overall score 4 reflects partial definitional/selection coupling in the central interpretive claim while the Mmol-based relations retain substantial independent content.
Assumptions & free parameters
assumptions (6)
- domain assumption Halpha equivalent width thresholds of 3 and 6 Angstrom separate gas ionized by young stars, diffuse processes, and old stellar populations, so QueStNA stages form a meaningful quenching sequence.
- domain assumption CO(2-1) to CO(1-0) conversion follows the R21 relation with SFR surface density from den Brok et al. 2023, and the CO-to-H2 conversion uses the Bolatto et al. 2013 alpha_CO prescription based on metallicity and stellar mass surface density.
- domain assumption SFR derived from Halpha Balmer decrement maps and stellar mass from PIPE3D SSP fits are reliable for all quenching stages.
- domain assumption CO non-detections in the nR and fR groups are correctly modeled as upper limits by linmix, yielding unbiased scaling relation slopes and SFE values.
- domain assumption The 26.3 arcsec APEX beam, corresponding to a median of about 1 Re, measures the galaxy 'centre' relevant to inside-out quenching.
- domain assumption The combined iEDGE sample is representative enough across quenching stages for the median trends and scaling relation comparisons.
Cite this review
Pith. "Pith review of The EDGE-CALIFA survey: Star formation relationships for galaxies at different stages of their evolution." pith.science (2026). https://pith.science/paper/OX62HO5U
@misc{pith2026250706406,
  author       = {Pith},
  title        = {Pith review of: The EDGE-CALIFA survey: Star formation relationships for galaxies at different stages of their evolution},
  year         = {2026},
  howpublished = {\url{https://pith.science/paper/OX62HO5U}},
  note         = {Machine review of arXiv:2507.06406}
}
abstract
Galaxy evolution is largely driven by star formation activity or by the cessation of it, also called star formation quenching. In this paper, we present star formation scaling relations for galaxies at different evolutionary stages. To do so, we used the integrated Extragalactic Database for Galaxy Evolution (iEDGE), which collects CO, optical continuum, and emission line information for 643 galaxies from the CALIFA IFU dataset. By considering the patterns described by star-forming and retired regions, we grouped the galaxies into quenching stages using the emission line classification scheme, QueStNA. We observed that the molecular gas mass ($M_{\rm mol}$) decreases from star-forming to retired systems and so does the molecular-to-stellar mass ratio ($f_{\rm mol}$). In contrast, star formation efficiency (SFE) is constant in the quenching stages dominated by star formation and rapidly declines afterwards. We observed that this rapid decline is more pronounced in the centre of the galaxies compared to the rest of the discs, reflecting the inside-out quenching displayed by nearby galaxies. We noticed that the relations between $M_{\rm mol}$ and the stellar mass ($M_*$) become increasingly shallow with the quenching stages; however, the relations between the star formation rate (SFR) and $M_{\rm mol}$ steepen when going from star-forming to retired systems. We observed that a three-dimensional relation between SFR, $M_*$, and $M_{\rm mol}$ exists for star-forming galaxies, while data points from other quenching groups are scattered across the parameter space. Taken together, these pieces of evidence indicate that the quenching of the galaxies cannot be explained solely by a depletion of the molecular gas and that a significant decrease in the SFE is necessary to retire the centre of the galaxies beyond the star formation green valley.
Figures


Figures from the paper (9 more)


Forward citations
Cited by 2 Pith papers
-
ALMA CO-CAVITY II. Resolved Scaling Relations in Void Galaxies
In void galaxies, the resolved relation between molecular gas and stellar mass is the tightest of the three star-formation scaling relations, with 0.16 dex scatter.
-
Vz-GAL Dusty Star-Forming Galaxies: Revisiting the CO-H2 Conversion Factor Tension
The CO-to-H2 conversion factor in high-z dusty star-forming galaxies is not required to be 0.8; intermediate to near-Galactic values (median ~4-5) remain dynamically viable.
Reference graph
Works this paper leans on
-
[1]
G., Moore, B., & Bower, R
Abadi, M. G., Moore, B., & Bower, R. G. 1999, MNRAS, 308, 947 Astropy Collaboration, Price-Whelan, A. M., Sip˝ocz, B. M., et al. 2018, AJ, 156, 123 Astropy Collaboration, Robitaille, T. P., Tollerud, E. J., et al. 2013, A&A, 558, A33
1999
-
[2]
1992, MNRAS, 259, 345 6 http://www.astropy.org
Athanassoula, E. 1992, MNRAS, 259, 345 6 http://www.astropy.org
1992
-
[3]
M., Maiolino, R., Bluck, A
Baker, W. M., Maiolino, R., Bluck, A. F. L., et al. 2022, MNRAS, 510, 3622
2022
-
[4]
K., Balogh, M
Baldry, I. K., Balogh, M. L., Bower, R. G., et al. 2006, Monthly Notices of the Royal Astronomical Society, 373, 469
2006
-
[5]
A., Phillips, M
Baldwin, J. A., Phillips, M. M., & Terlevich, R. 1981, PASP, 93, 5
1981
-
[6]
L., Navarro, J
Balogh, M. L., Navarro, J. F., & Morris, S. L. 2000, ApJ, 540, 113
2000
-
[7]
K., Cruz-González, I., Colombo, D., et al
Barrera-Ballesteros, J. K., Cruz-González, I., Colombo, D., et al. 2025, ApJ, 978, 23
2025
-
[8]
K., Heckman, T., Sánchez, S
Barrera-Ballesteros, J. K., Heckman, T., Sánchez, S. F., et al. 2021, ApJ, 909, 131
2021
Show all 134 references
-
[9]
K., Utomo, D., Bolatto, A
Barrera-Ballesteros, J. K., Utomo, D., Bolatto, A. D., et al. 2020, MNRAS, 492, 2651
2020
-
[10]
2025, A&A, in press
Bazzi, Z., Colombo, D., & Bigiel, F. 2025, A&A, in press
2025
-
[11]
W., Ellison, S
Bickley, R. W., Ellison, S. L., Salvato, M., et al. 2024, MNRAS, 533, 3068
2024
-
[12]
& Teyssier, R
Biernacki, P. & Teyssier, R. 2018, MNRAS, 475, 5688
2018
-
[13]
2008, AJ, 136, 2846
Bigiel, F., Leroy, A., Walter, F., et al. 2008, AJ, 136, 2846
2008
-
[14]
& Tremaine, S
Binney, J. & Tremaine, S. 1987, Galactic dynamics
1987
-
[15]
& Dekel, A
Birnboim, Y . & Dekel, A. 2003, MNRAS, 345, 349
2003
-
[16]
Bluck, A. F. L., Bottrell, C., Teimoorinia, H., et al. 2019, MNRAS, 485, 666
2019
-
[17]
Bluck, A. F. L., Mendel, J. T., Ellison, S. L., et al. 2014, MNRAS, 441, 599
2014
-
[18]
Bluck, A. F. L., Piotrowska, J. M., & Maiolino, R. 2023, ApJ, 944, 108
2023
-
[19]
D., Wolfire, M., & Leroy, A
Bolatto, A. D., Wolfire, M., & Leroy, A. K. 2013, ARA&A, 51, 207
2013
-
[20]
D., Wong, T., Utomo, D., et al
Bolatto, A. D., Wong, T., Utomo, D., et al. 2017, ApJ, 846, 159
2017
-
[21]
Brinchmann, J., Charlot, S., White, S. D. M., et al. 2004, MNRAS, 351, 1151 Cano-Díaz, M., Sánchez, S. F., Zibetti, S., et al. 2016, ApJ, 821, L26
2004
-
[22]
L., et al
Cheung, E., Athanassoula, E., Masters, K. L., et al. 2013, The Astrophysical Journal, 779, 162
2013
-
[23]
Chevance, M., Kruijssen, J. M. D., Hygate, A. P. S., et al. 2020, MNRAS, 493, 2872
2020
-
[24]
2021, MNRAS, 500, 1261 Cid Fernandes, R., Stasi´nska, G., Schlickmann, M
Chown, R., Li, C., Parker, L., et al. 2021, MNRAS, 500, 1261 Cid Fernandes, R., Stasi´nska, G., Schlickmann, M. S., et al. 2010, MNRAS, 403, 1036
2021
-
[25]
2018, A&A, 620, A21
Colling, C., Hennebelle, P., Geen, S., Iffrig, O., & Bournaud, F. 2018, A&A, 620, A21
2018
-
[26]
2014, ApJ, 784, 3
Colombo, D., Hughes, A., Schinnerer, E., et al. 2014, ApJ, 784, 3
2014
-
[27]
2025, A&A, submitted
Colombo, D., Kalinova, V ., & Bazzi, Z. 2025, A&A, submitted
2025
-
[28]
2018, MNRAS, 475, 1791
Colombo, D., Kalinova, V ., Utomo, D., et al. 2018, MNRAS, 475, 1791
2018
-
[29]
F., Bolatto, A
Colombo, D., Sanchez, S. F., Bolatto, A. D., et al. 2020, A&A, 644, A97
2020
-
[30]
2007, ApJ, 670, 156
Daddi, E., Dickinson, M., Morrison, G., et al. 2007, ApJ, 670, 156
2007
-
[31]
A., Young, L
Davis, T. A., Young, L. M., Crocker, A. F., et al. 2014, MNRAS, 444, 3427 de Vaucouleurs, G. 1959, Handbuch der Physik, 53, 275 den Brok, J. S., Bigiel, F., Sliwa, K., et al. 2022, A&A, 662, A89 den Brok, J. S., Leroy, A. K., Usero, A., et al. 2023, MNRAS, 526, 6347
2014
-
[32]
2019, MNRAS, 488, 1926
Dey, B., Rosolowsky, E., Cao, Y ., et al. 2019, MNRAS, 488, 1926
2019
-
[33]
& Baba, J
Dobbs, C. & Baba, J. 2014, PASA, 31, e035
2014
-
[34]
S., et al
Duarte-Cabral, A., Colombo, D., Urquhart, J. S., et al. 2021, MNRAS, 500, 3027
2021
-
[35]
2016, MNRAS, 463, 3948
Dubois, Y ., Peirani, S., Pichon, C., et al. 2016, MNRAS, 463, 3948
2016
-
[36]
L., Lin, L., Thorp, M
Ellison, S. L., Lin, L., Thorp, M. D., et al. 2021, MNRAS, 502, L6
2021
-
[37]
L., Pan, H.-A., Bluck, A
Ellison, S. L., Pan, H.-A., Bluck, A. F. L., et al. 2024, MNRAS, 527, 10201
2024
-
[38]
L., Thorp, M
Ellison, S. L., Thorp, M. D., Lin, L., et al. 2020, MNRAS, 493, L39
2020
-
[39]
2020, MNRAS, 493, 4107
Enia, A., Rodighiero, G., Morselli, L., et al. 2020, MNRAS, 493, 4107
2020
-
[40]
M., Willmer, C
Faber, S. M., Willmer, C. N. A., Wolf, C., et al. 2007, ApJ, 665, 265
2007
-
[41]
Fabian, A. C. 2012, ARA&A, 50, 455
2012
-
[42]
& Franceschini, A
Fasano, G. & Franceschini, A. 1987, MNRAS, 225, 155
1987
-
[43]
& Peebles, P
Fukugita, M. & Peebles, P. J. E. 2004, ApJ, 616, 643
2004
-
[44]
& Solomon, P
Gao, Y . & Solomon, P. M. 2004, ApJ, 606, 271
2004
-
[45]
2019, ApJ, 887, 172
Gao, Y ., Xiao, T., Li, C., et al. 2019, ApJ, 887, 172
2019
-
[46]
K., Colombo, D., et al
Garay-Solis, Y ., Barrera-Ballesteros, J. K., Colombo, D., et al. 2023, ApJ, 952, 122
2023
-
[47]
& Kruijssen, J
Gensior, J. & Kruijssen, J. M. D. 2021, MNRAS, 500, 2000
2021
-
[48]
Gensior, J., Kruijssen, J. M. D., & Keller, B. W. 2020, MNRAS, 495, 199
2020
-
[49]
J., Lutz, D., et al
Genzel, R., Tacconi, L. J., Lutz, D., et al. 2015, ApJ, 800, 20 González Delgado, R. M., Cid Fernandes, R., Pérez, E., et al. 2016, A&A, 590, A44
2015
-
[50]
H., Bluck, A
Goubert, P. H., Bluck, A. F. L., Piotrowska, J. M., & Maiolino, R. 2024, MNRAS, 528, 4891
2024
-
[51]
Gunn, J. E. & Gott, J. Richard, I. 1972, ApJ, 176, 1
1972
-
[52]
H., Corbelli, E., Schneider, S
Heyer, M. H., Corbelli, E., Schneider, S. E., & Young, J. S. 2004, ApJ, 602, 723
2004
-
[53]
M., Saintonge, A., Davis, T
Hogarth, L. M., Saintonge, A., Davis, T. A., et al. 2024, MNRAS, 528, 6768
2024
-
[54]
C., Lin, L., Lin, J
Hsieh, B. C., Lin, L., Lin, J. H., et al. 2017, ApJ, 851, L24
2017
-
[55]
Hubble, E. P. 1936, Realm of the Nebulae
1936
-
[56]
Hunter, J. D. 2007, Computing in Science & Engineering, 9, 90
2007
-
[57]
& Harrison, C
Husemann, B. & Harrison, C. M. 2018, Nature Astronomy, 2, 196
2018
-
[58]
F., et al
Kalinova, V ., Colombo, D., Sánchez, S. F., et al. 2021, A&A, 648, A64
2021
-
[59]
F., et al
Kalinova, V ., Colombo, D., Sánchez, S. F., et al. 2022, A&A, 665, A90
2022
-
[60]
M., White, S
Kauffmann, G., Heckman, T. M., White, S. D. M., et al. 2003, MNRAS, 341, 33
2003
-
[61]
Kelly, B. C. 2007, ApJ, 665, 1489
2007
-
[62]
Kennicutt, Jr., R. C. 1998, ApJ, 498, 541
1998
-
[63]
2018, A&A, 609, A60
Khoperskov, S., Di Matteo, P., Haywood, M., et al. 2018, A&A, 609, A60
2018
-
[64]
Kim, J., Chevance, M., Kruijssen, J. M. D., et al. 2021, MNRAS, 504, 487 Article number, page 19 of 21 A&A proofs: manuscript no. aa53217-24_arxiv
2021
-
[65]
J., Strittmatter, B., Lamperti, I., et al
Koss, M. J., Strittmatter, B., Lamperti, I., et al. 2021, ApJS, 252, 29
2021
-
[66]
Kreckel, K., Faesi, C., Kruijssen, J. M. D., et al. 2018, ApJ, 863, L21
2018
-
[67]
Kruijssen, J. M. D. & Longmore, S. N. 2014, MNRAS, 439, 3239
2014
-
[68]
Kruijssen, J. M. D., Schruba, A., Hygate, A. P. S., et al. 2018, MNRAS, 479, 1866
2018
-
[69]
Krumholz, M. R. & Kruijssen, J. M. D. 2015, MNRAS, 453, 739
2015
-
[70]
Lacerda, E. A. D., Cid Fernandes, R., Couto, G. S., et al. 2018, MNRAS, 474, 3727
2018
-
[71]
Lacerda, E. A. D., Sánchez, S. F., Cid Fernandes, R., et al. 2020, MNRAS, 492, 3073
2020
-
[72]
B., Tinsley, B
Larson, R. B., Tinsley, B. M., & Caldwell, C. N. 1980, ApJ, 237, 692
1980
-
[73]
S., Ting, Y .-S., et al
Leja, J., Speagle, J. S., Ting, Y .-S., et al. 2022, ApJ, 936, 165
2022
-
[74]
D., Simon, J
Leroy, A., Bolatto, A. D., Simon, J. D., & Blitz, L. 2005, ApJ, 625, 763
2005
-
[75]
K., Hughes, A., Schruba, A., et al
Leroy, A. K., Hughes, A., Schruba, A., et al. 2016, ApJ, 831, 16
2016
-
[76]
K., Schinnerer, E., Hughes, A., et al
Leroy, A. K., Schinnerer, E., Hughes, A., et al. 2021, ApJS, 257, 43
2021
-
[77]
K., Usero, A., Schruba, A., et al
Leroy, A. K., Usero, A., Schruba, A., et al. 2017, ApJ, 835, 217
2017
-
[78]
K., Walter, F., Brinks, E., et al
Leroy, A. K., Walter, F., Brinks, E., et al. 2008, AJ, 136, 2782
2008
-
[79]
K., Walter, F., Sandstrom, K., et al
Leroy, A. K., Walter, F., Sandstrom, K., et al. 2013, AJ, 146, 19
2013
-
[80]
K., Schinnerer, E., Liu, D., et al
Leslie, S. K., Schinnerer, E., Liu, D., et al. 2020, ApJ, 899, 58
2020
-
[81]
2017, ApJ, 851, 18
Lin, L., Belfiore, F., Pan, H.-A., et al. 2017, ApJ, 851, 18
2017
-
[82]
L., Pan, H.-A., et al
Lin, L., Ellison, S. L., Pan, H.-A., et al. 2022, ApJ, 926, 175
2022
-
[83]
L., et al
Lin, L., Pan, H.-A., Ellison, S. L., et al. 2019, ApJ, 884, L33
2019
-
[84]
2009, ApJ, 707, 250
Martig, M., Bournaud, F., Teyssier, R., & Dekel, A. 2009, ApJ, 707, 250
2009
-
[85]
L., Nichol, R
Masters, K. L., Nichol, R. C., Bamford, S. P., et al. 2010, Monthly Notices of the Royal Astronomical Society, 405, 783
2010
-
[86]
L., Nichol, R
Masters, K. L., Nichol, R. C., Hoyle, B., et al. 2012, Monthly Notices of the Royal Astronomical Society, 424, 2180
2012
-
[87]
E., Leroy, A
Meidt, S. E., Leroy, A. K., Rosolowsky, E., et al. 2018, ApJ, 854, 100
2018
-
[88]
E., Schinnerer, E., García-Burillo, S., et al
Meidt, S. E., Schinnerer, E., García-Burillo, S., et al. 2013, ApJ, 779, 45
2013
-
[89]
2020, MNRAS, 496, 4606
Morselli, L., Rodighiero, G., Enia, A., et al. 2020, MNRAS, 496, 4606
2020
-
[90]
2019, PASJ, 71, S15
Muraoka, K., Sorai, K., Miyamoto, Y ., et al. 2019, PASJ, 71, S15
2019
-
[91]
2002, A&A, 385, 412
Murgia, M., Crapsi, A., Moscadelli, L., & Gregorini, L. 2002, A&A, 385, 412
2002
-
[92]
F., Guainazzi, M., & Cruz- González, I
Osorio-Clavijo, N., Gonzalez-Martín, O., Sánchez, S. F., Guainazzi, M., & Cruz- González, I. 2023, MNRAS, 522, 5788
2023
-
[93]
C., McKee, C
Ostriker, E. C., McKee, C. F., & Leroy, A. K. 2010, ApJ, 721, 975
2010
-
[94]
L., et al
Pan, H.-A., Lin, L., Ellison, S. L., et al. 2024, arXiv e-prints, arXiv:2402.07400
2024 arXiv
-
[95]
2015, Nature, 521, 192
Peng, Y ., Maiolino, R., & Cochrane, R. 2015, Nature, 521, 192
2015
-
[96]
J., Kovaˇc, K., et al
Peng, Y .-j., Lilly, S. J., Kovaˇc, K., et al. 2010, ApJ, 721, 193
2010
-
[97]
2021, A&A, 650, A134
Pessa, I., Schinnerer, E., Belfiore, F., et al. 2021, A&A, 650, A134
2021
-
[98]
K., et al
Pessa, I., Schinnerer, E., Leroy, A. K., et al. 2022, A&A, 663, A61
2022
-
[99]
& Pagel, B
Pettini, M. & Pagel, B. E. J. 2004, MNRAS, 348, L59
2004
-
[100]
M., Bluck, A
Piotrowska, J. M., Bluck, A. F. L., Maiolino, R., Concas, A., & Peng, Y . 2020, MNRAS, 492, L6
2020
-
[101]
M., Bluck, A
Piotrowska, J. M., Bluck, A. F. L., Maiolino, R., & Peng, Y . 2022, MNRAS, 512, 1052
2022
-
[102]
2021, A&A, 656, A133
Querejeta, M., Schinnerer, E., Meidt, S., et al. 2021, A&A, 656, A133
2021
-
[103]
& Peng, Y .-j
Renzini, A. & Peng, Y .-j. 2015, ApJ, 801, L29
2015
-
[104]
Rownd, B. K. & Young, J. S. 1999, AJ, 118, 670
1999
-
[105]
2016, MNRAS, 462, 1749
Saintonge, A., Catinella, B., Cortese, L., et al. 2016, MNRAS, 462, 1749
2016
-
[106]
J., et al
Saintonge, A., Catinella, B., Tacconi, L. J., et al. 2017, ApJS, 233, 22
2017
-
[107]
Sanchez, S. F. 2019, arXiv e-prints, arXiv:1911.06925 Sánchez, S. F. 2020, ARA&A, 58, annurev Sánchez, S. F., Avila-Reese, V ., Hernandez-Toledo, H., et al. 2018, Rev. Mexi- cana Astron. Astrofis., 54, 217 Sánchez, S. F., Barrera-Ballesteros, J. K., Colombo, D., et al. 2021, M...
2019 arXiv
-
[108]
C., Schawinski, K., et al
Sarzi, M., Shields, J. C., Schawinski, K., et al. 2010, MNRAS, 402, 2187
2010
-
[109]
2024, A&A, 687, A255
Scaloni, L., Rodighiero, G., Enia, A., et al. 2024, A&A, 687, A255
2024
-
[110]
2019, ApJ, 887, 49
Schinnerer, E., Hughes, A., Leroy, A., et al. 2019, ApJ, 887, 49
2019
-
[111]
1959, ApJ, 129, 243
Schmidt, M. 1959, ApJ, 129, 243
1959
-
[112]
K., Walter, F., et al
Schruba, A., Leroy, A. K., Walter, F., et al. 2011, AJ, 142, 37
2011
-
[113]
2013, A&A, 558, A43
Singh, R., van de Ven, G., Jahnke, K., et al. 2013, A&A, 558, A43
2013
-
[114]
M., Downes, D., Radford, S
Solomon, P. M., Downes, D., Radford, S. J. E., & Barrett, J. W. 1997, ApJ, 478, 144
1997
-
[115]
2017, Monthly Notices of the Royal Astronomical Society, 465, 3729
Spinoso, D., Bonoli, S., Dotti, M., et al. 2017, Monthly Notices of the Royal Astronomical Society, 465, 3729
2017
-
[116]
K., Ostriker, E
Sun, J., Leroy, A. K., Ostriker, E. C., et al. 2023, ApJ, 945, L19
2023
-
[117]
K., Schruba, A., et al
Sun, J., Leroy, A. K., Schruba, A., et al. 2018, ApJ, 860, 172
2018
-
[118]
J., Genzel, R., Saintonge, A., et al
Tacconi, L. J., Genzel, R., Saintonge, A., et al. 2018, ApJ, 853, 179
2018
-
[119]
A., Bell, E
Terrazas, B. A., Bell, E. F., Pillepich, A., et al. 2020, MNRAS, 493, 1888
2020
-
[120]
D., Ellison, S
Thorp, M. D., Ellison, S. L., Pan, H.-A., et al. 2022, MNRAS, 516, 1462
2022
-
[121]
Tielens, A. G. G. M. 2005, The Physics and Chemistry of the Interstellar Medium
2005
-
[122]
D., Wong, T., et al
Utomo, D., Bolatto, A. D., Wong, T., et al. 2017, ApJ, 849, 26
2017
-
[123]
D., V ogel, S
Villanueva, V ., Bolatto, A. D., V ogel, S. N., et al. 2024, ApJ, 962, 88
2024
-
[124]
E., et al
Virtanen, P., Gommers, R., Oliphant, T. E., et al. 2020, Nature Methods, 17, 261
2020
-
[125]
2017, MNRAS, 465, 3291
Weinberger, R., Springel, V ., Hernquist, L., et al. 2017, MNRAS, 465, 3291
2017
-
[126]
M., van den Bosch, F
Weinmann, S. M., van den Bosch, F. C., Yang, X., & Mo, H. J. 2006, Monthly Notices of the Royal Astronomical Society, 366, 2
2006
-
[127]
R., Churazov, E., & Scannapieco, E
Werner, N., McNamara, B. R., Churazov, E., & Scannapieco, E. 2019, Space Sci. Rev., 215, 5
2019
-
[128]
& Blitz, L
Wong, T. & Blitz, L. 2002, ApJ, 569, 157
2002
-
[129]
2024, ApJS, 271, 35
Wong, T., Cao, Y ., Luo, Y ., et al. 2024, ApJS, 271, 35
2024
-
[130]
D., et al
Wong, T., Xue, R., Bolatto, A. D., et al. 2013, ApJ, 777, L4
2013
-
[131]
2013, The Astrophysical Journal, 772, 49
Woo, J.-H., Schulze, A., Park, D., et al. 2013, The Astrophysical Journal, 772, 49
2013
-
[132]
2022, MNRAS, 510, 3119
Wylezalek, D., Cicone, C., Belfiore, F., et al. 2022, MNRAS, 510, 3119
2022
-
[133]
N., et al
Zakardjian, A., Pety, J., Herrera, C. N., et al. 2023, A&A, 678, A171
2023
-
[134]
U”. If only one dia- gram shows the presence of an AGN, the galaxy is classified as nonA, with a quality flag set to “U
Zinger, E., Pillepich, A., Nelson, D., et al. 2020, MNRAS, 499, 768 Article number, page 20 of 21 D. Colombo, V . Kalinova, S. Sanchez et al.: Star formation relationships at different galaxy evolution stages Appendix A: Automatic QueStNA classification Following the prescript...
2020
Reviewed August 6, 2026 · model on record in the stance chip above.
Discussion (0). Sign in to comment.