REVIEW 4 major objections 6 minor 54 references
Influence of river incision on landslides triggered in Nepal by the Gorkha earthquake: Results from a pixel-based susceptibility model using inlabru
T0 review · 4 major / 6 minor · reviewed 2026-08-06 · deepseek-v4-flash
Pith's one-line read Elevated river-channel steepness is strongly tied to where the 2015 Gorkha earthquake triggered landslides, but not to how large those landslides were.
desk verdict The ksn-location association is plausible but not identified: the covariate-only design omits spatial random effects and standard DEM covariates, and the paper's own Section 4.3.4 admits the consequence. read the letter →
The pith
A machine-rendered reading of the paper's core claim, the machinery that carries it, and where it could break.
The reading
What carries the argument
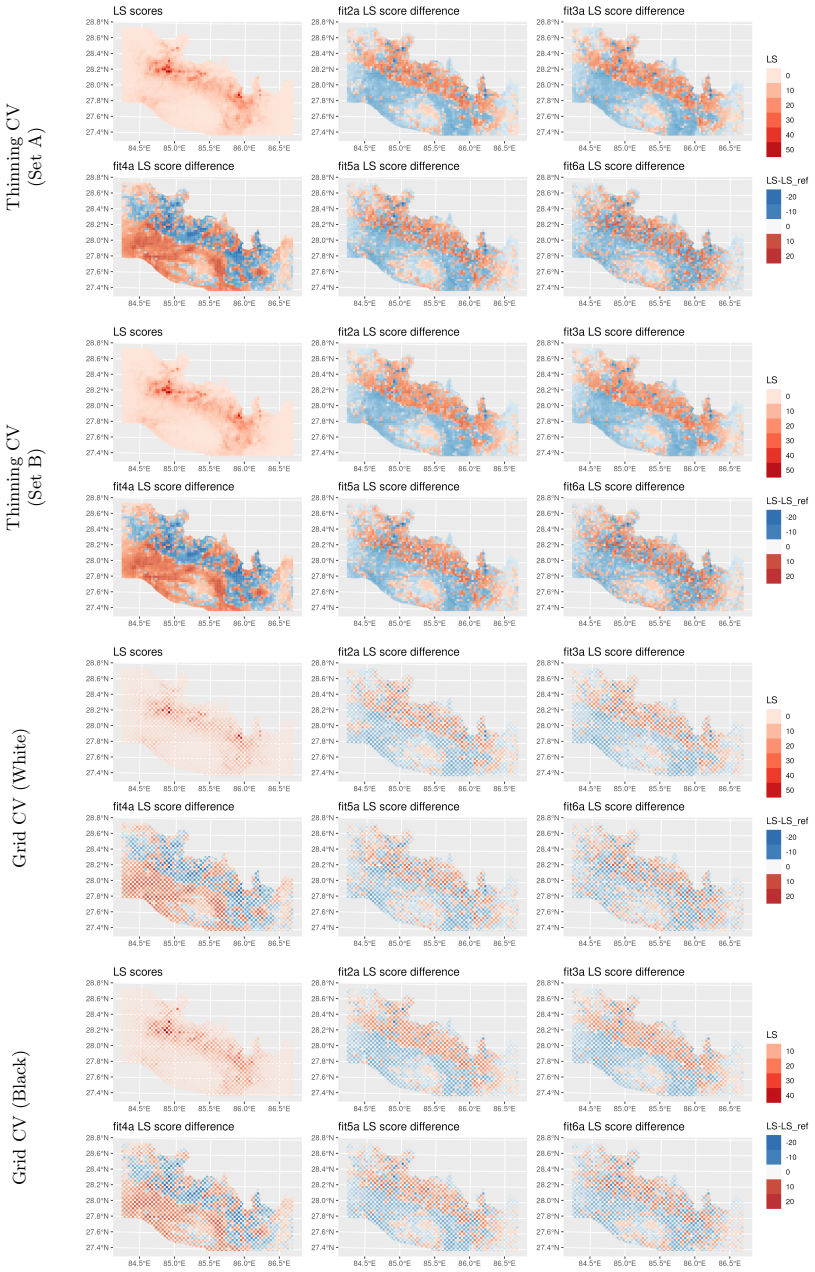
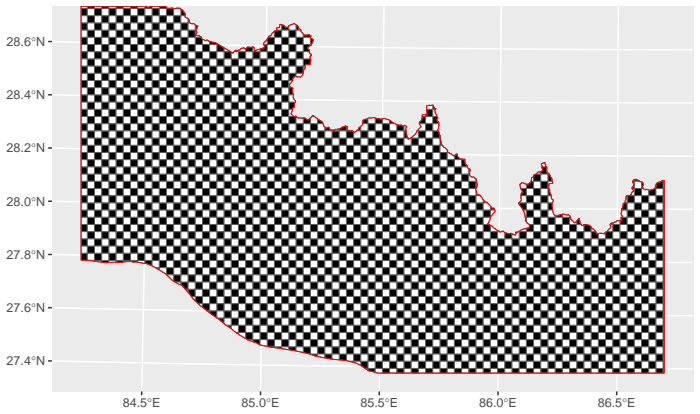
The load-bearing object is the normalized channel steepness index $k_{sn}$, derived from the stream-power incision law $S = k_{sn} A^{-\theta}$, which expresses local channel slope as a function of drainage area and thereby isolates the steepness that reflects erosion and incision processes. Around it the paper assembles: (i) a Poisson point process for landslide centroids with intensity modelled in log space; (ii) a Gaussian model for log-transformed landslide area; (iii) DEM-derived distance metrics (relief and flow distance to channel) computed with LSDTopoTools; and (iv) inlabru's mesh-based disaggregation, which resolves spatial misalignment between raster covariates and point observations by projecting both onto a common triangular mesh. The deliberate exclusion of spatially structured random effects (Matérn SPDE fields) is itself part of the machinery: the authors argue that including such fields would inflate posterior uncertainty, bias fixed effects through spatial confounding, and undermine the stated goal of transferring fitted covariate relationships to unseen regions. Model comparison runs on four cross-validation splits (two random thinnings and two 3 km by 3 km checkerboard grids) scored with strictly proper scoring rules, primarily the logarithmic score and the continuous ranked probability score.
What would settle it
Re-run the best-fitting model with $k_{sn}$ recomputed at concavities 0.4 and 0.6 and without the manual hanging-valley substitutions; if the $k_{sn}$ credible interval shifts to include zero or flips sign under any of these recomputations, the claimed link between channel steepness and landslide susceptibility is not robust. As a second check, apply the fitted covariate-only model to a different earthquake's landslide inventory and compare its out-of-region predictive scores with those of a version that includes an explicit spatial random field: if the spatial-field version wins out-of-region, the transferability premise fails.
Extended reading notes
Core claim
The paper's central claim is that the normalized channel steepness index $k_{sn}$ — the steepness of a river channel normalized by drainage area under a stream-power incision law with concavity fixed at 0.5 — carries a strong and distinct signal for where earthquake-induced landslides initiate, and no signal for how large they become. In a six-model comparison for the Gorkha earthquake, the centroid model (fit6a) combining a smoothed $k_{sn}$ effect, peak ground acceleration, an exponentially decaying flow-distance-to-channel term, land cover, and geology scores best under strictly proper scoring rules (CRPS and RMSE), and the posterior shows elevated $k_{sn}$ clearly increasing susceptibility above roughly $\log k_{sn} = 2.5$, with a flattening plateau at the steepest end. For landslide magnitude, models with $k_{sn}$ are outperformed by fit6b, which uses flow distance to the channel: the longer the flow path to the channel, the larger the landslide. The paper interprets this as $k_{sn}$ modulating triggering probability while flow distance governs failure volume, and it frames the whole approach — pixel-based covariates instead of slope-unit aggregation, and no spatial random field — as a deliberately transferable alternative to existing INLA-based landslide models built on slope-unit polygons.
Load-bearing premise
The model's transferability premise is that its five covariates — PGA, $k_{sn}$, flow distance to channel, land cover, and geology — leave no spatially structured control unmodelled, so dropping the spatial random field cannot bias the covariate effects; that premise is tested only by a checkerboard split inside the Gorkha region rather than against an external region, and it also depends on the manually substituted $k_{sn}$ values in glacial hanging valleys being accurate.
Editorial extensions
If this is right
- Earthquake response susceptibility maps can be produced from DEM and shaking data alone: channel steepness does the geomorphic work that slope-unit geometry previously did, so no per-region parameterization of slope units is needed.
- Hazard assessments should separate location from magnitude, because where landslides start is governed by fluvial incision intensity ($k_{sn}$) while how large they grow tracks flow distance to the channel.
- The covariate-only design means the fitted relationships can in principle be retrained for any mountain region with a DEM, a channel network, a land-cover map, and a PGA raster, without waiting for a new landslide inventory.
- Traditional DEM covariates that are nonlinear and mutually correlated (slope, elevation, curvature) can be replaced by a smaller set of process-based metrics such as $k_{sn}$ and flow distance, simplifying models and improving interpretability.
- Per-grid-cell strictly proper scoring rules expose where a model fails locally, such as monsoon-preconditioned slopes, a diagnostic that aggregated mean scores like WAIC or DIC would conceal.
Reading between the lines
- Editorial inference: the decoupling of initiation control ($k_{sn}$) from size control (flow distance) points to two distinct physical mechanisms — fluvial incision setting a triggering threshold on adjacent hillslopes, while runout and contributing flow path set volume — which implies that risk planning needs two separate map products, occurrence probability and expected size.
- Editorial inference: the paper validates transferability only inside the Gorkha region; the natural next test is to refit on one earthquake and score on another (for example, a different large mountain earthquake with a mapped inventory), which would directly quantify how much of the covariate relationship is universal rather than regional.
- Editorial inference: the unexplained bump in the smoothed PGA effect near 0.42 g is the paper's own hint that residual spatial structure may have leaked into the covariate curves; re-running with an orthogonalized spatial effect would test whether the $k_{sn}$ coefficient is inflated by unmeasured spatial processes.
- Editorial inference: because the response uses landslide centroids rather than crowns or full polygons, the $k_{sn}$–susceptibility association could partly reflect where centroids fall inside mapped polygons; re-estimating with crown-based points would check whether the association is an artifact of centroid placement.
Signed reviews
Editorial analysis
A structured set of objections, weighed in public.
Referee Report
Summary. Suen et al. present a pixel-based Bayesian spatial model for earthquake-induced landslides triggered by the 2015 Gorkha earthquake in Nepal. Landslide centroids are modelled as a Poisson point process and log-transformed landslide areas as a Gaussian mark, with fixed covariates including peak ground acceleration (PGA), the normalised channel steepness index (k_sn), relief and flow distance to channels, land cover, and geology. The models are fitted with the inlabru framework to handle spatial misalignment between raster covariates and point observations. The authors deliberately omit spatial random effects to favour transferability, compare six model pairs via proper scoring rules under thinning and grid-based cross-validation, and conclude that elevated k_sn is strongly associated with increased landslide susceptibility but not with landslide magnitude. They also include a concavity sensitivity analysis and uncertainty maps for the best-fitting models.
Significance. The paper's strengths are methodological: it applies strictly proper scoring rules (LS and CRPS) with both thinning and grid-based cross-validation, uses inlabru for coherent mesh-based disaggregation of misaligned data, and is transparent about many limitations. If the k_sn association is real, the framework would be a useful, transferable alternative to slope-unit-based INLA landslide models, and the distinction between controls on landslide location and size would be a valuable geomorphic finding. However, the central claim is not yet fully identified: the covariate-only model omits standard DEM covariates that are correlated with k_sn because both are derived from the same DEM, the size-model conclusion is based on removing k_sn from the final model rather than testing it directly, and the manual k_sn filling in hanging valleys is not subjected to sensitivity analysis. These issues are fixable and do not undermine the value of the modelling framework itself.
major comments (4)
- [Section 3.3, Eq. (3) and Section 4.3.4] The linear predictor in Eq. (3) contains only fixed covariates, and Section 4.3.4 explicitly acknowledges that without a spatial random field, spatially structured variability may be absorbed by covariates and produce spurious or overfitted patterns. This is a direct threat to the central k_sn claim because k_sn is derived from the same DEM as slope, aspect, curvature, TWI, and distance to streams (Section 2.2.1, Table 1), and the positive rw2(log k_sn) effect in Figure 13a may be an artefact of an omitted topographic control. The grid-based cross-validation in Section 3.4 cannot detect this bias, since a spatially structured omitted variable would still improve within-region interpolation. Please add a robustness model that includes standard DEM covariates or a spatial random effect, or validate on an external holdout region, and report how the k_sn effect changes.
- [Section 3.3, Table 3 and Table 6] The claim that k_sn is not associated with landslide size is not directly tested. In Section 3.3, k_sn is removed from fit5b and fit6b because 'initial findings indicated that its inclusion did not enhance predictive performance for landslide size', but no model is reported that includes k_sn together with Fd2Ch or Rf2Ch, and the score differences among size models in Table 6 are very small (for example, LS 2.4616 vs 2.4620 for fit6b vs fit5b in Thinning Set A). The second half of the abstract therefore needs a direct comparison, ideally with posterior intervals for the k_sn coefficient in a size model that also includes the distance-to-channel covariate.
- [Section 2.2.2 and Appendix B.1] The manual replacement of k_sn values in hanging valleys with values from nearby geomorphologically similar regions is a subjective step without sensitivity analysis. Section 2.2.2 itself states that the standard algorithm systematically misestimates local k_sn in these areas, so the estimated rw2(log k_sn) effect in Figure 13a could depend on the filling rule. Please report a sensitivity analysis (for example, excluding glacial pixels, varying the substitution neighbourhood, or treating k_sn as missing in those areas) to show that the association is not an artefact of the manual filling.
- [Section 2.3] The exclusion of the Siwalik Group, Gangetic Plain, and Sub-Himalayan regions (Section 2.3) is justified by numerical stability, but it restricts the study domain to the high-relief Himalaya. The paper's transferability claim (Section 3.3 and Abstract) should therefore be qualified as applying to similar mountain terrain, and a sensitivity test of the exclusion boundary would help establish how much the results depend on this subjective choice.
minor comments (6)
- [Table 3] The row entries for fit5b and fit6b are ambiguous; please clarify which covariates enter each model, in particular whether PGA is included in the size models.
- [Section 3.4.1] The squared error (SE) is proper but not strictly proper; the text should avoid presenting SE and DS as equally principled as the strictly proper LS and CRPS rules.
- [Table 6] The reported LS differences between fit6b and fit5b are extremely small; add Monte Carlo standard errors or a formal comparison to support the claim that fit6b is clearly the best size model.
- [Section 2.2.3] The statement that aftershock PGA 'did not improve the results' is unsupported; please provide a summary of the comparison or a reference to an appendix containing the numbers.
- [Section 4.1.2 and Appendix D.2] The concavity sensitivity analysis is described only qualitatively; report a quantitative summary (for example, correlations between k_sn maps for different concavity values) to substantiate the claim that the results are unchanged.
- [Minor language issues] The text refers to 'Appendix 20' where 'Appendix D.2' is intended, and the reference to 'Gorhka' should read 'Gorkha'; please proofread the bibliography and cross-references.
Circularity Check
No significant circularity: the central ksn–landslide association is estimated from a DEM-derived covariate rather than defined from the response, and model comparisons are checked by cross-validation.
full rationale
The paper's central claim—that elevated ksn is associated with landslide susceptibility but not magnitude—is not circular. ksn is computed from the Copernicus DEM via LSDTopoTools (Section 2.2.1), not from the landslide inventory, so the covariate is not defined in terms of the response. The susceptibility and size models are estimated from the observed centroid and log-area data, and the no-association-with-size conclusion is supported by cross-validated score comparisons of models with and without ksn (Tables 5-6), not by construction. The 'preliminary analyses' in Section 3.3 that guided transformations and removed ksn from the size models are in-sample model-selection steps, which could inflate apparent effects, but they do not reduce the claim to a definition; the grid and thinning CV provide an independent check. Self-citations to inlabru (Lindgren et al., 2024) and Suen et al. (2025) are software and methodological citations; the one load-bearing technical detail (mesh resolution based on Suen et al., 2025) is a numerical simulation result and not a self-referential uniqueness claim. The acknowledged limitation in Section 4.3.4 that omitted spatial random effects may allow spatially structured variability to be absorbed by covariates is a confounding/identifiability concern, not circularity. No specific equation or fitted parameter can be exhibited that makes a predicted quantity equal to its input by construction.
Assumptions & free parameters
free parameters (2)
- Concavity index theta =
0.5
- ksn hanging valley substitution rule =
not quantitative
assumptions (5)
- domain assumption Stream power law and steady-state landscape assumption for ksn (Eq. 1)
- domain assumption Landslide centroids follow a Poisson point process with intensity lambda
- domain assumption The inventory is spatially unbiased and complete enough for centroid analysis
- domain assumption DEM topography is independent of the landslides (pre-event DEM)
- domain assumption PGA from the mainshock is the relevant seismic trigger
Cite this review
Pith. "Pith review of Influence of river incision on landslides triggered in Nepal by the Gorkha earthquake: Results from a pixel-based susceptibility model using inlabru." pith.science (2026). https://pith.science/paper/HD5WB2WU
@misc{pith2026250708742,
  author       = {Pith},
  title        = {Pith review of: Influence of river incision on landslides triggered in Nepal by the Gorkha earthquake: Results from a pixel-based susceptibility model using inlabru},
  year         = {2026},
  howpublished = {\url{https://pith.science/paper/HD5WB2WU}},
  note         = {Machine review of arXiv:2507.08742}
}
abstract
This study presents a comprehensive framework for modelling earthquake-induced landslides (EQILs) through a channel-based analysis of landslide centroid distributions. A key innovation is the incorporation of the normalised channel steepness index ($k_{sn}$) as a physically meaningful and novel covariate, inferring hillslope erosion and fluvial incision processes. Used within spatial point process models, $k_{sn}$ supports the generation of landslide susceptibility maps with quantified uncertainty. To address spatial data misalignment between covariates and landslide observations, we leverage the inlabru framework, which enables coherent integration through mesh-based disaggregation, thereby overcoming challenges associated with spatially misaligned data integration. Our modelling strategy explicitly prioritises prospective transferability to unseen geographical regions, provided that explanatory variable data are available. By modelling both landslide locations and sizes, we find that elevated $k_{sn}$ is strongly associated with increased landslide susceptibility but not with landslide magnitude. The best-fitting Bayesian model, validated through cross-validation, offers a scalable and interpretable solution for predicting earthquake-induced landslides in complex terrain.
Figures


Figures from the paper (18 more)






Reference graph
Works this paper leans on
-
[1]
T., Lenzi, A., Liu, Z., Mart \' nez-Minaya, J., and Rue, H
Adin, A., Krainski, E. T., Lenzi, A., Liu, Z., Mart \' nez-Minaya, J., and Rue, H. (2024). Automatic cross-validation in structured models: Is it time to leave out leave-one-out? Spatial Statistics , 62:100843
work page 2024
-
[2]
Alvioli, M., Guzzetti, F., and Marchesini, I. (2020). Parameter-free delineation of slope units and terrain subdivision of Italy . Geomorphology , 358:107124
work page 2020
-
[3]
Alvioli, M., Marchesini, I., Reichenbach, P., Rossi, M., Ardizzone, F., Fiorucci, F., and Guzzetti, F. (2016). Automatic delineation of geomorphological slope units with r.slopeunits v1.0 and their optimization for landslide susceptibility modeling. Geoscientific Model Development , 9(11):3975--3991
work page 2016
-
[4]
S., Molnar, P., and Kessler, M
Anderson, R. S., Molnar, P., and Kessler, M. A. (2006). Features of glacial valley profiles simply explained. Journal of Geophysical Research: Earth Surface , 111(F1)
work page 2006
-
[5]
Baker, J., Bradley, B., and Stafford, P. (2021). Seismic hazard and risk analysis . Cambridge University Press
work page 2021
-
[6]
Braun, J. and Willett, S. D. (2013). A very efficient O (n), implicit and parallel method to solve the stream power equation governing fluvial incision and landscape evolution. Geomorphology , 180:170--179
work page 2013
-
[7]
Bryce, E., Castro-Camilo, D., Dashwood, C., Tanyas, H., Ciurean, R., Novellino, A., and Lombardo, L. (2025). An updated landslide susceptibility model and a log- Gaussian Cox process extension for Scotland . Landslides , 22(2):517--535
work page 2025
-
[8]
Bryce, E., Lombardo, L., Van Westen, C., Tanyas, H., and Castro-Camilo, D. (2022). Unified landslide hazard assessment using hurdle models: a case study in the island of dominica. Stochastic Environmental Research and Risk Assessment , 36(8):2071--2084
work page 2022
Show all 54 references
-
[9]
Dahal, A., Huser, R., and Lombardo, L. (2024). At the junction between deep learning and statistics of extremes: formalizing the landslide hazard definition. Journal of Geophysical Research: Machine Learning and Computation , 1(3):e2024JH000164
2024
-
[10]
Dahal, R. K. (2014). Regional-scale landslide activity and landslide susceptibility zonation in the Nepal H imalaya. Environmental Earth Sciences , 71:5145--5164
2014
-
[11]
Dhital, M. R. (2015). Geology of the Nepal Himalaya: regional perspective of the classic collided orogen . Springer
2015
-
[12]
N., and Augustin, N
Dupont, E., Wood, S. N., and Augustin, N. H. (2022). Spatial+: a novel approach to spatial confounding. Biometrics , 78(4):1279--1290
2022
-
[13]
Copernicus DEM -- Global and European Digital Elevation Model (COP-DEM)
ESA (2021). Copernicus DEM -- Global and European Digital Elevation Model (COP-DEM) . Copernicus GLO-30 and GLO-90 datasets
2021
-
[14]
The himalaya regional land cover database: Lancover in Nepal, Bhutan, Afghanistan, Pakistan, India, China and Myanmar
FAO (2009). The himalaya regional land cover database: Lancover in Nepal, Bhutan, Afghanistan, Pakistan, India, China and Myanmar
2009
-
[15]
V., Ahamed, A., Roberts-Pierel, J., Rumsey, A
Fayne, J. V., Ahamed, A., Roberts-Pierel, J., Rumsey, A. C., and Kirschbaum, D. (2019). Automated satellite-based landslide identification product for Nepal . Earth Interactions , 23(3):1--21
2019
-
[16]
M., Clubb, F
Gailleton, B., Mudd, S. M., Clubb, F. J., Grieve, S. W., and Hurst, M. D. (2021). Impact of changing concavity indices on channel steepness and divide migration metrics. Journal of Geophysical Research: Earth Surface , 126(10):e2020JF006060
2021
-
[17]
and Lara Hinojosa, J
Garc \' a- \'A lvarez, D. and Lara Hinojosa, J. (2022). General land use cover datasets for A merica and A sia. In Land Use Cover Datasets and Validation Tools: Validation Practices with QGIS , pages 361--372. Springer International Publishing Cham
2022
-
[18]
Gasparini, N. M. and Brandon, M. T. (2011). A generalized power law approximation for fluvial incision of bedrock channels. Journal of Geophysical Research: Earth Surface , 116(F2)
2011
-
[19]
and Raftery, A
Gneiting, T. and Raftery, A. E. (2007). Strictly proper scoring rules, prediction, and estimation. Journal of the American statistical Association , 102(477):359--378
2007
-
[20]
E., Westveld III, A
Gneiting, T., Raftery, A. E., Westveld III, A. H., and Goldman, T. (2005). Calibrated probabilistic forecasting using ensemble model output statistics and minimum CRPS estimation. Monthly weather review , 133(5):1098--1118
2005
-
[21]
M., Osinski, G
Grau Galofre, A., Jellinek, A. M., Osinski, G. R., Zanetti, M., and Kukko, A. (2018). Subglacial drainage patterns of Devon Island, Canada : detailed comparison of rivers and subglacial meltwater channels. The Cryosphere , 12(4):1461--1478
2018
-
[22]
W., Mudd, S
Grieve, S. W., Mudd, S. M., and Hurst, M. D. (2016). How long is a hillslope? Earth Surface Processes and Landforms , 41(8):1039--1054
2016
-
[23]
Howard, A. D. (1994). A detachment-limited model of drainage basin evolution. Water resources research , 30(7):2261--2285
1994
-
[24]
Howard, A. D. and Kerby, G. (1983). Channel changes in badlands. Geological Society of America Bulletin , 94(6):739--752
1983
-
[25]
D., Mudd, S
Hurst, M. D., Mudd, S. M., Walcott, R., Attal, M., and Yoo, K. (2012). Using hilltop curvature to derive the spatial distribution of erosion rates. Journal of Geophysical Research: Earth Surface , 117(F2)
2012
-
[26]
D., Mudd, S
Hurst, M. D., Mudd, S. M., Yoo, K., Attal, M., and Walcott, R. (2013). Influence of lithology on hillslope morphology and response to tectonic forcing in the northern Sierra Nevada of California . Journal of Geophysical Research: Earth Surface , 118(2):832--851
2013
-
[27]
S., Whipple, K
Leonard, J. S., Whipple, K. X., and Heimsath, A. M. (2023). Isolating climatic, tectonic, and lithologic controls on mountain landscape evolution. Science Advances , 9(3):eadd8915
2023
-
[28]
H., Rue, H., and Seaton, A
Lindgren, F., Bachl, F., Illian, J., Suen, M. H., Rue, H., and Seaton, A. E. (2024). inlabru: software for fitting latent gaussian models with non-linear predictors. arXiv preprint arXiv:2407.00791
2024 arXiv
-
[29]
Loche, M., Alvioli, M., Marchesini, I., Bakka, H., and Lombardo, L. (2022). Landslide susceptibility maps of Italy : Lesson learnt from dealing with multiple landslide types and the uneven spatial distribution of the national inventory. Earth-Science Reviews , 232:104125
2022
-
[30]
Lombardo, L., Opitz, T., Ardizzone, F., Guzzetti, F., and Huser, R. (2020). Space-time landslide predictive modelling. Earth-science reviews , 209:103318
2020
-
[31]
Lombardo, L., Opitz, T., and Huser, R. (2018). Point process-based modeling of multiple debris flow landslides using INLA : an application to the 2009 M essina disaster. Stochastic environmental research and risk assessment , 32:2179--2198
2018
-
[32]
D., Hearne, M., Jaiswal, K
Marano, K. D., Hearne, M., Jaiswal, K. S., Thompson, E. M., Bruce Worden, C., and Wald, D. J. (2024). Shakemap atlas 4.0 and atlascat: An archive of the recent and the historical earthquake shakemaps, and impacts for global hazard analyses and loss model calibration. Seismolog...
2024
-
[33]
Meena, S. R. and Tavakkoli Piralilou, S. (2019). Comparison of earthquake-triggered landslide inventories: A case study of the 2015 G orkha earthquake, Nepal . Geosciences , 9(10):437
2019
-
[34]
Meunier, P., Hovius, N., and Haines, J. A. (2008). Topographic site effects and the location of earthquake induced landslides. Earth and Planetary Science Letters , 275(3-4):221--232
2008
-
[35]
Mudd, S., Clubb, F., Grieve, S., Milodowski, D., Gailleton, B., Hurst, M., Valters, D., Wickert, A., and Hutton, E. (2022). Lsdtopotools/lsdtopo-tools2: Lsdtopotools2 v0. 7. LSDtopotools/LSDTopoTools2: LSDTopoTools2 v0. 5
2022
-
[36]
M., Attal, M., Milodowski, D
Mudd, S. M., Attal, M., Milodowski, D. T., Grieve, S. W., and Valters, D. A. (2014). A statistical framework to quantify spatial variation in channel gradients using the integral method of channel profile analysis. Journal of Geophysical Research: Earth Surface , 119(2):138--152
2014
-
[37]
A., Wald, D
Nowicki, M. A., Wald, D. J., Hamburger, M. W., Hearne, M., and Thompson, E. M. (2014). Development of a globally applicable model for near real-time prediction of seismically induced landslides. Engineering geology , 173:54--65
2014
-
[38]
Opitz, T., Bakka, H., Huser, R., and Lombardo, L. (2022). High-resolution Bayesian mapping of landslide hazard with unobserved trigger event. The Annals of Applied Statistics , 16(3):1653--1675
2022
-
[39]
Pic, R., Dombry, C., Naveau, P., and Taillardat, M. (2025). Proper scoring rules for multivariate probabilistic forecasts based on aggregation and transformation. Advances in Statistical Climatology, Meteorology and Oceanography , 11(1):23--58
2025
-
[40]
K., West, A
Roback, K., Clark, M. K., West, A. J., Zekkos, D., Li, G., Gallen, S. F., Chamlagain, D., and Godt, J. W. (2018). The size, distribution, and mobility of landslides caused by the 2015 M w7. 8 G orkha earthquake, Nepal . Geomorphology , 301:121--138
2018
-
[41]
R., Rosser, N
Robinson, T. R., Rosser, N. J., Densmore, A. L., Williams, J. G., Kincey, M. E., Benjamin, J., and Bell, H. J. (2017). Rapid post-earthquake modelling of coseismic landslide intensity and distribution for emergency response decision support. Natural Hazards and Earth System Sc...
2017
-
[42]
J., Perron, J
Roering, J. J., Perron, J. T., and Kirchner, J. W. (2007). Functional relationships between denudation and hillslope form and relief. Earth and Planetary Science Letters , 264(1-2):245--258
2007
-
[43]
S., Shrestha, R., Smutny, J., Gurung, K., Lama, S., et al
Rosser, N., Kincey, M., Oven, K., Densmore, A., Robinson, T., Pujara, D. S., Shrestha, R., Smutny, J., Gurung, K., Lama, S., et al. (2021). Changing significance of landslide hazard and risk after the 2015 M w 7.8 G orkha, Nepal earthquake. Progress in Disaster Science , 10:100159
2021
-
[44]
Rue, H., Martino, S., and Chopin, N. (2009). Approximate bayesian inference for latent Gaussian models by using integrated nested L aplace approximations. Journal of the Royal Statistical Society Series B: Statistical Methodology , 71(2):319--392
2009
-
[45]
J., Berrill, J
Stafford, P. J., Berrill, J. B., and Pettinga, J. R. (2009). New predictive equations for arias intensity from crustal earthquakes in new zealand. Journal of Seismology , 13:31--52
2009
-
[46]
H., Naylor, M., and Lindgren, F
Suen, M. H., Naylor, M., and Lindgren, F. (2025). Coherent disaggregation and uncertainty quantification for spatially misaligned data. arXiv preprint arXiv:2502.10584
2025
-
[47]
L., Murthy, M., Bajracharya, B., Shrestha, B., Gilani, H., Pradhan, S., and Dangol, B
Uddin, K., Shrestha, H. L., Murthy, M., Bajracharya, B., Shrestha, B., Gilani, H., Pradhan, S., and Dangol, B. (2015). Development of 2010 national land cover database for the Nepal . Journal of environmental management , 148:82--90
2015
-
[48]
N., and Tehrany, M
Umar, Z., Pradhan, B., Ahmad, A., Jebur, M. N., and Tehrany, M. S. (2014). Earthquake induced landslide susceptibility mapping using an integrated ensemble frequency ratio and logistic regression models in West Sumatera Province, Indonesia . Catena , 118:124--135
2014
-
[49]
Valagussa, A., Frattini, P., Crosta, G., and Valbuzzi, E. (2018). Pre and post 2015 Nepal earthquake landslide inventories. In Landslides and Engineered Slopes. Experience, Theory and Practice , pages 1957--1964. CRC Press
2018
-
[50]
Valagussa, A., Frattini, P., Valbuzzi, E., and Crosta, G. (2021). Role of landslides on the volume balance of the Nepal 2015 earthquake sequence. Scientific reports , 11(1):3434
2021
-
[51]
Valagussa, A., Frattini, P., Valbuzzi, E., and Crosta, G. (2022). Landslide Inventory from the M 7.8 Gorhka , Nepal Earthquake
2022
-
[52]
Whipple, K. X. and Tucker, G. E. (1999). Dynamics of the stream-power river incision model: Implications for height limits of mountain ranges, landscape response timescales, and research needs. Journal of Geophysical Research: Solid Earth , 104(B8):17661--17674
1999
-
[53]
Yadav, R., Huser, R., Opitz, T., and Lombardo, L. (2023). Joint modelling of landslide counts and sizes using spatial marked point processes with sub-asymptotic mark distributions. Journal of the Royal Statistical Society Series C: Applied Statistics , 72(5):1139--1161
2023
-
[54]
E., Lindgren, F., Borchers, D
Yuan, Y., Bachl, F. E., Lindgren, F., Borchers, D. L., Illian, J. B., Buckland, S. T., Rue, H., and Gerrodette, T. (2017). Point process models for spatio-temporal distance sampling data from a large-scale survey of blue whales. THE ANNALS of APPLIED STATISTICS , pages 2270--2297
2017
Reviewed August 6, 2026 · model on record in the stance chip above.
Discussion (0). Continue with ORCID to comment.