REVIEW 3 major objections 4 minor 35 references
Magnification bias reveals severe contamination in Hubble Frontier Field photo-z catalogs
T0 review · 3 major / 4 minor · reviewed 2026-08-06 · deepseek-v4-flash
Pith's one-line read A magnification-bias analysis finds that more than half of the z~4 galaxies in Hubble Frontier Fields cluster catalogs are low-redshift contaminants.
desk verdict A useful, referee-worthy paper that makes a strong qualitative case for cluster-member contamination in HFF photo-z catalogs, but the headline ~56% number is not yet pinned down because the paper's own control test shows the same excess that the estimator labels as contamination. read the letter →
The pith
A machine-rendered reading of the paper's core claim, the machinery that carries it, and where it could break.
The reading
What carries the argument
The engine of the analysis is the magnification-bias relation $n_{\rm len}(z,\mu_z,m_{\rm lim}) = \Gamma\bigl(<(m_{\rm lim}+2.5\log_{10}\mu_z),z\bigr)/\mu_z$, where $\Gamma$ is the cumulative ultraviolet luminosity function measured from the parallel blank fields, $m_{\rm lim}$ is the completeness-corrected detection threshold, and $\mu_z$ is the local lensing magnification. The numerator accounts for lensing lowering the effective detection threshold; the denominator accounts for the lensed sky being spread over a larger area. Combining this prediction with magnification maps from three independent cluster lens models, the paper divides the cluster fields into magnification bins and attributes any observed excess over prediction to contamination. The luminosity function itself is obtained by fitting Schechter/Gamma functions to parallel-field number counts and extrapolating to fainter magnitudes, with redshift-dependent parameters given in Equations (2)–(4).
What would settle it
Spectroscopically confirm every $3.5\le z\le5.5$ candidate in one Hubble Frontier Fields cluster field down to the catalog's completeness limit: the paper's claim predicts that a majority will turn out to have Balmer breaks at $z\lesssim1.5$, whereas the lensing interpretation predicts Lyman breaks at the photometric redshifts.
Extended reading notes
Core claim
The central claim is that more than half of the $3.5\le z_{\rm phot}\le5.5$ galaxies in the photometric-redshift catalogs built from the Hubble Frontier Fields cluster fields are not distant galaxies at all, but low-redshift interlopers—most likely cluster members whose redshifted Balmer/4000 Å breaks are mistaken for the Lyman break of star-forming galaxies at $z\sim3.5$–$5.5$. The evidence has two layers. First, the apparent $z\gtrsim4$ excess is absent from the parallel blank fields, and the candidates in cluster fields are redder, concentrated on the cluster red sequence, and radially clustered like cluster members. Second, a quantitative magnification-bias test predicts the lensed density from the parallel-field ultraviolet luminosity function; the observed excess above that prediction is attributed entirely to contamination, giving $59.4\pm11.1\%$ with one parametric lens model, $53.5\pm10.3\%$ with a free-form model, $59.5\pm18.5\%$ with internal models, and an average of $56.9\pm11.8\%$. The paper therefore concludes that the cluster-field excess previously interpreted as lensing-revealed faint galaxies is predominantly a misidentification artifact.
Load-bearing premise
The entire contamination estimate rests on the blank parallel fields being a faithful measure of the intrinsic galaxy population behind the clusters, so if the parallel-field luminosity function is not representative—for instance if its faint-end slope is too shallow or those fields are themselves contaminated—the reported contamination fractions could be substantially too high.
Editorial extensions
If this is right
- Ultraviolet luminosity functions built from these cluster-field catalogs without removing interlopers will overestimate the faint end, producing artificial upturns like those shown in the paper's Figure 15.
- Faint-end turnover tests of cosmological models—whether baryonic feedback or warm or wave dark matter—are not reliable on cluster-lensing data unless the contaminants are individually removed.
- Applying standard Lyman-break-galaxy color cuts reduces the inferred contamination to $11.0\pm11.8\%$ on average, but leaves only about one third of the UV-bright sample, so the cleaned sample is also less complete.
- The same magnification-bias analysis applied to $1.2\le z\le2.4$ reproduces the expected negative bias with little excess, which the paper treats as validation that the method behaves as intended where contamination should not be severe.
- Deeper JWST imaging and spectroscopy that samples the rest-frame Balmer break offers the practical route to identifying and removing the interlopers individually.
Reading between the lines
- The same test could be run on any cluster-lensing photometric catalog that has a blank-field luminosity function and lens models; it doubles as a general validation statistic for photo-z catalogs in lensing fields.
- If the high contamination rate extends to other Hubble-era cluster-lensing catalogs, earlier published constraints on the faint-end ultraviolet luminosity function—and on dark-matter models that predict turnovers—may need downward revision, although the paper itself does not recompute those constraints.
- Applying the magnification-bias test to JWST-era catalogs, where near-infrared photometry samples rest-frame 4000 Å for $z\sim4$, would provide a sharp test of whether deeper data actually removes the interlopers or merely shifts their estimated redshifts.
Editorial analysis
A structured set of objections, weighed in public.
Referee Report
Summary. The paper claims that the excess of 3.5<z_phot<5.5 galaxies in the Hubble Frontier Fields cluster catalogs relative to parallel fields is dominated by misidentified low-redshift cluster members, not by lensing. It first presents qualitative diagnostics (redder colors, concentration toward the cluster red sequence, and radially concentrated distributions) and then quantifies the effect using magnification bias: predicted lensed densities from parallel-field UV luminosity functions and three lens models are compared with observed densities, and the total observed-minus-predicted excess is attributed to contamination. The reported contamination fractions are 59.38±11.12% (CATS), 53.48±10.33% (WSLAP+), and 59.53±18.52% (internal glafic models), with an average of 56.87±11.84%. The paper also applies LBG-like selection criteria and finds a much lower contamination of 11.04±11.79%, at the cost of completeness.
Significance. If the quantitative claim is correct, the paper has major implications: it would call into question photo-z-based high-redshift samples in lensing fields, explain nonphysical faint-end turn-ups in cluster-field UV luminosity functions, and affect tests of dark matter and reionization that rely on those LFs. The paper has several genuine strengths: the use of lensing-invariant diagnostics (color and surface brightness), consistency across three independent lens models, a forward-modeling approach that is not a simple fit with a contamination normalization, and an explicit, falsifiable LBG-like selection test that yields a much lower contamination fraction. However, the central quantitative result is undermined by the behavior of the paper's own control sample at 1.2<z<2.4, which shows the same type of high-magnification excess that is elsewhere interpreted as contamination. The qualitative conclusion that contamination is severe remains plausible; the specific majority fraction is not yet convincingly established.
major comments (3)
- [Sec. 4, Fig. 13] The 1.2<z<2.4 control does not validate the excess-to-contamination mapping. The text states that the observed densities follow the predicted negative-bias trend "but may with a systematic offset," and that data in some magnification bins, especially at μ>10, are "severely deviating from the predicted level, suggesting we have contamination in those bins." Since the 3.5–5.5 contamination fraction is computed as the total observed-minus-predicted excess summed over magnification bins, the presence of the same high-μ excess in a supposedly uncontaminated control means the estimator cannot uniquely separate contamination from other systematics that depress predicted densities at high μ (e.g., lens-model magnification overestimates near cluster centers, residual incompleteness, or photo-z outliers). The quoted uncertainties (10–18%) propagate only LF-fitting covariance and Poisson/variance terms; they do not include this control-systematic. Please quantify the control offset, incorporate it into the systematic error budget, or restrict the claim to a qualitative statement.
- [Sec. 3.2, Eq. (5)] The prediction requires extrapolating the parallel-field Gamma function from the data-complete limit m_lim=27.5 down to m_lim+2.5 log10 μ; at μ>10 this reaches roughly 2.5 magnitudes below the data, where the fitted faint-end slope α=−1.886±0.142 (Table 1) is least constrained. A steeper true faint-end slope raises N_pred and lowers the inferred contamination fraction. The shaded uncertainty in Fig. 14 propagates the LF-fitting covariance, but it does not test sensitivity to the assumed functional form or to alternative α values from the literature. Please add a robustness test, for example adopting the Bouwens et al. (2021) faint-end slopes or truncating the μ>10 bins and recomputing the contamination fraction.
- [Sec. 3.1 and Sec. 4] The treatment of inner-cluster incompleteness is not internally consistent. Section 3.1 notes a residual brightness rise in the innermost region, and Sec. 4 argues that the non-uniform, shallower detection threshold means the lensed galaxy count is over-predicted, so the actual contamination may be higher. Yet the control test in Fig. 13 shows observed densities in high-magnification bins exceeding predictions, which is the opposite of the suppression expected from incompleteness. These two effects have opposite signs and are invoked without quantification. Please provide a quantitative completeness correction for the high-μ bins and reconcile the two statements, since the direction of the correction affects the 56% estimate.
minor comments (4)
- [Sec. 3.4, Table 2] The text says region masking leaves about 30% of the sample in cluster fields and 40% in parallel fields, but Table 2 gives 2087/4564≈46% and 1368/2488≈55% for 3.5–5.5, and 2988/8778≈34% and 5084/10906≈47% for 1.2–2.4. Please correct the text or the table.
- [Sec. 4, Figs. 13 and 14] The captions refer to the "CLF-redshift relations," which appears to be a typo for "LF-redshift relations."
- [Sec. 5] The weighted-average contamination of 56.87±11.84% is reported without specifying the weights or the formula used to combine the CATS, WSLAP+, and internal glafic estimates; please state the weighting explicitly so the reader can reproduce the average.
- [Sec. 5.2] When comparing the LBG-like selected contamination of 11.04±11.79% with the main 56.87% result, the paper uses the Bouwens et al. (2021) blank-field LF as the prediction baseline rather than the parallel-field LF used elsewhere; this baseline change should be more prominently highlighted so that the comparison is not read as apples-to-apples.
Circularity Check
No significant circularity: the 56% contamination estimate is a residual against an independently fitted parallel-field LF, not a fitted input or self-citation chain.
full rationale
The derivation chain is self-contained in the relevant sense. The contamination fraction is computed as (N_obs - N_pred)/N_obs, where N_pred comes from the forward model of Eq. (5): the parallel-field Gamma-function LF (Eqs. 2-4, Table 1) combined with lens-model magnification maps. No parameter is fitted to the cluster-field counts that are then labeled as contaminated. The sentence in Sec. 3.3, 'We then test for contaminants as any excess population observed in the cluster fields,' is an operational definition of the test statistic rather than a fitted input; the quantitative output could in principle have been zero or negative had the model matched the data. The 1.2<z<2.4 control excess in high-magnification bins is a validation concern about systematics such as magnification overestimates, incompleteness, or photo-z outliers, but the paper does not use the control to calibrate any free parameter or to define the 3.5-5.5 excess, so it is not a circular reduction. Self-citations (Leung et al. 2018 for the F160W masking threshold and magnitude conversion; Diego et al. for WSLAP+; Li et al. 2024 for the internal glafic models) are present but not load-bearing: the masking choice is a peripheral data cut, and the central estimate is reproduced across three independent lens-model families, including external CATS and WSLAP+ models. The paper also openly states limitations, including shallower inner detection thresholds and unquantified blank-field contamination, which cuts against any impression of a forced result. Overall, no identifiable step makes a prediction equal to its input by construction, so circularity is minimal.
Assumptions & free parameters
free parameters (5)
- Faint-end slope alpha (3.5-5.5) =
-1.886 ± 0.142 (Table 1); alpha(z) = (-0.127±0.045)z + (-1.237±0.103)
- Characteristic magnitude M* (3.5-5.5) =
-21.468 ± 0.232 (Table 1)
- LF amplitude phi (3.5-5.5) =
0.459 ± 0.198 x 1e-3 /mag/Mpc^3
- Photo-z scatter coefficient =
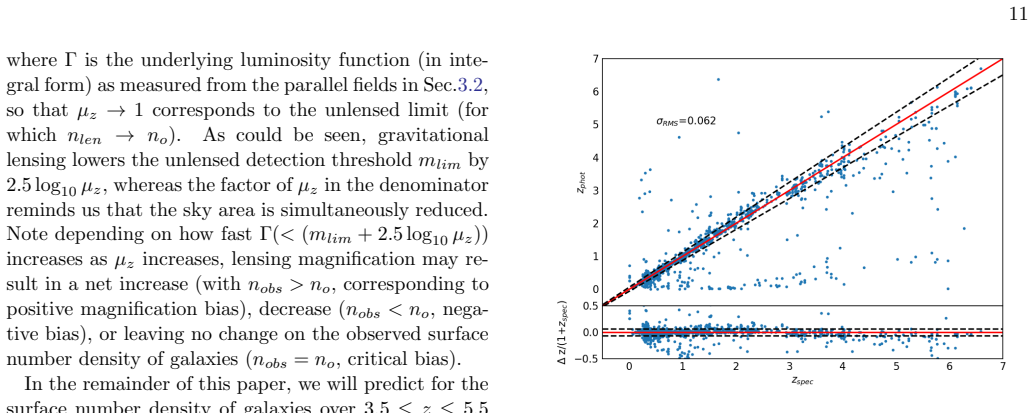
0.062, i.e., z_RMS ~ 0.062(1+z)
- Completeness threshold in F814W =
27.25 mag
assumptions (5)
- domain assumption The UV luminosity function in parallel fields is representative of the intrinsic LF behind the cluster fields.
- domain assumption The lens models (CATS, WSLAP+, glafic) accurately provide magnification factors on the image plane at the positions of the galaxies.
- domain assumption Photometric redshift errors are characterized by a single Gaussian scatter z_RMS ~ 0.062(1+z) as measured from spec-z galaxies.
- domain assumption Flat LambdaCDM cosmology with H0=70 km/s/Mpc and Omega_Lambda=0.7.
- domain assumption The S18 catalog with use_phot=1 flag selects galaxies with reasonable photometric redshifts.
Cite this review
Pith. "Pith review of Magnification bias reveals severe contamination in Hubble Frontier Field photo-z catalogs." pith.science (2026). https://pith.science/paper/YIW6HRBP
@misc{pith2026250709142,
  author       = {Pith},
  title        = {Pith review of: Magnification bias reveals severe contamination in Hubble Frontier Field photo-z catalogs},
  year         = {2026},
  howpublished = {\url{https://pith.science/paper/YIW6HRBP}},
  note         = {Machine review of arXiv:2507.09142}
}
abstract
Gravitational lensing by massive galaxy clusters enables faint distant galaxies to be more abundantly detected than in blank fields, thereby allowing one to construct galaxy luminosity functions (LFs) to an unprecedented depth at high redshifts. Intriguingly, photometric redshift catalogs (e.g. Shipley et al. (2018)) constructed from the Hubble Frontier Fields survey display an excess of z$\gtrsim$4 galaxies in the cluster lensing fields and are not seen in accompanying blank parallel fields. The observed excess, while maybe a gift of gravitational lensing, could also be from misidentified low-z contaminants having similar spectral energy distributions as high-z galaxies. In the latter case, the contaminants may result in nonphysical turn-ups in UV LFs and/or wash out faint end turnovers predicted by contender cosmological models to $\Lambda$CDM. Here, we employ the concept of magnification bias to perform the first statistical estimation of contamination levels in HFF lensing field photometric redshift catalogs. To our great worry, while we were able to reproduce a lower-z lensed sample, it was found $\sim56\%$ of $3.5 < z_{phot} < 5.5$ samples are likely low-z contaminants! Widely adopted Lyman Break Galaxy-like selection rules in literature may give a 'cleaner' sample magnification bias-wise but we warn readers the resulting sample would also be less complete. Individual mitigation of the contaminants is arguably the best way for the investigation of faint high-z Universe, and this may be made possible with JWST observations.
Figures


Figures from the paper (11 more)




Reference graph
Works this paper leans on
-
[1]
2023a, MNRAS, 524, 5486, doi: 10.1093/mnras/stad1998
Atek, H., Chemerynska, I., Wang, B., et al. 2023a, MNRAS, 524, 5486, doi: 10.1093/mnras/stad1998
-
[2]
Atek, H., Shuntov, M., Furtak, L. J., et al. 2023b, MNRAS, 519, 1201, doi: 10.1093/mnras/stac3144
-
[3]
Bezanson, R., Labbe, I., Whitaker, K. E., et al. 2022, arXiv e-prints, arXiv:2212.04026, doi: 10.48550/arXiv.2212.04026 16Zhang et al
-
[4]
Bouwens, R. J., Illingworth, G., Ellis, R. S., et al. 2022a, ApJ, 931, 81, doi: 10.3847/1538-4357/ac618c
-
[5]
2022b, ApJ, 940, 55, doi: 10.3847/1538-4357/ac86d1
Stefanon, M. 2022b, ApJ, 940, 55, doi: 10.3847/1538-4357/ac86d1
-
[6]
Bouwens, R. J., Illingworth, G. D., Franx, M., et al. 2009, ApJ, 705, 936, doi: 10.1088/0004-637X/705/1/936
-
[7]
Bouwens, R. J., Illingworth, G. D., Oesch, P. A., et al. 2014, ApJ, 793, 115, doi: 10.1088/0004-637X/793/2/115
-
[8]
Bouwens, R. J., Oesch, P. A., Stefanon, M., et al. 2021, AJ, 162, 47, doi: 10.3847/1538-3881/abf83e
Show all 35 references
-
[9]
D., Coe, D., Brammer, G., et al
Bradley, L. D., Coe, D., Brammer, G., et al. 2023, ApJ, 955, 13, doi: 10.3847/1538-4357/acecfe
2023 doi
-
[10]
J., Stanway, E
Bunker, A. J., Stanway, E. R., Ellis, R. S., & McMahon, R. G. 2004, MNRAS, 355, 374, doi: 10.1111/j.1365-2966.2004.08326.x
2004
-
[11]
B., Grillo, C., Rosati, P., et al
Caminha, G. B., Grillo, C., Rosati, P., et al. 2016, A&A, 587, A80, doi: 10.1051/0004-6361/201527670 —. 2017, A&A, 600, A90, doi: 10.1051/0004-6361/201629297
2016 doi
-
[12]
2016, A&A, 590, A31, doi: 10.1051/0004-6361/201527514
Castellano, M., Amor ´ ın, R., Merlin, E., et al. 2016, A&A, 590, A31, doi: 10.1051/0004-6361/201527514
2016 doi
-
[13]
2015, ApJ, 800, 84, doi: 10.1088/0004-637X/800/2/84
Coe, D., Bradley, L., & Zitrin, A. 2015, ApJ, 800, 84, doi: 10.1088/0004-637X/800/2/84
2015 doi
-
[14]
S., Agarwal, S., Marsh, D
Corasaniti, P. S., Agarwal, S., Marsh, D. J. E., & Das, S. 2017, PhRvD, 95, 083512, doi: 10.1103/PhysRevD.95.083512 Di Criscienzo, M., Merlin, E., Castellano, M., et al. 2017, A&A, 607, A30, doi: 10.1051/0004-6361/201731172
2017 doi
-
[15]
2015a, MNRAS, 447, 3130, doi: 10.1093/mnras/stu2660
Lim, J. 2015a, MNRAS, 447, 3130, doi: 10.1093/mnras/stu2660
-
[16]
M., Broadhurst, T., Wong, J., et al
Diego, J. M., Broadhurst, T., Wong, J., et al. 2016a, MNRAS, 459, 3447, doi: 10.1093/mnras/stw865
-
[17]
M., Broadhurst, T., Zitrin, A., et al
Diego, J. M., Broadhurst, T., Zitrin, A., et al. 2015b, MNRAS, 451, 3920, doi: 10.1093/mnras/stv1168
-
[18]
M., Broadhurst, T., Chen, C., et al
Diego, J. M., Broadhurst, T., Chen, C., et al. 2016b, MNRAS, 456, 356, doi: 10.1093/mnras/stv2638
-
[19]
M., Schmidt, K
Diego, J. M., Schmidt, K. B., Broadhurst, T., et al. 2018, MNRAS, 473, 4279, doi: 10.1093/mnras/stx2609
2018 doi
-
[20]
P., Le F` evre, O., Ilbert, O., et al
Hathi, N. P., Le F` evre, O., Ilbert, O., et al. 2016, A&A, 588, A26, doi: 10.1051/0004-6361/201526012
2016 doi
-
[21]
2016, MNRAS, 457, 2029, doi: 10.1093/mnras/stw069
Jauzac, M., Richard, J., Limousin, M., et al. 2016, MNRAS, 457, 2029, doi: 10.1093/mnras/stw069
2016 doi
-
[22]
J., Richard, J., Cl´ ement, B., et al
Lagattuta, D. J., Richard, J., Cl´ ement, B., et al. 2017, MNRAS, 469, 3946, doi: 10.1093/mnras/stx1079
2017 doi
-
[23]
M., et al
Lam, D., Broadhurst, T., Diego, J. M., et al. 2014, ApJ, 797, 98, doi: 10.1088/0004-637X/797/2/98
2014 doi
-
[24]
2018, ApJ, 862, 156, doi: 10.3847/1538-4357/aacdad
Leung, E., Broadhurst, T., Lim, J., et al. 2018, ApJ, 862, 156, doi: 10.3847/1538-4357/aacdad
2018 doi
- [25]
-
[26]
2016, A&A, 588, A99, doi: 10.1051/0004-6361/201527638
Limousin, M., Richard, J., Jullo, E., et al. 2016, A&A, 588, A99, doi: 10.1051/0004-6361/201527638
2016 doi
-
[27]
C., Finkelstein, S
Livermore, R. C., Finkelstein, S. L., & Lotz, J. M. 2017, ApJ, 835, 113, doi: 10.3847/1538-4357/835/2/113
2017 doi
-
[28]
M., Koekemoer, A., Coe, D., et al
Lotz, J. M., Koekemoer, A., Coe, D., et al. 2017, ApJ, 837, 97, doi: 10.3847/1538-4357/837/1/97
2017 doi
-
[29]
2018, MNRAS, 473, 663, doi: 10.1093/mnras/stx1971
Mahler, G., Richard, J., Cl´ ement, B., et al. 2018, MNRAS, 473, 663, doi: 10.1093/mnras/stx1971
2018 doi
-
[30]
2016, A&A, 590, A30, doi: 10.1051/0004-6361/201527513
Merlin, E., Amor ´ ın, R., Castellano, M., et al. 2016, A&A, 590, A30, doi: 10.1051/0004-6361/201527513
2016 doi
-
[31]
E., Furlanetto, S
Robertson, B. E., Furlanetto, S. R., Schneider, E., et al. 2013, ApJ, 768, 71, doi: 10.1088/0004-637X/768/1/71
2013 doi
-
[32]
V., Lange-Vagle, D., Marchesini, D., et al
Shipley, H. V., Lange-Vagle, D., Marchesini, D., et al. 2018, ApJS, 235, 14, doi: 10.3847/1538-4365/aaacce
2018 doi
-
[33]
2022, ApJ, 935, 110, doi: 10.3847/1538-4357/ac8158
Treu, T., Roberts-Borsani, G., Bradac, M., et al. 2022, ApJ, 935, 110, doi: 10.3847/1538-4357/ac8158
2022 doi
-
[34]
J., Doyon, R., Albert, L., et al
Willott, C. J., Doyon, R., Albert, L., et al. 2022, PASP, 134, 025002, doi: 10.1088/1538-3873/ac5158
2022 doi
-
[35]
A., Cohen, S
Windhorst, R. A., Cohen, S. H., Jansen, R. A., et al. 2023, AJ, 165, 13, doi: 10.3847/1538-3881/aca163
2023 doi
Reviewed August 6, 2026 · model on record in the stance chip above.
Discussion (0). Continue with ORCID to comment.