REVIEW 3 major objections 3 minor 86 references
Boltzmann Price: Toward Understanding the Fair Price in High-Frequency Markets
T0 review · 3 major / 3 minor · reviewed 2026-08-06 · deepseek-v4-flash
Pith's one-line read A maximum-entropy derivation yields the Boltzmann price, a one-parameter family that turns top-of-book volume imbalance into a fair price and fat-tailed dynamics.
desk verdict The theoretical framework is a clean unification, but the empirical fit is hand-tuned and partly circular; it deserves review as a theoretical contribution, not as a validated model. read the letter →
The pith
A machine-rendered reading of the paper's core claim, the machinery that carries it, and where it could break.
The reading
What carries the argument
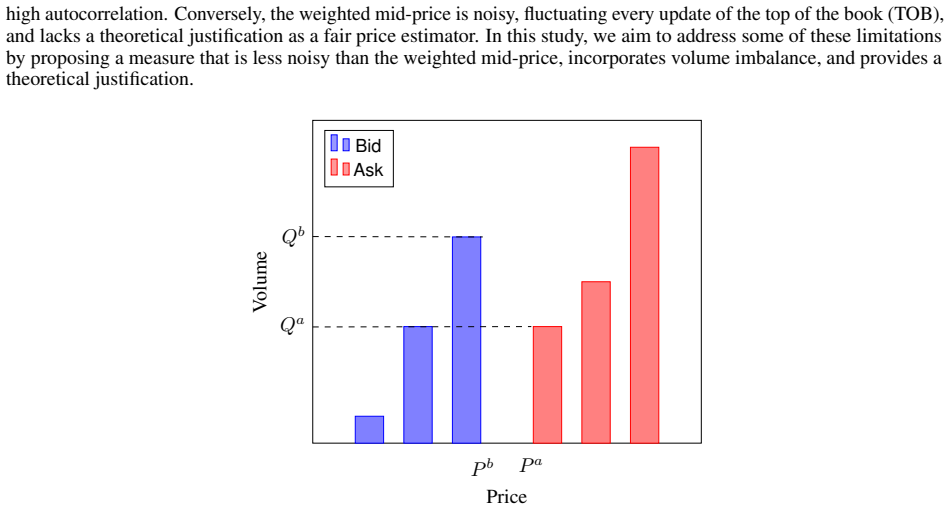
The machinery is the two-state maximum-entropy model. State probabilities are $p_b=e^{-\beta q_b}/Z$ and $p_a=e^{-\beta q_a}/Z$, with $Z=e^{-\beta q_b}+e^{-\beta q_a}$ the partition function and $q_b=Q_b/(Q_b+Q_a)$, $q_a=1-q_b$; $\beta\ge0$ is a free parameter playing the role of inverse temperature. The Boltzmann price is the expected price under this distribution (Definition 3.2). Its first-order expansion, $P_{\mathrm{boltzmann}}(\beta)\approx(1-\beta/2)P_{\mathrm{mid}}+(\beta/2)P_w$, connects the family to the mid-price and weighted mid-price, and the same probabilities enter the biased random walk whose continuous limit is Eq. (45), with per-step drift $\epsilon\tanh(\beta\theta_t)$ and volatility $\epsilon/\cosh(\beta\theta_t)$. In the appendix, a large-tick idealization shows the first micro-price adjustment has the same form, proportional to $(P_a-P_b)(q_b-\frac12)$, which identifies the equilibrium price with the micro-price when $\beta=1$.
What would settle it
Fit the Boltzmann price with $\beta$ free to one-minute quote data for a liquid stock and compare its one-step-ahead price-change predictions with a model that also includes the next ten levels of book depth, recent order flow, and a time-varying $\beta$; if the extended model predicts significantly better out of sample, the sufficiency assumption fails. Alternatively, estimate $\beta$ from historical $\theta_t$ and check whether the kurtosis generated by Eq. (45) still exceeds the Bachelier benchmark when $\beta$ is estimated rather than hand-picked.
Extended reading notes
Core claim
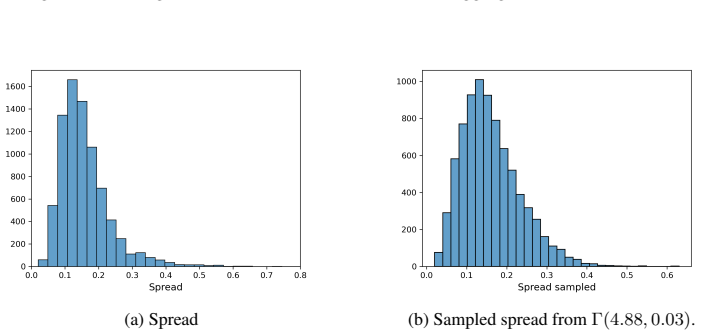
The central claim, stated on the paper's own terms, is that the maximum-entropy principle applied to a two-state order book yields Definition 3.2, the Boltzmann price, as the fair price, and that the same Boltzmann probabilities that define it also define the dynamics in Eq. (45). The first-order decomposition in Lemma 4.1, $P_{\mathrm{boltzmann}}(\beta)=P_{\mathrm{mid}}+\beta(P_a-P_b)\theta/2+O(\theta^3)$, is the identity tying the family to existing benchmarks: $\beta=0$ is the mid-price, $\beta=2$ approximates the weighted mid-price, and the quasi-equilibrium price $\tilde{P}^{\mathrm{eq}}=\frac12(P_{\mathrm{mid}}+P_w)$ approximates $\beta=1$. The paper reports that the resulting dynamics produces excess kurtosis (for example, 4.67 versus about 0.16 for the Bachelier model in one simulation) and that, after sampling imbalance from Beta distributions and spread from a Gamma distribution, sampled price changes line up with historical kernel density estimates for a varying-spread stock and a constant-spread stock, with comparable kurtosis. It also derives the impact of an imbalance change on the Boltzmann price, $\Delta P^{\mathrm{boltzmann}}=\frac{S}{2}[\tanh(\beta\theta_1)-\tanh(\beta\theta_0)]$, and notes that clearing one side completely from a balanced book moves the price by only $(S/2)\tanh(\beta/2)$, less than the weighted mid-price's $S/2$ move.
Load-bearing premise
The whole derivation rests on the assumption that the top-of-book volume imbalance $q$ is a sufficient statistic for every piece of market information relevant to the fair price, so the bid and ask probabilities depend on $q$ alone through one exponential parameter $\beta$.
Editorial extensions
If this is right
- If the family is correct, the choice between mid-price and weighted mid-price dissolves: both are parameter values of one price, and the equilibrium price at $\beta=1$ is essentially their average.
- The dynamics in Eq. (45) produce leptokurtic price changes from imbalance alone, so heavy tails do not require a separate stochastic volatility process; increasing $\beta$ and a U-shaped imbalance distribution push kurtosis higher.
- Drift is endogenous: a persistently positive $\theta_t$ gives a positive drift $\sigma\tanh(\beta\theta_t)$ even with no added $\mu\,dt$, so the model offers a microstructure mechanism for expected price moves.
- The market-impact calculation bounds the fair-price move from clearing one side: for $\beta=1$, $(S/2)\tanh(1/2)\approx 0.462\,(S/2)$, which makes the weighted mid-price look like an overestimate of temporary impact and supports $\frac12(P_{\mathrm{mid}}+P_w)$ as a more suitable proxy.
- With the spread-dependent generalized Boltzmann price, $\beta$ scales inversely with spread: large spreads pull the fair price back to the mid-price, while small spreads push it toward the heavier side of the book.
Reading between the lines
- Equation (73), $\beta=-\ln(p_b/p_a)/(q_b-q_a)$, offers a direct way to estimate $\beta$ from historical level-1 quote data; the paper leaves this estimation to future work, so a cross-sectional calibration of $\beta$ is a natural next step.
- The same maximum-entropy logic can be extended to more than two states by assigning energies to deeper book levels; such an extension would make the sufficiency of top-of-book imbalance testable against a multi-level Boltzmann price.
- The spread-as-temperature analogy yields a testable cross-sectional prediction: fitted inverse temperature should fall as average spread rises, and violations would indicate that spread is not the only relevant scale.
- Modeling $\theta_t$ endogenously as a mean-reverting or predictable process, instead of sampling it from a fixed distribution, would turn Eq. (45) into a closed two-factor model and sharpen the tail-behavior prediction; this is an extension, not a claim of the paper.
Editorial analysis
A structured set of objections, weighed in public.
Referee Report
Summary. The paper proposes a parametrized family of fair prices, the Boltzmann price, obtained by applying the maximum-entropy principle to a two-state (bid/ask) model of the limit order book, with state probabilities depending on top-of-book volume imbalance. The price interpolates between the mid-price and the weighted mid-price (Lemma 4.1), and the corresponding biased random walk is taken to the diffusion limit dPt = σ(tanh(βθt)dt + dWt/cosh(βθt)), so that both drift and volatility are imbalance-driven. The authors argue that this dynamics can produce heavier tails than constant-volatility Bachelier or GBM models and report simulations together with two historical data examples (GE and LCID) as validation. The paper also derives a market-impact interpretation from the derivative of the Boltzmann price with respect to imbalance.
Significance. If the empirical claims were established, the model would provide a compact theoretical integration of price, spread, and volume imbalance, and the explicit link between the micro-price and the β-parametrized family in Appendix 10.2 is a useful contribution. The Taylor expansion in Lemma 4.1 is correctly derived, and the stochastic differential equation in Eq. (45) is a coherent stochastic-volatility-type extension that can indeed generate excess kurtosis relative to constant-volatility models. However, the validation section does not presently support the abstract's claim of fitting historical equity data, and the maximum-entropy derivation leaves β as a free parameter, so the theoretical novelty is more limited than the presentation suggests. No code or data availability statement is provided, which also limits reproducibility.
major comments (3)
- [§7.1, Eq. (52), Table 5] The claim that the model "fits historical equity data" is not supported by the GE analysis. The simulation fixes β = 1 and selects η = 0.75 to match the mean and standard deviation; the mean kurtosis over 1,000 sampled runs is 2.51 with standard deviation 0.41, whereas the historical kurtosis is 4.15. The displayed value 5.17 in Figure 8 is therefore a cherry-picked run, not a typical outcome of the model. A proper calibration on a training window and evaluation on a holdout window, with sampling distributions reported, is needed before any out-of-sample fit can be claimed. The paper itself states that parameter estimation is left for future research (Section 7.1 and Section 9), which is in tension with the abstract's wording.
- [§7.2, Eq. (53), Tables 7–8] The LCID validation is partly circular. The sampled price changes in Eq. (53) use the historical mean and standard deviation (˜μ, ˜σ) of mid-price changes as inputs, and the parameters β = 17 and η = 2 are selected by comparing the resulting kurtosis with the historical value; the data are then rounded to two decimals after the comparison. Because the same data determine both the inputs and the reported fit, the exercise demonstrates that a flexible two-parameter family can match one moment, not that the model has predictive or descriptive validity. An estimation procedure for β and η on a separate subsample is required, or the claim should be reduced to a curve-fitting illustration.
- [§3, Assumption 3.1, Eq. (15)] The maximum-entropy derivation does not determine the exponential tilt: β is a free parameter and the constraint ⟨q⟩ is unknown, as the text acknowledges in the paragraph after Eq. (14). Consequently, the "least biased" characterization is conditional on an assumed functional form and a free parameter, and the choice β = 1 for the equilibrium price in Definition 3.3 is not derived. Additionally, Assumption 3.1 asserts that q is a sufficient statistic for the fundamental price, an assumption the paper itself flags as restrictive with respect to deeper book information. These limitations should be stated as explicit scope conditions, and the sensitivity of the price and the SDE to β should be reported.
minor comments (3)
- [§6.1, Figure 3] The caption of Figure 3 lists parameters (qt ∼ Beta(0.5, 0.5), σ = 0.05, η = 2.75) that do not match the text of Section 6.1, which describes imbalance sampled from Beta(4.5, 4.5), spread from Gamma(1, 1), a tick size of 0.01, and β = 1; the caption should be aligned with the text or the discrepancy explained.
- [Throughout] Several typos should be corrected, including "Bolztmann" in footnote 9, "martinagle" in Appendix 10.1, and "General Electic" in Section 7.1.
- [Abstract and Section 9] The abstract states that the model is validated and "demonstrate[s] its fit to historical equity data," but Section 9 explicitly says that "a detailed empirical analysis using historical data" and "a comprehensive study of model parameter estimation" are still needed; the abstract should be tempered to avoid overstating the empirical contribution.
Circularity Check
Empirical 'fit to historical data' is calibration, not prediction: β and η are tuned to match target moments on the same sample.
-
fitted input called prediction
[Section 7.2, Eq. (53) and surrounding text; also Section 7.1]
"The sampled price differences are generated as follows: η ˜µ tanh (βθi) + η˜σ ϵi / cosh (βθi), where ϵi are i.i.d. random variables drawn from N (0, 1), and ˜µ and ˜σ represent the mean and standard deviation of mid-price changes, respectively. ... The parameters β and η were selected to produce sampled price changes with means and standard deviations similar to those in the historical data, while also achieving comparable kurtosis."
The paper's abstract and Section 7 claim that the model 'fits historical equity data,' but the fit is produced by selecting β and η to match the historical mean, standard deviation, and kurtosis on the same dataset. In Eq. (53), the historical mean and standard deviation are inserted directly into the simulation, so the simulated first two moments match by construction. The kurtosis match is then reported as evidence, but β=17 and η=2 were explicitly chosen to make that kurtosis comparable. Similarly, in Section 7.1, η=0.75 is chosen 'to yield a mean and standard deviation similar to those reported in Table 6,' and the displayed kurtosis 5.17 comes from a single sample while the average simulated kurtosis is 2.51 versus the historical 4.15.
full rationale
The theoretical core of the paper is self-contained and not circular. Definition 3.2 defines the Boltzmann price explicitly as a softmax function of the bid and ask imbalances, and Lemma 4.1 derives its relationship to the mid-price and weighted mid-price by Taylor expansion; this is a mathematical identity, not a hidden reuse of the target result. Section 5 derives the SDE dPt = σ(tanh(βθt)dt + dWt/cosh(βθt)) from an explicitly stated biased-random-walk model whose transition probabilities are e^{βθ}/(e^{βθ}+e^{-βθ}); the drift and volatility formulas follow from direct calculation, and the excess kurtosis is a genuine consequence of the imbalance-driven stochastic volatility, not an imported conclusion. The paper also transparently states that β is a free parameter of the maximum-entropy problem, so the Boltzmann form is an ansatz rather than a derived uniqueness result. There are no load-bearing self-citations or imported uniqueness theorems. The only significant circularity is in the empirical validation: the claim that the model 'fits historical equity data' is supported by parameters that are selected on the same data to reproduce the very moments that are then reported as matches. This is calibration presented as fit, lowering the score to 6, but it does not invalidate the theoretical construction or the model's capacity to generate heavy tails.
Assumptions & free parameters
free parameters (5)
- β (imbalance sensitivity / inverse temperature) =
β=1 for GE, β=17 (or 8.5) for LCID, β=1,5,7.5 in simulations
- η (volatility scaling) =
η=0.75 (GE), η=2 (LCID), η=1,1.45,2.75 in simulations
- σ (volatility/diffusion coefficient in Eq. 45) =
σ=0.25, 0.3, 0.1, 0.05 across simulations; set equal to 2σ or ησ to match historical std
- Beta distribution parameters for imbalance =
Beta(4.5,4.5), Beta(0.5,0.5), Beta(2,2), Beta(8,2), Beta(1.5,1.5), Beta(6.733,3.267)
- Gamma distribution parameters for spread =
Γ(1,1) in simulation, Γ(4.88,0.03) for GE
assumptions (6)
- domain assumption Maximum entropy principle (Jaynes) selects the least-biased distribution
- domain assumption State probabilities depend only on TOB volume imbalance q (Assumption 3.1)
- ad hoc to paper Exponential tilt (Boltzmann) functional form with free β
- domain assumption Constant spread in the main dynamics (Section 5)
- ad hoc to paper Price evolves as a biased random walk with probabilities from Boltzmann (Eqs. 25-26)
- ad hoc to paper ϵ = S/2 (half spread) as the natural price step
Cite this review
Pith. "Pith review of Boltzmann Price: Toward Understanding the Fair Price in High-Frequency Markets." pith.science (2026). https://pith.science/paper/7LJU73JO
@misc{pith2026250709734,
  author       = {Pith},
  title        = {Pith review of: Boltzmann Price: Toward Understanding the Fair Price in High-Frequency Markets},
  year         = {2026},
  howpublished = {\url{https://pith.science/paper/7LJU73JO}},
  note         = {Machine review of arXiv:2507.09734}
}
read the original abstract
In this paper, we introduce a parametrized family of prices derived from the Maximum Entropy Principle. The price is obtained from the distribution that minimizes bias, given the bid and ask volume imbalance at the top of the order book. Under specific parameter choices, it closely approximates the mid-price or the weighted mid-price. Using probabilities of bid and ask states, we propose a model of price dynamics in which both drift and volatility are driven by volume imbalance. Compared to standard models like Bachelier or Geometric Brownian Motion with constant volatility, our model can generate higher kurtosis and heavy-tailed distributions. Additionally, the drift term naturally emerges as a consequence of the order book imbalance. We validate the model through simulation and demonstrate its fit to historical equity data. The model provides a theoretical framework, integrating price, volume imbalance, and spread.
Figures


Figures from the paper (12 more)



Reference graph
Works this paper leans on
-
[1]
A continuous and efficient fundamental price on the discrete order book grid
Julius Bonart and Fabrizio Lillo. A continuous and efficient fundamental price on the discrete order book grid. Physica A: Statistical Mechanics and its Applications, 503(C):698–713, 2018
2018
-
[2]
Liquidity and impact in fair markets
Thibault Jaisson. Liquidity and impact in fair markets. Market Microstructure and Liquidity, 01(02), 2015
2015
-
[3]
The micro-price: a high-frequency estimator of future prices
Sasha Stoikov. The micro-price: a high-frequency estimator of future prices. Quantitative Finance, 18(12):1959– 1966, 2018
1959
-
[4]
Hagströmer
B. Hagströmer. Bias in the effective bid-ask spread. Journal of Financial Economics, 142(1):314–337, 2021
2021
-
[5]
Trade arrival dynamics and quote imbalance in a limit order book
A. Lipton, U. Pesavento, and M. Sotiropoulos. Trade arrival dynamics and quote imbalance in a limit order book. arXiv:1312.0514, 12 2013
work page Pith review arXiv 2013
-
[6]
Limit order strategic placement with adverse selection risk and the role of latency
Charles-Albert Lehalle and Othmane Mounjid. Limit order strategic placement with adverse selection risk and the role of latency. Market Microstructure and Liquidity, 03(01):1750009, 2017
2017
-
[7]
Théorie de la spéculation
Louis Bachelier. Théorie de la spéculation. Annales scientifiques de l’École Normale Supérieure, 3e série, 17:21–86, 1900
1900
-
[8]
The pricing of options and corporate liabilities
Fischer Black and Myron Scholes. The pricing of options and corporate liabilities. Journal of Political Economy, 81(3):637–654, 1973
1973
Show all 86 references
-
[9]
Why do security prices change? a transaction-level analysis of nyse stocks
Ananth Madhavan, Matthew Richardson, and Mark Roomans. Why do security prices change? a transaction-level analysis of nyse stocks. The Review of Financial Studies, 10(4):1035–1064, 1997
1997
-
[10]
Robert and Mathieu Rosenbaum
Christian Y . Robert and Mathieu Rosenbaum. A new approach for the dynamics of ultra-high-frequency data: The model with uncertainty zones. Journal of Financial Econometrics, 9(2):344–366, 2011
2011
-
[11]
Robert, and Mathieu Rosenbaum
Sylvain Delattre, Christian Y . Robert, and Mathieu Rosenbaum. Estimating the efficient price from the order flow: A brownian cox process approach. Stochastic Processes and their Applications, 123(7):2603–2619, 2013
2013
-
[12]
Dealing with the inventory risk: a solution to the market making problem
Olivier Guéant, Charles-Albert Lehalle, and Joaquin Fernandez-Tapia. Dealing with the inventory risk: a solution to the market making problem. Mathematics and Financial Economics, 7(4):477–507, Sep 2013
2013
-
[13]
Toward a theory of marginally efficient markets
Yi-Cheng Zhang. Toward a theory of marginally efficient markets. Physica A: Statistical Mechanics and its Applications, 269(1):30–44, 1999. 28At least at Level I. Higher levels of the LOB are not considered in this analysis. 20
1999
-
[14]
Measuring market efficiency: The shannon entropy of high-frequency financial time series
Andrey Shternshis, Piero Mazzarisi, and Stefano Marmi. Measuring market efficiency: The shannon entropy of high-frequency financial time series. Chaos, Solitons & Fractals, 162, 2022
2022
-
[15]
Information thermodynamics of financial markets: the glosten–milgrom model
Léo Touzo, Matteo Marsili, and Don Zagier. Information thermodynamics of financial markets: the glosten–milgrom model. Journal of Statistical Mechanics: Theory and Experiment, 2021(3), mar 2021
2021
-
[16]
Glosten and Paul R
Lawrence R. Glosten and Paul R. Milgrom. Bid, ask and transaction prices in a specialist market with heteroge- neously informed traders. Journal of Financial Economics, 14(1):71–100, 1985
1985
-
[17]
Logarithmic market scoring rules for modular combinatorial information aggregation
Robin Hanson. Logarithmic market scoring rules for modular combinatorial information aggregation. Journal of Prediction Markets, 1, 2007
2007
-
[18]
Pennock, Daniel M
Abraham Othman, David M. Pennock, Daniel M. Reeves, and Tuomas Sandholm. A practical liquidity-sensitive automated market maker. ACM Transactions on Economics and Computation (TEAC), 1(3), September 2013
2013
-
[19]
Combinatorial information market design
Robin Hanson. Combinatorial information market design. Information Systems Frontiers, 5(1):107–119, January 2003
2003
-
[20]
Prediction markets
Justin Wolfers and Eric Zitzewitz. Prediction markets. Journal of Economic Perspectives, 18(2):107–126, June 2004
2004
-
[21]
Yiling Chen and David M. Pennock. A utility framework for bounded-loss market makers. In Proceedings of the Twenty-Third Conference on Uncertainty in Artificial Intelligence, UAI’07, page 49–56, Arlington, Virginia, USA, 2007. AUAI Press
2007
-
[22]
Optimizing the liquidity parameter of logarithmic market scoring rules prediction markets
Suparerk Lekwijit and Daricha Sutivong. Optimizing the liquidity parameter of logarithmic market scoring rules prediction markets. Journal of Modelling in Management, 13, 09 2018
2018
-
[23]
A logarithmic market scoring rule agent-based model to evaluate prediction markets
Athos Carvalho, Douglas Silveira, and Regis Ely. A logarithmic market scoring rule agent-based model to evaluate prediction markets. Journal of Evolutionary Economics, 33:1–41, 06 2023
2023
-
[24]
Price formation in field prediction markets: The wisdom in the crowd
Frederik Bossaerts, Nitin Yadav, Peter Bossaerts, Chad Nash, Torquil Todd, Torsten Rudolf, Rowena Hutchins, Anne-Louise Ponsonby, and Karl Mattingly. Price formation in field prediction markets: The wisdom in the crowd. Journal of Financial Markets, 68, 2024
2024
-
[25]
Almgren and Neil Chriss
Robert F. Almgren and Neil Chriss. Value under liquidation. Risk, 12:61–63, 1999
1999
-
[26]
Almgren and Neil Chriss
Robert F. Almgren and Neil Chriss. Optimal execution of portfolio transactions. Journal of Risk, 3:5–40, 2001
2001
-
[27]
Almgren and
Robert F. Almgren and. Optimal execution with nonlinear impact functions and trading-enhanced risk. Applied Mathematical Finance, 10(1):1–18, 2003
2003
-
[28]
Eugene Stanley
Xavier Gabaix, Parameswaran Gopikrishnan, Vasiliki Plerou, and H. Eugene Stanley. A theory of power-law distributions in financial market fluctuations. Nature, 423:267–270, 2003
2003
-
[29]
Price manipulation and quasi-arbitrage
Gur Huberman and Werner Stanzl. Price manipulation and quasi-arbitrage. Econometrica, 72(4):1247–1275, 2004
2004
-
[30]
Direct estimation of equity market impact
Robert Almgren, Chee Thum, Emmanuel Hauptmann, and Hong Li. Direct estimation of equity market impact. Risk, 18, 04 2005
2005
-
[31]
Relation between bid–ask spread, impact and volatility in order-driven markets
Matthieu Wyart, Jean-Philippe Bouchaud, Julien Kockelkoren, Marc Potters, and Michele Vettorazzo. Relation between bid–ask spread, impact and volatility in order-driven markets. Quantitative Finance, 8(1):41–57, 2008
2008
-
[32]
Doyne Farmer, and Fabrizio Lillo
Jean-Philippe Bouchaud, J. Doyne Farmer, and Fabrizio Lillo. How markets slowly digest changes in supply and demand. In Thorsten Hens and Klaus Reiner Schenk-Hoppé, editors, Handbook of Financial Markets: Dynamics and Evolution, Handbooks in Finance, pages 57–160. Elsevier, Sa...
2009
-
[33]
No-dynamic-arbitrage and market impact
Jim Gatheral. No-dynamic-arbitrage and market impact. Quantitative Finance, 10(7):749–759, 2010
2010
-
[34]
The price impact of order book events: market orders, limit orders and cancellations
Zoltán Eisler, Jean-Philippe Bouchaud, and Julien and Kockelkoren. The price impact of order book events: market orders, limit orders and cancellations. Quantitative Finance, 12(9):1395–1419, 2012
2012
-
[35]
The market impact of a limit order
Nikolaus Hautsch and Ruihong Huang. The market impact of a limit order. Journal of Economic Dynamics and Control, 36(4):501–522, 2012
2012
-
[36]
Permanent market impact can be nonlinear
Olivier Guéant. Permanent market impact can be nonlinear. Papers 1305.0413, arXiv.org, May 2013
2013 arXiv
-
[37]
Doyne Farmer, Austin Gerig, Fabrizio Lillo, and Henri Waelbroeck
J. Doyne Farmer, Austin Gerig, Fabrizio Lillo, and Henri Waelbroeck. How efficiency shapes market impact. Quantitative Finance, 13(11):1743–1758, 2013
2013
-
[38]
Market impacts and the life cycle of investors orders
Emmanuel Bacry, Adrian Iuga, Matthieu Lasnier, and Charles-Albert Lehalle. Market impacts and the life cycle of investors orders. Market Microstructure and Liquidity, 01(02), 2015
2015
-
[39]
Agent-based models for latent liquidity and concave price impact
Iacopo Mastromatteo, Bence Tóth, and Jean-Philippe Bouchaud. Agent-based models for latent liquidity and concave price impact. Phys. Rev. E, 89:042805, Apr 2014. 21
2014
-
[40]
A fully consistent, minimal model for non-linear market impact
Jonathan Donier, Julius Bonart, Iacopo Mastromatteo, and Jean-Philippe Bouchaud. A fully consistent, minimal model for non-linear market impact. Quantitative Finance, 15(7):1109–1121, 2015
2015
-
[41]
Doyne Farmer, and Fabrizio Lillo
Elia Zarinelli, Michele Treccani, J. Doyne Farmer, and Fabrizio Lillo. Beyond the square root: Evidence for logarithmic dependence of market impact on size and participation rate. Market Microstructure and Liquidity, 01(02), 2015
2015
-
[42]
Market impact: A systematic study of limit orders
Emilio Said, Ahmed Bel Hadj Ayed, Alexandre Husson, and Frédéric Abergel. Market impact: A systematic study of limit orders. Market Microstructure and Liquidity, 03(03n04), 2017
2017
-
[43]
Price impact in a latent order book
Ismael Lemhadri. Price impact in a latent order book. Market Microstructure and Liquidity, 05(01n04), 2019
2019
-
[44]
Market impact of small orders
Oleh Danyliv. Market impact of small orders. arXiv preprint arXiv:2201.02983, 2022
2022 arXiv
-
[45]
M. G. Kendall. The analysis of economic time-series-part i: Prices. Journal of the Royal Statistical Society. Series A (General), 116(1):11–34, 1953
1953
-
[46]
The variation of certain speculative prices
Benoit Mandelbrot. The variation of certain speculative prices. The Journal of Business, 36(4):394–419, 1963
1963
-
[47]
Benoit Mandelbrot and Howard M. Taylor. On the distribution of stock price differences. Operations Research, 15(6):1057–1062, 1967
1967
-
[48]
Eugene F. Fama. Efficient capital markets: A review of theory and empirical work. The Journal of Finance, 25(2):383–417, 1970
1970
-
[49]
A conditionally heteroskedastic time series model for speculative prices and rates of return
Tim Bollerslev. A conditionally heteroskedastic time series model for speculative prices and rates of return. The Review of Economics and Statistics, 69(3):542–547, 1987
1987
-
[50]
Andersen
Torben G. Andersen. Return volatility and trading volume: An information flow interpretation of stochastic volatility. The Journal of Finance, 51(1):169–204, 1996
1996
-
[51]
Statistical aspects of ARCH and stochastic volatility, pages 1–67
Neil Shephard. Statistical aspects of ARCH and stochastic volatility, pages 1–67. Chapman & Hall, London, (edited by d.r. cox, david v. hinkley and ole e. barndorff-neilsen) edition, 1996. Reprinted in the Survey of Applied and Industrial Mathematics, issue on Financial and in...
1996
-
[52]
Modelling extremal events: for insurance and finance
Paul Embrechts, Thomas Mikosch, and Claudia Klüppelberg. Modelling extremal events: for insurance and finance. Springer-Verlag, Berlin, Heidelberg, 1997
1997
-
[53]
Gopikrishnan, M
P. Gopikrishnan, M. Meyer, L. A. N. Amaral, and H. E. Stanley. Inverse cubic law for the distribution of stock price variations. The European Physical Journal B - Condensed Matter and Complex Systems, 3(2):139–140, May 1998
1998
-
[54]
Scaling and criticality in a stochastic multi-agent model of a financial market
Thomas Lux and Michele Marchesi. Scaling and criticality in a stochastic multi-agent model of a financial market. Nature, 397:498–500, Feb 1999
1999
-
[55]
Mittnik, S.T
S. Mittnik, S.T. Rachev, T. Doganoglu, and D. Chenyao. Maximum likelihood estimation of stable paretian models. Mathematical and Computer Modelling, 29(10):275–293, 1999
1999
-
[56]
McNeil and Rüdiger Frey
Alexander J. McNeil and Rüdiger Frey. Estimation of tail-related risk measures for heteroscedastic financial time series: an extreme value approach. Journal of Empirical Finance, 7(3-4):271–300, November 2000
2000
-
[57]
Empirical properties of asset returns: stylized facts and statistical issues
Rama Cont. Empirical properties of asset returns: stylized facts and statistical issues. Quantitative Finance, 1(2):223–236, 2001
2001
-
[58]
Koedijk, Clemens J
Ronald Huisman, Kees G. Koedijk, Clemens J. M. Kool, and Franz Palm. Tail-index estimates in small samples. Journal of Business & Economic Statistics, 19(2):208–216, 2001
2001
-
[59]
Theory of Financial Risk and Derivative Pricing: From Statistical Physics to Risk Management
Jean-Philippe Bouchaud and Marc Potters. Theory of Financial Risk and Derivative Pricing: From Statistical Physics to Risk Management. Cambridge University Press, 2 edition, 2003
2003
-
[60]
Bradley and Murad S
Brendan O. Bradley and Murad S. Taqqu. Financial risk and heavy tails. In Svetlozar T. Rachev, editor,Handbook of Heavy Tailed Distributions in Finance, volume 1 of Handbooks in Finance, pages 35–103. North-Holland, Amsterdam, 2003
2003
-
[61]
Chavez-Demoulin and J.A
V . Chavez-Demoulin and J.A. McGill. High-frequency financial data modeling using hawkes processes.Journal of Banking & Finance, 36(12):3415–3426, 2012. Systemic risk, Basel III, global financial stability and regulation
2012
-
[62]
Statistical consequences of fat tails: Real world preasymptotics, epistemology, and applications
Nassim Nicholas Taleb. Statistical consequences of fat tails: Real world preasymptotics, epistemology, and applications. Papers 2001.10488, arXiv.org, Jan 2020
2001
-
[63]
Andersen and Luca Benzoni
Torben G. Andersen and Luca Benzoni. Stochastic V olatility, pages 8783–8815. Springer New York, New York, NY , 2009
2009
-
[64]
R.S. Tsay. Analysis of Financial Time Series. John Wiley & Sons, 3 edition, 2010. 22
2010
-
[65]
Stochastic V olatilityModeling
Lorenzo Bergomi. Stochastic V olatilityModeling. CRC Press, 1 edition, 2015
2015
-
[66]
Guiasu and A
S. Guiasu and A. Shenitzer. The principle of maximum entropy. The Mathematical Intelligencer, 7:42–48, 1985
1985
-
[67]
E. T. Jaynes. Information theory and statistical mechanics. Phys. Rev., 106(4):620–630, 1957
1957
-
[68]
Discovering market prices: Which price formation model best predicts the next trade? Blockchain Research Lab Working Paper Series, No
André Meyer and Ingo Fiedler. Discovering market prices: Which price formation model best predicts the next trade? Blockchain Research Lab Working Paper Series, No. 2., 2019
2019
-
[69]
Eugene F. Fama. Random walks in stock market prices. Financial Analysts Journal, 51(1):75–80, 1995
1995
-
[70]
Eugene F. Fama. The behavior of stock-market prices. The Journal of Business, 38(1):34–105, 1965
1965
-
[71]
James Press
S. James Press. A compound events model for security prices. The Journal of Business, 40(3):317–335, 1967
1967
-
[72]
Mark S. Joshi. The Concepts And Practice Of Mathematical Finance. Mathematics, Finance and Risk. Cambridge University Press, 2008
2008
-
[73]
A simple implicit measure of the effective bid-ask spread in an efficient market
Richard Roll. A simple implicit measure of the effective bid-ask spread in an efficient market. Journal of Finance, 39(4):1127–1139, September 1984
1984
-
[74]
The price impact of order book events
Rama Cont, Arseniy Kukanov, and Sasha Stoikov. The price impact of order book events. Journal of Financial Econometrics, 12(1):47–88, 2014
2014
-
[75]
Gould and Julius Bonart
Martin D. Gould and Julius Bonart. Queue imbalance as a one-tick-ahead price predictor in a limit order book. Market Microstructure and Liquidity, 02(02):1650006, 2016
2016
-
[76]
Doyne Farmer
Bence Tóth, Imon Palit, Fabrizio Lillo, and J. Doyne Farmer. Why is equity order flow so persistent? Journal of Economic Dynamics and Control, 51(C):218–239, 2015
2015
-
[77]
Øksendal
B. Øksendal. Stochastic Differential Equations: An Introduction with Applications. Universitext. Springer Berlin Heidelberg, 2010
2010
-
[78]
Andrew W. Lo, A. Craig MacKinlay, and June Zhang. Econometric models of limit-order executions. Journal of Financial Economics, 65(1):31–71, July 2002
2002
-
[79]
The Financial Mathematics of Market Liquidity: From Optimal Execution to Market Making
Olivier Guéant. The Financial Mathematics of Market Liquidity: From Optimal Execution to Market Making. CRC Press - Taylor and Francis, 2016
2016
-
[80]
Market liquidity and trading activity
Tarun Chordia, Richard Roll, and Avanidhar Subrahmanyam. Market liquidity and trading activity. The Journal of Finance, 56(2):501–530, 2001
2001
-
[81]
Illiquidity and stock returns: cross-section and time-series effects
Yakov Amihud. Illiquidity and stock returns: cross-section and time-series effects. Journal of Financial Markets, 5(1):31–56, 2002
2002
-
[82]
Fat tails in financial return distributions revisited: Evidence from the korean stock market
Cheoljun Eom, Taisei Kaizoji, and Enrico Scalas. Fat tails in financial return distributions revisited: Evidence from the korean stock market. Papers 1904.02567, arXiv.org, April 2019
1904 arXiv
-
[83]
Ball and Tarun Chordia
Clifford A. Ball and Tarun Chordia. True spreads and equilibrium prices. The Journal of Finance, 56(5):1801– 1835, 2001
2001
-
[84]
Continuous auctions and insider trading
Albert Kyle. Continuous auctions and insider trading. Econometrica, 53(6):1315–35, 1985
1985
-
[85]
Dimitris Bertsimas and Andrew W. Lo. Optimal control of execution costs. Journal of Financial Markets, 1(1):1–50, 1998
1998
-
[86]
mn + ϵn Sn 2 − P boltzmann n+ℓ # (83) Using Lemma 4.1, we have: Gboltzmann L (n, n+ ℓ) ≈ vϵn
Álvaro Cartea, Sebastian Jaimungal, and José Penalva. Algorithmic and High-Frequency Trading. Cambridge University Press, 10 2015. 10 Appendix 10.1 Micro-Price As an alternative to the mid-price and the weighted mid-price, Stoikov [3] proposed the micro-price as a proxy for th...
2015
Reviewed August 6, 2026 · model on record in the stance chip above.
Discussion (0). Continue with ORCID to comment.