REVIEW 3 major objections 4 minor 31 references
Testing the influence of anisotropic CR transport and the Galactic magnetic field structure on the all-sky gamma-ray emission
T0 review · 3 major / 4 minor · reviewed 2026-08-06 · deepseek-v4-flash
Pith's one-line read The paper claims that the all-sky gamma-ray emission from hadronic cosmic-ray interactions shifts measurably with the anisotropy of cosmic-ray diffusion, with the inner Galaxy dimming and the outer Galaxy brightening as diffusion becomes…
desk verdict Useful template paper: the inner/outer gamma-ray contrast from anisotropic diffusion is real in UF23, but its robustness across GMF models is untested and should be the main referee target. read the letter →
The pith
A machine-rendered reading of the paper's core claim, the machinery that carries it, and where it could break.
The reading
What carries the argument
The central object is the anisotropic-diffusion ratio $\epsilon = D_\perp/D_\parallel$, the ratio of cosmic-ray diffusion perpendicular to and along the local Galactic magnetic field. The argument carries it through a 3+1-dimensional stochastic differential equation solution of cosmic-ray diffusion, with a parallel diffusion coefficient that follows a fitted broken power law in energy and a perpendicular coefficient equal to $\epsilon$ times that value, and then through a line-of-sight integral of the resulting proton flux against the gas distribution with a hadronic production cross section. The work this machinery does is to convert the single parameter $\epsilon$ into a spatial pattern: because field lines leave the disc in the inner Galaxy but lie in the plane in the outer Galaxy, smaller $\epsilon$ dims the inner Galaxy, brightens the outer Galaxy, and at $10^{-3}$ confines cosmic rays so strongly to spiral arms that the integrated emission drops.
What would settle it
Run the same transport and gamma-ray calculation with an alternative large-scale field model whose geometry differs substantially; if the inner/outer brightness contrast does not change sign or position, the magnetic-field-geometry mechanism proposed here is wrong. Alternatively, measure the 1 TeV inner-to-outer Galactic disc intensity ratio after masking resolved sources and compare with the $\epsilon = 10^{-1}$ and $\epsilon = 10^{-2}$ predictions: a ratio that matches neither, or that varies with longitude in a way the modeled field cannot produce, would falsify the claim.
Extended reading notes
Core claim
On the paper's own terms, the central discovery is that the spatial distribution of diffuse hadronic gamma-ray emission is a sensitive probe of anisotropic cosmic-ray transport. Lowering $\epsilon$ from $10^{-1}$ to $10^{-2}$ raises the predicted gamma-ray intensity in the outer Galactic disc and lowers it in the inner Galactic disc, and lowering it to $10^{-3}$ suppresses the all-sky emission as a whole. The mechanism is the geometry of the adopted Galactic magnetic field: in the inner Galaxy field lines point out of the disc, so parallel-dominated cosmic rays escape quickly and produce fewer gamma rays, while in the outer Galaxy field lines lie inside the disc, so confinement and gamma-ray production increase. Because the same source model fits the observed local cosmic-ray spectrum for all three values of $\epsilon$, the paper concludes that the anisotropy is invisible in the local spectrum but visible on the sky.
Load-bearing premise
The load-bearing premise is that the adopted baseline Galactic magnetic field model (labelled UF23) has the right large-scale geometry, specifically field lines that point out of the disc in the inner Galaxy and lie in the plane in the outer Galaxy; if the real field geometry differs, the predicted inner-dimmer/outer-brighter contrast could shrink, shift, or reverse.
Editorial extensions
If this is right
- Matching the local cosmic-ray proton spectrum cannot constrain the diffusion anisotropy, while matching gamma-ray morphology can.
- For smaller $\epsilon$, the inner-to-outer Galactic gamma-ray intensity ratio at 1 TeV should fall at fixed gas column, giving a concrete, spatially resolved prediction.
- At $\epsilon = 10^{-3}$, the model predicts a global suppression of hadronic gamma-ray brightness relative to more isotropic transport, a signature that can be compared with all-sky intensity measurements.
- The spectral energy distributions in inner and outer sky regions stay close to the observed band for all tested anisotropies, so the anisotropy should be sought in maps rather than spectral slopes.
- The same hadronic interactions produce neutrinos, so the predicted anisotropy-dependent spatial pattern transfers to the neutrino sky and can be checked against Galactic-plane neutrino measurements.
Reading between the lines
- Inference: because the sign of the predicted contrast is set by field-line geometry, replacing the adopted large-scale field model with an alternative geometry (the paper shows two viable models with visibly different fields) could weaken, reverse, or relocate the inner/outer asymmetry, so gamma-ray maps can also discriminate among field models.
- Inference: the local cosmic-ray spectrum leaves $\epsilon$ degenerate with the source distribution, but adding secondary-to-primary ratios such as boron-to-carbon would break that degeneracy; the paper does not compute them, but its transport solution could.
- Inference: if the spiral-arm confinement at $\epsilon = 10^{-3}$ is real, gamma-ray emissivity per unit gas should be much lower between arms than inside arms; a targeted comparison along arm and inter-arm sight lines would test this directly.
- Inference: since leptonic emission is neglected, the hadronic component at GeV energies could be isolated by subtracting inverse-Compton and bremsstrahlung templates from all-sky maps; the residual should then show the predicted $\epsilon$-dependent inner/outer asymmetry.
Editorial analysis
A structured set of objections, weighed in public.
Referee Report
Summary. The manuscript presents CRPropa simulations of anisotropic diffusive transport of cosmic-ray protons in the Milky Way, using the UF23 baseline Galactic magnetic field model and three values of the anisotropy ratio epsilon = D_perp/D_parallel (10^-1, 10^-2, 10^-3). The injection spectrum is fitted to local CR proton observations, and the resulting 3D CR distribution is used together with the HERMES line-of-sight integrator to compute all-sky gamma-ray maps at 1 TeV and spectral energy distributions in four Galactic-plane regions. The authors report that decreasing epsilon dims the inner Galaxy and brightens the outer Galaxy, that epsilon = 10^-3 globally suppresses gamma-ray production, and that the SEDs are broadly compatible with TibetAS-gamma, ARGO, and LHAASO data.
Significance. If robust, the result would provide a useful demonstration that all-sky hadronic gamma-ray maps can, in principle, constrain both the diffusion anisotropy and the large-scale GMF geometry, complementing local CR spectral fits. The use of publicly available CRPropa and HERMES, the explicit scan over epsilon, and the clear side-by-side maps are strengths. However, the central claim currently rests on a single GMF model, and the simulated maps and SEDs are presented without uncertainty estimates, so the quantitative generality of the result is not yet established.
major comments (3)
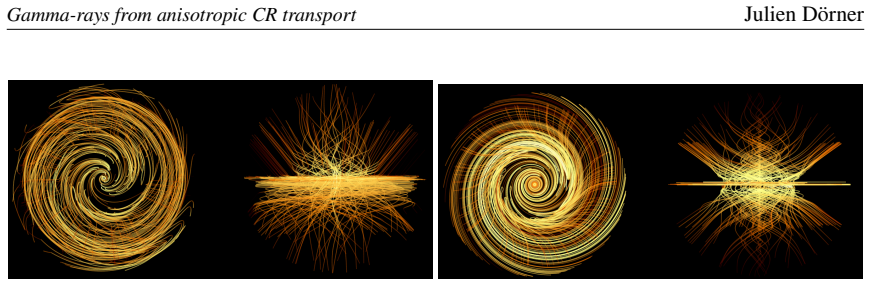
- [Section 2 and Section 4, Fig. 4] The central spatial effect (inner Galaxy dimmer, outer Galaxy brighter for lower epsilon) is explained in Section 4 by the orientation of field lines in the UF23 baseline model. The authors state in Section 2 that JF12 and UF23 "show significant differences in the shape" and explicitly defer tests of other GMF models to future work, but all transport runs in Section 3 and all maps in Figs. 3-5 use only the UF23 baseline. Since anisotropic diffusion follows the local field direction, a different GMF geometry could reduce, reverse, or relocate the effect. Please run at least one alternative GMF model (e.g., the solenoidal JF12 shown in Fig. 1) for epsilon = 10^-2 and 10^-3 and compare the ratio maps, or alternatively restrict the conclusions in the abstract and summary to the UF23 baseline model.
- [Section 4, Figs. 3-5] The simulated all-sky maps and SEDs are presented without statistical or systematic uncertainties. The differences in the relative maps in Fig. 4 are of order tens of percent, while the SDE simulation has finite particle statistics and the source injection parameters are refitted for each epsilon case; part of the contrast between models could therefore reflect shot noise or normalization differences rather than the physical mechanism. Please provide an estimate of the pixel-level statistical uncertainty in the ratio maps (for example, from bootstrap resampling or from the number of simulated particles per spatial cell), or at least state the statistical precision explicitly.
- [Section 4, Fig. 5 and SED comparison] The comparison with observed SEDs is only qualitative: no point-source masking is applied to the simulated maps while the observations mask sources, and a factor-of-2 allowance for heavier nuclei is invoked post hoc to absorb the normalization deficit. The statement that the observed gamma-ray spectra are "in agreement" with the prediction therefore overstates the constraining power of the comparison. Please either apply a source mask to the simulation maps or explicitly state that the comparison is indicative only, with the normalization uncertainty dominated by unmodelled nuclei and unmasked sources.
minor comments (4)
- [Section 2, Fig. 1] The caption contains the typo "pannel" instead of "panel".
- [References, Ref. [9]] The reference to Jansson & Farrar (2012) is misspelled as "Ransson, G. Farrar"; it should be "Jansson, R." and "Farrar, G.".
- [Section 4, Fig. 5 axis label] The horizontal axis label in Fig. 5 reads "Energy [T eV]"; it should read "Energy [TeV]".
- [Section 4, paragraph after Eq. (3)] The sentence "All predictions are slightly below the measured fluxes, which can be expected as the model presented here, contains only protons" has an ungrammatical comma after "here"; please rephrase for clarity.
Circularity Check
No significant circularity: the gamma-ray maps are forward predictions from hand-chosen anisotropy parameters, with local CR data used only for calibration.
full rationale
This is a forward-modeling study, not a fit-derived prediction. The anisotropy parameter eps is chosen by hand over a grid of values (10^-1, 10^-2, 10^-3) and is never fitted to the gamma-ray data. The source injection spectrum is fitted to local cosmic-ray observations (AMS, PAMELA, CALET, DAMPE, CREAM, IceTop, LHAASO, GRAPES-3) and the parallel diffusion coefficient is taken from a previous fit to GCR data [13]; neither calibration step uses the all-sky gamma-ray maps or the SED comparisons in Figs. 3-5. The gamma-ray emission is therefore a genuine prediction of the transport model, and the agreement with LHAASO, TibetASgamma, and ARGO data is a post-hoc comparison that does not feed back into the model. The self-citations to [3], [8], [13], and [14] provide physical motivation, a previous CMZ study, a fit to external data, and publicly available simulation code; none of these is an unverified uniqueness theorem or an ansatz smuggled in to force the central conclusion. The use of only the UF23 baseline GMF is a model-dependence limitation that the authors explicitly acknowledge, but it is not a circularity: the inner/outer contrast is a direct consequence of solving the transport equations with that field, not an input-equivalent restatement. No equation in the paper reduces to its own input, and no fitted parameter is renamed as a prediction.
Assumptions & free parameters
free parameters (12)
- epsilon (D_perp/D_parallel) =
10^-1, 10^-2, 10^-3 (chosen, not fitted)
- D_parallel normalization D0 =
from ref [13], value not quoted in text
- D_parallel break energy E_br =
64.38 GeV
- D_parallel low-energy index gamma1 =
0.335
- D_parallel high-energy index gamma2 =
-0.321
- Source injection normalization Q0 =
fitted to local CR data (value not stated)
- Source injection break momentum p_br =
fitted; corresponds to a break near 10 TeV
- Source injection low-energy index alpha1 =
fitted (value not stated)
- Source injection high-energy index alpha2 =
fitted (value not stated)
- Source injection smoothness parameter w =
fitted (value not stated)
- Halo height H =
4 kpc
- Disk radius R =
20 kpc
assumptions (8)
- domain assumption The UF23 baseline GMF model is a sufficient description of the large-scale magnetic field geometry for CR transport.
- domain assumption The diffusion tensor is fully specified by a single constant ratio epsilon = D_perp/D_parallel at all positions and energies.
- domain assumption The parallel diffusion coefficient from the one-dimensional streaming-instability model (Eq. 1), fitted in ref [13], applies throughout the Milky Way.
- domain assumption Galactic CR sources follow the pulsar distribution of ref [16].
- domain assumption The steady-state CR distribution is obtained by summing burst injection snapshots with purely diffusive transport, neglecting energy losses, convection, and reacceleration.
- domain assumption The local CR spectra observed by AMS, PAMELA, CALET, DAMPE, ISS-CREAM, IceTop, GRAPES-3, and LHAASO are representative of the interstellar proton spectrum.
- domain assumption The gas distributions provided by HERMES (HI and H2 ring models) are accurate enough for line-of-sight gamma-ray integration.
- domain assumption The AAfrag hadronic interaction model gives accurate differential pp -> gamma cross sections over the relevant energy range.
Cite this review
Pith. "Pith review of Testing the influence of anisotropic CR transport and the Galactic magnetic field structure on the all-sky gamma-ray emission." pith.science (2026). https://pith.science/paper/IKS5IH6F
@misc{pith2026250712074,
  author       = {Pith},
  title        = {Pith review of: Testing the influence of anisotropic CR transport and the Galactic magnetic field structure on the all-sky gamma-ray emission},
  year         = {2026},
  howpublished = {\url{https://pith.science/paper/IKS5IH6F}},
  note         = {Machine review of arXiv:2507.12074}
}
abstract
The spatial diffusion of energetic particles in a magnetic field composed of a large-scale background and a small-scale turbulent component should be expected to be anisotropic. While such anisotropic diffusion has been known for quite a while in first-principle plasma physics and while it is required for an understanding of the transport of cosmic rays in the heliosphere or close to supernova remnants, only in recent years it has also become of particular interest for the modeling of Galactic cosmic ray (GCR) transport in the Milky Way in the context of their residence time and their (local) energy spectra. Also, the large-scale spatial distribution of GCRs is shaped by an anisotropic diffusion in the Galactic magnetic field, which should directly affect both the diffuse gamma-ray and the neutrino emission. We solve the anisotropic diffusive transport of GCRs in the Milky Way using the publicly available transport code CRPropa. The anisotropy of the diffusion is characterized by the ratio between the diffusion coefficient perpendicular and parallel to the local magnetic field $\epsilon = D_\perp / D_\parallel$, where we test different values reaching from nearly parallel transport ($\epsilon = 10^{-3}$) to more isotropic diffusion ($\epsilon = 10^{-1}$). From the three dimensional distribution of GCRs in the Milky Way we calculate the all-sky gamma-ray emission, using the line-of-sight integration framework HERMES. Finally, we demonstrate the impact of the anisotropy in the diffusion on the spatial distribution of the gamma-ray flux and its spectral energy distribution. It shows strong influences by the anisotropy of the diffusion and the magnetic field geometry.
Figures


Figures from the paper (2 more)


Reference graph
Works this paper leans on
- [1]
- [2]
- [3]
-
[4]
F. Effenberger, H. Fichtner, K. Scherer, I. Büsching A&A541 A120 (2012)
work page 2012
- [5]
- [6]
-
[7]
S. S. Cerri, D. Gaggero, A. Vittinoet al. JCAP 10019 (2017)
work page 2017
- [8]
Show all 31 references
-
[9]
Ransson, G
R. Ransson, G. Farrar ApJL761 L11 (2012)
2012
-
[10]
Kleimann, T
J. Kleimann, T. Schorlepp, L. Merten, J Becker Tjus ApJ877 76 (2019)
2019
-
[11]
Unger, G
M. Unger, G. Farrar ApJ970 95 (2024)
2024
-
[12]
Blasi, E
P. Blasi, E. Amato, P. Serpico PRL109 061101 (2012)
2012
-
[13]
Dörner PhD Thesis, Ruhr-Universität Bochum (2025)
J. Dörner PhD Thesis, Ruhr-Universität Bochum (2025)
2025
-
[14]
Alves Batista, J
R. Alves Batista, J. Becker Tjus, J. Dörneret al. JCAP 09 035 (2022)
2022
-
[15]
Merten, J
L. Merten, J. Becker Tjus, H. Fichtneret al. JCAP 06 046 (2017)
2017
-
[16]
Blasi, E
P. Blasi, E. Amato JCAP01010 (2012)
2012
-
[17]
Aguilar, L
M. Aguilar, L. Ali Cavasonza, B. Alpatet al. PRL 117 091103 (2016)
2016
-
[18]
Adriani, G
O. Adriani, G. C. Barbarino, G. A. Bazilevskayaet al. ApJ 765 91 (2013)
2013
-
[19]
Adriani, Y
O. Adriani, Y. Asano, K. Asanoet al. PRL 129101102 (2022)
2022
-
[20]
G. H. Choi, E. S. Seo, S. Amareet al. ApJ 940 107 (2022)
2022
-
[21]
DAMPE Collaborationet al. Sci. Adv.5 eaax3793 (2019)
2019
-
[22]
IceCube Collaboration: M. G. Aartsenet al. PRD 100 082002 (2019)
2019
-
[23]
Varsiet al
GRAPES-3 Collaboration: F. Varsiet al. PRL 132 051002 (2024)
2024
-
[24]
Caoet al
The LHASSO Collaboration: Z. Caoet al. eprint arXiv: 2505.14447
-
[25]
Dundovic, C
A. Dundovic, C. Evoli, D. Gaggero, D. Grasso A&A653 A18 (2021)
2021
-
[26]
Kachelrieß, S
M. Kachelrieß, S. Ostapchenko, J. Tjemsland CPC287 108698 (2023)
2023
-
[27]
Caoet al
The LHASSO Collaboration: Z. Caoet al. PRL 131 151001 (2023)
2023
-
[28]
Amenomoriet al
Tibet AS𝛾 Collaboration: M. Amenomoriet al. PRL 126141101 (2021)
2021
-
[29]
Bartoli, P
B. Bartoli, P. Bernardini, X. J. Biet al. ApJ 806 20 (2015)
2015
-
[30]
L. E. Espinosa Castro, F. L. Villante, V. Vecchiottiet al eprint arXiV: 2506.06593
-
[31]
Abbasiet al
IceCube Collaboration: R. Abbasiet al. Science 380 6652 (2023) 8
2023
Reviewed August 6, 2026 · model on record in the stance chip above.
Discussion (0). Sign in to comment.