REVIEW 4 major objections 5 minor 64 references
Solar Chromospheric Network as a Source for Solar Wind Switchbacks
T0 review · 4 major / 5 minor · reviewed 2026-08-06 · deepseek-v4-flash
Pith's one-line read The paper argues that the medium scale of Parker Solar Probe switchbacks, roughly 0.08–0.7 degrees, is set by the spacing of chromospheric network flux tubes after random walk redistributes them inside supergranule-scale magnetic funnels.
desk verdict New spicule spacing measurements are worth attention, but the paper's central scale-linking relation rests on an equal-spacing assumption, not the random walk it invokes, and the abstract/body numbers disagree. read the letter →
The pith
A machine-rendered reading of the paper's core claim, the machinery that carries it, and where it could break.
The reading
What carries the argument
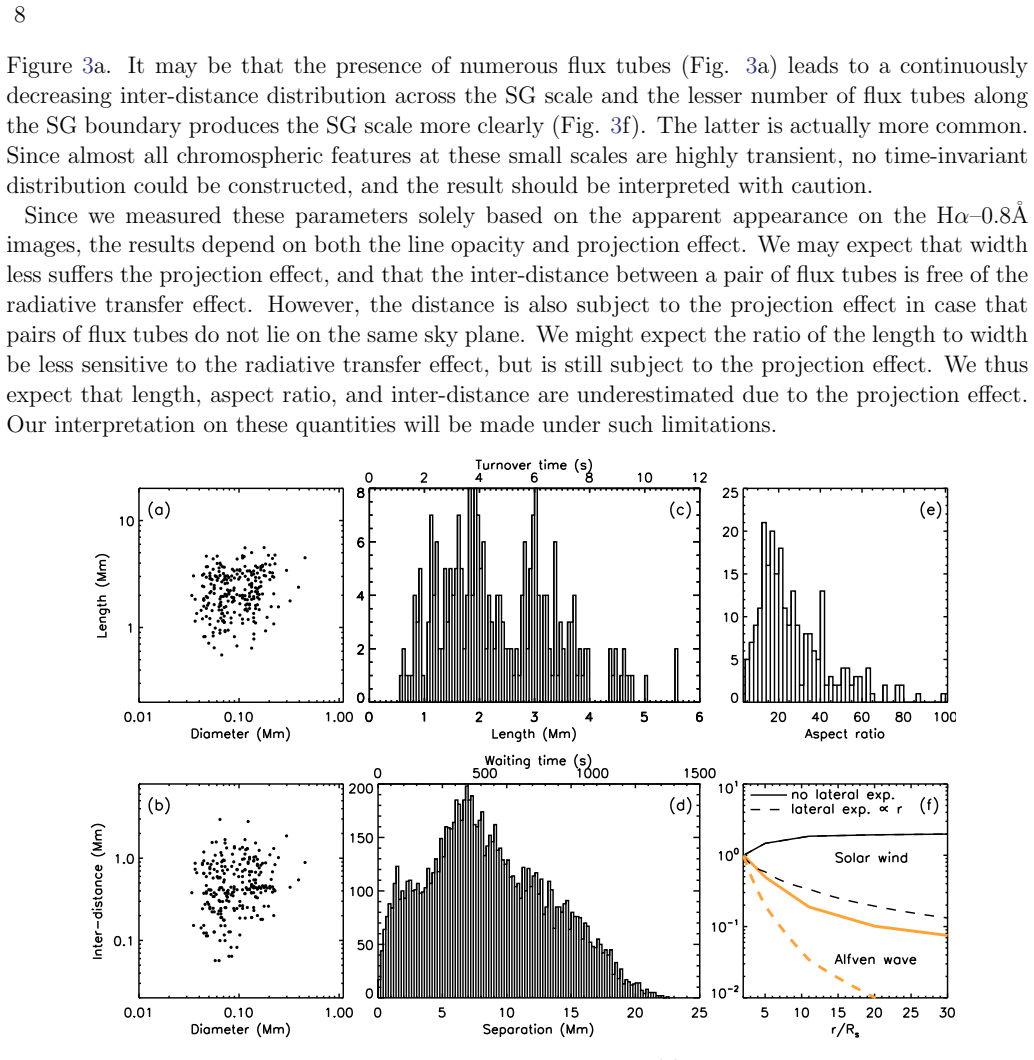
The load-bearing object is the chromospheric network flux tube as seen in H-$\alpha$ blue-wing images, treated as the seed of a switchback, and the geometric accounting of its spacing. The analysis counts only the thin elongated features along one network boundary, measures the dense section's length and diameter, and builds two inter-distance statistics: intervals between adjacent spicules and distances between all pairs. The random-walk redistribution hypothesis is the mechanism that carries the argument: it converts the measured surface spacing into the in-situ spacing by assuming flux tubes fill the supergranule funnel, so the relation $d = D/N^{1/2}$ links the large and medium switchback scales. The high measured aspect ratio (6–40) and number per network (40–100) complete the case that the chromospheric structures can supply both the shape and the multiplicity of switchbacks.
What would settle it
Trace individual flux tubes from one chromospheric network boundary through a turbulence transport model to the Parker Solar Probe height near 30 solar radii and check whether the rms lateral displacement is large enough to distribute $N$ tubes uniformly across the funnel; if the mixing is incomplete, the predicted nearest-neighbor spacing $d = D/N^{1/2}$ fails and the medium scale would instead track the original footpoint spacing. A spacecraft crossing a single identified funnel should also detect roughly $N$ switchbacks with spacings near $d$; observing only one or two per funnel would falsify the mechanism.
Extended reading notes
Core claim
The central claim, stated in §3.4, is that the medium scale of switchbacks can be understood as an equilibrium distance resulting from random walk within each diverging magnetic field funnel connected to the chromospheric network. Spicules counted in H-$\alpha$ blue-wing images stand along the network boundary, and their measured inter-distances tend to be smaller than the medium switchback scale. Assuming flux tubes are completely rearranged by stochastic meandering so they fill the funnel, the mean nearest-neighbor spacing satisfies $d = D/N^{1/2}$; using the large switchback scale $D = 1.1\unicode{x2013}4.4$ degrees and $N = 40\unicode{x2013}100$ gives $d = 0.11\unicode{x2013}0.7$ degrees, matching the medium scale. The paper therefore argues that the medium scale is an equilibrium scale set by how many flux tubes populate a funnel, not an intrinsic granule size, and that this is consistent with the aspect ratio of switchbacks if flux tubes already possess dense sections with length-to-diameter ratios of 6–40.
Load-bearing premise
The load-bearing premise, which the paper itself labels an ad hoc assumption in §3.4, is that flux tubes rooted along the chromospheric network are completely rearranged by random walk inside the supergranule funnel, so that the mean spacing in space is $D/N^{1/2}$; if the rearrangement is incomplete, a spacecraft would cross only one or two flux tubes and the claimed equilibrium scale would not follow.
Editorial extensions
If this is right
- If the central claim is correct, the medium scale of switchbacks is not a direct image of granulation but an equilibrium spacing set by the number of flux tubes per supergranule funnel, $d = D/N^{1/2}$.
- The count $N$ of network flux tubes becomes a measurable solar quantity that predicts in-situ switchback spacing: 40–100 spicules per funnel yields spacings in the observed medium-scale range.
- Switchbacks would carry a solar-source imprint from chromospheric network geometry, supporting the idea that at least the medium-scale component of switchbacks originates in the Sun rather than being purely generated in transit.
- Because the chromospheric inter-distance distributions do not show the scale-free power law seen in switchback waiting times, the statistics of switchback occurrence must be substantially reshaped by in-transit processes such as aggregation and cascade.
- The high aspect ratio of switchbacks would require flux tubes to leave the Sun already elongated, since a simple transit model shows the aspect ratio can increase only modestly before reaching Parker Solar Probe heights.
Reading between the lines
- A testable extension is to apply the $d = D/N^{1/2}$ relation to other tracers of open flux, such as jetlets or plumelets rooted on network boundaries; if the relation is generic, their in-situ spacing should obey the same equilibrium curve without invoking switchback-specific physics.
- The model implies that within a single funnel the waiting-time distribution of switchbacks should show a characteristic peak at the equilibrium spacing rather than a pure power law; sorting Parker Solar Probe data by individual funnels could reveal whether this peak exists.
- Because the relation ties $d$ to $N$, the medium switchback scale should vary if the number of network flux tubes per supergranule changes over the solar cycle; comparing PSP encounters at different epochs would test the solar-source dependence.
- The paper's own conclusion that chromospheric inter-distances do not reproduce the power-law waiting times suggests the power-law tail is produced only after averaging over many funnels; one could test this by checking whether the power-law shape emerges only when data from multiple funnels are combined.
Editorial analysis
A structured set of objections, weighed in public.
Referee Report
Summary. The paper uses high-resolution H-alpha blue-wing images from GST/VIS at BBSO to identify spicule-like flux tubes along chromospheric network boundaries near a coronal hole, and measures their lengths, widths, inter-distances, and aspect ratios. These measured chromospheric quantities are compared with the large and medium scales of switchbacks observed by Parker Solar Probe, and the authors propose that the medium scale of switchbacks can be understood as an equilibrium inter-flux-tube distance arising from random-walk redistribution of flux tubes inside supergranule-scale magnetic funnels, quantified by the relation d = D/N^{1/2}.
Significance. If the central claim were established, the paper would provide an observationally grounded mechanism linking chromospheric network structure to the medium-scale spacing of switchbacks in the inner heliosphere. The work has clear strengths: it uses high-resolution (0.1 arcsec) chromospheric data, makes an explicit and testable prediction (d = D/N^{1/2}), candidly labels the random-walk redistribution as an ad hoc assumption, and includes a comparative table (Table 1) that displays both agreements and disagreements with PSP-derived scales. However, the central quantitative link is currently undermined by internal inconsistencies in the reported distributions, by the mismatch between the invoked random-walk mechanism and the equal-spacing ansatz actually used, and by the partly circular use of the same PSP dataset to define both the predicted and target scales. These issues are load-bearing for the paper's main conclusion and require substantial revision.
major comments (4)
- [Abstract; §3.2; §3.3] The reported inter-distance distributions are internally inconsistent. The abstract states that the inter-distances between all pairs of flux tubes appear in a single peak around 0.7 Mm (0.06 deg), but §3.2 reports two peaks at 1.4 Mm and 7.3 Mm in one frame and at about 5 Mm and 14 Mm in another, while §3.3 states that the combined histogram has a peak around 7 Mm. These descriptions cannot all describe the same statistic, and the claimed characteristic scale is not robust across the three frames. The authors should reconcile these statements and report the individual-frame and combined distributions with uncertainties before the comparison to the switchback medium scale can be assessed.
- [§3.4, Fig. 2c–d, Table 1] The relation d = D/N^{1/2} does not follow from the random-walk mechanism that the paper invokes. Equal nearest-neighbor spacing, as assumed when writing d = D/N^{1/2}, corresponds to a regular lattice arrangement, not to the outcome of stochastic meandering. For N uniformly random points in a disk of diameter D, the mean nearest-neighbor spacing is approximately 0.443 D/N^{1/2}, and the spacing distribution is broad rather than peaked. Inserting the paper's ranges gives 0.03–0.13 deg (using D = 0.6–1.8 deg) or 0.05–0.31 deg (using D = 1.1–4.4 deg), which sits partly below the quoted switchback medium scale of 0.08 deg and does not produce a characteristic peak. Since the text explicitly labels the complete-rearrangement assumption as 'ad hoc' and tests only this extreme case, the quantitative link between chromospheric network counts and the switchback medium scale remains unsupported unless a mechanism producing near-equal spacing is supplied or the prediction is revised to a stochastic-spacing form.
- [§3.4, Table 1] The consistency check is partly circular. The predicted range for d is obtained by inserting the large scale D taken from the same PSP analysis (Fargette et al. 2021) that defines the target medium scale d, together with chromospheric N values. A genuine test should use an independently measured chromospheric funnel size or a PSP large scale derived from a different dataset or epoch; otherwise the agreement in Table 1 reflects, at least in part, the input choice rather than an independent prediction. The authors should clarify how D and d are obtained and provide at least one out-of-sample comparison.
- [§3.2, §3.3, Fig. 3] The statistical basis is too thin for the claimed characteristic scale. The measurements are manual, based on only three images and 250 data points, with subjective selection of 'dense sections' and of which spicules belong to the central network; the text itself notes that Type I and Type II spicules cannot be distinguished and that the total count may be overestimated. No uncertainties, inter-observer reproducibility, or sensitivity to selection criteria are given. The paper should quantify these effects, for example by repeating the counts on additional frames and by stating the criteria for inclusion and exclusion in a reproducible form.
minor comments (5)
- [Abstract] The abstract contains the typo 'agued' instead of 'argued'; this should be corrected.
- [§1, Table 1] The scale conversions are unclear: the text quotes a large scale of 1.1–4.4 deg and a medium scale of 0.08 deg alongside 18 arcsec–74 arcsec and 1.3 arcsec without specifying the projection or conversion used. Table 1 also lists the expected medium scale as 0.08 deg while the PSP row gives 0.12–0.7 deg; please reconcile these numbers.
- [§3.3, Fig. 4f] The conversion of spicule lengths to turnover times uses a nominal speed of 500 km/s and a 'doubled' length; the rationale for the doubling factor and the assumed radial distance should be stated explicitly, since the resulting 4–20 s range is compared directly with PSP residence times.
- [§4, References] There are several reference errors: 'Hobury et al. 2002' should be 'Horbury et al. 2020', 'Swadron & McComas 2021' should be 'Schwadron & McComas 2021', and 'Kumar et al. 2022, under reiew' contains a typo. These should be corrected.
- [§3.1, Fig. 2] The caption of Figure 2 and the text in §3.1 describe the random-walk scenario qualitatively, but the figure does not show quantitative scales or the N value used; adding axis scales and representative N would help the reader evaluate the proposed redistribution.
Circularity Check
Partial circularity: the medium-scale 'prediction' re-inserts the PSP large scale from the same Fargette et al. (2021) analysis that defines the target medium scale, via an equal-spacing ansatz the paper itself labels ad hoc.
-
other
[§3.4 'Redistribution of Flux Tubes in Space' and Table 1]
"On the other hand, if we use the large scale of SBs, 1.1°≤ D ≤4.4°, we end up with 0.11°≤ d ≤0.7° in good agreement with the medium scale of SBs (Table 1). In this scenario, d is not the intrinsic size of a granule, but an equlibrium scale resulting from the random walk of flux tubes within a magnetic funnel."
The claimed prediction evaluates d = D/N^{1/2} using the large scale D taken from the same Fargette et al. (2021) PSP analysis whose medium scale d is the quantity to be matched. Thus the 'agreement' is partly internal to one dataset: the input large scale and the target medium scale come from the same analysis, so the test reduces to checking D/d ≈ N^{1/2} rather than predicting d from solar measurements. The chromospheric count N is independent, preventing full circularity, but the quantitative link is not an independent prediction.
-
renaming known result
[§3.4 and Figure 2c-d]
"We consider an extreme case in this line that they are completely rearranged in position so that the inter-distance between filament becomes the same for every pair of the nearest neighbors, and d is expressed as D/N^{1/2}."
Equal nearest-neighbor spacing is the geometry of a regular lattice, not the outcome of the random walk the hypothesis invokes; uniformly random rearrangement would give a different mean nearest-neighbor spacing and a broad distribution. The 'equilibrium distance resulting from random walk' is therefore the assumed grid-spacing formula d = D/N^{1/2} renamed, so the central claim reduces to the ansatz rather than following from the stochastic mechanism.
full rationale
The spicule measurements themselves (N, lengths, widths, spacings) are independent of the PSP switchback data, and the paper does not rest its argument on self-citations: citations to Fargette et al. (2021), Bale et al. (2021), and Chhiber et al. (2021) are external empirical/model inputs, and no load-bearing self-citation chain is present. However, the central quantitative claim that the medium switchback scale is an 'equilibrium distance resulting from random walk' is only weakly supported: the relation d = D/N^{1/2} is imposed as an equal-spacing extreme that the authors explicitly label 'ad hoc', and the agreement with the medium scale is obtained by inserting the large scale D from the same Fargette et al. PSP analysis that defines the target d. Because the chromospheric N is independent, this is a partial, not complete, circularity; the result has some independent content. The finding is therefore a moderate score of 4 rather than higher.
Assumptions & free parameters
free parameters (2)
- Conversion speed for SB times =
500 km/s (assumed)
- Length doubling factor =
2 (assumed)
assumptions (5)
- domain assumption Features visible in H-alpha blue wing but not red wing are chromospheric ejecta and flux tubes that can reach the heliosphere and become SBs.
- domain assumption The chromospheric network expands into a magnetic funnel whose angular size at PSP height equals the supergranule scale D.
- ad hoc to paper Flux tubes undergo complete random-walk rearrangement within the SG funnel, so the mean nearest-neighbor spacing is d = D/N^{1/2}.
- domain assumption SBs form as S-shaped kinks whose aspect ratio is set by the dense section of the source flux tube.
- standard math For N points uniformly distributed over an area with diameter D, the typical nearest-neighbor spacing scales as D/N^{1/2}.
Cite this review
Pith. "Pith review of Solar Chromospheric Network as a Source for Solar Wind Switchbacks." pith.science (2026). https://pith.science/paper/GLWCKRHX
@misc{pith2026250712660,
  author       = {Pith},
  title        = {Pith review of: Solar Chromospheric Network as a Source for Solar Wind Switchbacks},
  year         = {2026},
  howpublished = {\url{https://pith.science/paper/GLWCKRHX}},
  note         = {Machine review of arXiv:2507.12660}
}
read the original abstract
Recent studies suggest that the magnetic switchbacks (SBs) detected by the Parker Solar Probe (PSP) carry information on the scales of solar supergranulation (large scale) and granulation (medium scale). We test this claim using high-resolution H-alpha images obtained with the visible spectro-polarimeters (VIS) of the Goode Solar Telescope (GST) in Big Bear Solar Observatory (BBSO). As possible solar sources, we count all the spicule-like features standing along the chromospheric networks near the coronal hole boundary visible in the H-alpha blue-wing but absent in the red-wing images and measure the geometric parameters of dense sections of individual flux tubes. Intervals between adjacent spicules located along the chromospheric networks are found in the range of 0.4-1.5 Mm (0.03 deg - 0.12 deg) tending to be smaller than the medium scale of SBs. Inter-distances between all pairs of the flux tubes are also counted and they appear in a single peak distribution around 0.7 Mm (0.06 deg) unlike the waiting time distribution of SBs in a scale-free single power-law form. Length-to-diameter ratio of the dense section of flux tubes is as high as 6-40, similar to the aspect ratio of SBs. Number of spicules along a network can be as high as 40-100, consistent with numerous SBs within a patch. With these numbers, it is agued that the medium scale of SBs can be understood as an equilibrium distance resulting from random walk within each diverging magnetic field funnels connected to the chromospheric networks.
Figures


Figures from the paper (1 more)
Reference graph
Works this paper leans on
- [1]
-
[2]
Aschwanden, M., Crosby, N., Dimitropoulou, M., et al. 2016, SSRv, 198, 47 12
work page 2016
-
[3]
Aschwanden, M. J. & Dudok de Wit, T. 2021, ApJ, 912, 94
work page 2021
-
[4]
Bale, S. D., Badman, S. T., Bonnell, J. W., et al. 2019, Natur, 576, 237
work page 2019
-
[6]
Bale, S. D., Goetz, K., Harvey, P. R., et al. 2016, SSRv, 204, 49
work page 2016
-
[7]
D., Horbury, T
Bale, S. D., Horbury, T. S., Velli, M., et al. 2021, ApJ, 923, 174
2021
-
[8]
Bemporad, A., Sterling, A. C., Moore, R. L., & Poletto, G. 2005, ApJ, 635L, 189
work page 2005
-
[9]
2010, Astronomische Nachrichten, 331, 636
Cao, W., Gorceix, N., Coulter, R., et al. 2010, Astronomische Nachrichten, 331, 636
2010
Show all 64 references
-
[10]
2012, RAA, 12, 573
Chen, H., Zhang, J., & Ma, S. 2012, RAA, 12, 573
2012
-
[11]
L., Maruca, B
Chhiber, R., Goldstein, M. L., Maruca, B. A., et al. 2020, ApJS, 246, 31
2020
-
[12]
H., et al
Chhiber, R., Ruffolo, D., Matthaeus, W. H., et al. 2021, ApJ, 908, 174 De Pontieu, B., De Moortel, I., Martinez-Sykora, J., et al. 2017, ApJ, 845L, 18 Dudok de Wit, T., Krasnoselskikh V. V., Bale S. D. et al. 2020, ApJS, 246, 39
2021
-
[13]
F., Agapitov, O., Swisdak, M., et al
Drake, J. F., Agapitov, O., Swisdak, M., et al. 2021 A&A, 650A, 2
2021
-
[14]
2019, ApJ, 881, 132
Duan, Y., Shen, Y., Chen, H., & Liang, H. 2019, ApJ, 881, 132
2019
-
[15]
2021, ApJ, 919, 96
Fargette, N., Lavraud, B., Rouillard, A., et al. 2021, ApJ, 919, 96
2021
-
[16]
M., Rasca, A
Farrell, W. M., Rasca, A. P., MacDowall, R. J. 2021, ApJ, 915, 68
2021
-
[17]
Fisk, L. A. & Kasper, J. C. 2020, ApJ, 894L, 4 Fisk L. A. & Schwadron N. A. 2001, ApJ, 560, 425
2020
-
[18]
J., Velli, M
Fox, N. J., Velli, M. C., Bale, S. D., et al. 2016, SSRv, 204, 7
2016
-
[19]
R., Yurchyshyn, V., Cao, W., et al
Goode, P. R., Yurchyshyn, V., Cao, W., et al. 2010, ApJ, 714, L31
2010
-
[20]
2019, PASJ, 71, R1
Khalid, A.-J., Patrick, A., et al. 2019, PASJ, 71, R1
2019
-
[21]
2013, RAA, 13, 253
Hong, J., Jiang, Y., Yang, J., et al. 2013, RAA, 13, 253
2013
-
[22]
2014, ApJ, 796, 73
Hong, J., Jiang, Y., Yang, J., et al. 2014, ApJ, 796, 73
2014
-
[23]
S., Woolley, T., Laker, R., et al
Horbury, T. S., Woolley, T., Laker, R., et al. 2020, ApJS, 246, 45
2020
-
[24]
W., Crooker, N
Kahler, S. W., Crooker, N. U., & Gosling, J. T. 1996, JGR, 101, 24373
1996
-
[25]
C., Abiad, R., Austin, G., et al
Kasper, J. C., Abiad, R., Austin, G., et al. 2016, SSRv, 204, 131
2016
-
[26]
C., Bale, S
Kasper, J. C., Bale, S. D., Belcher, J. W., et al. 2019, Natur, 576, 228
2019
-
[27]
T., Antiochos, S
Kumar, P., Karpen, J. T., Antiochos, S. K., et al. 2022, ApJ, under reiew Klimchuk J. A. 2012, JGRA, 117, A12102
2022
-
[28]
S., Bale, S
Laker, R., Horbury, T. S., Bale, S. D., et al. 2021, A&A, 650A, 1
2021
-
[29]
R., Title, A
Lemen, J. R., Title, A. M., Waltham, N. et al. 2011, Soph, 275, 17
2011
-
[30]
S., et al
Lionello, R., T¨ or¨ ok, T., Titov, V. S., et al. 2016, ApJL, 831, L2
2016
-
[31]
2019, FrASS, 6, 44L
Liu, J., Wang, Y., & Erd´ elyi, R. 2019, FrASS, 6, 44L
2019
-
[32]
2018, ApJ, 860, 116
Martinez-Sykora, J., De Pontieu, B., De Moortel, I. 2018, ApJ, 860, 116
2018
-
[33]
Moore, R. L. 2019, ApJ, 882, 16
2019
-
[34]
B., et al
Miao, Y., Liu, Y., Li, H. B., et al. 2018, ApJ, 869, 39
2018
-
[35]
L., Cirtain, J
Moore, R. L., Cirtain, J. W., Sterling, A. C., & Falconer, D. A. 2010, ApJ, 720, 757
2010
-
[36]
L., Sterling, A
Moore, R. L., Sterling, A. C., Falconer, D. A., & Robe, D. 2013, ApJ, 769, 134
2013
-
[37]
L., Sterling, R
Moore, R. L., Sterling, R. L., & Falconer, D. A. 2015, ApJ, 806, 11
2015
-
[38]
L., Sterling, R
Moore, R. L., Sterling, R. L., & Panesar, N. K. 2018, ApJ, 859, 3
2018
-
[39]
S., Agapitov, O
Mozer, F. S., Agapitov, O. V., Bale, S. D., et al. 2020, ApJS, 246, 68 Nistic` o, G., Bothmer, V., Patsourakos, S., & Zimbardo, G. 2009, SoPh, 259, 87 Nistic` o, G., Bothmer, V., Patsourakos, S., & Zimbardo, G. 2010, AnGeo, 28, 687
2020
-
[40]
H., Primavera, L
Pecora, F., Matthaeus, W. H., Primavera, L. et al. 2022, ApJ, in press, arXiv:2202.04216
2022 arXiv
-
[41]
E., Patsourakos, S., Pariat, E., et al
Raouafi, N. E., Patsourakos, S., Pariat, E., et al. 2016, SSRv, 201, 1
2016
-
[42]
E., & Stenborg, G
Raouafi, N. E., & Stenborg, G. 2014, ApJ, 787, 118
2014
-
[43]
A., Uritsky, V
Roberts, M. A., Uritsky, V. M., DeVore, C R., & Karpen, J. T. 2018, ApJ, 866, 14
2018
-
[44]
H., Chhiber, R., et al
Ruffolo, D., Matthaeus, W. H., Chhiber, R., et al. 2020 ApJ, 902, 94
2020
-
[45]
H., Chuychai, P
Ruffolo, D., Matthaeus, W. H., Chuychai, P. 2003, ApJ, 597L, 169
2003
-
[46]
E., et al
Savcheva, A., Cirtain, J., Deluca, E. E., et al. 2007, PASJ, 59, 771
2007
-
[47]
Schou, J., Scherrer, P.H., Bush, R.I. et al. 2012, SoPh, 275, 229
2012
-
[48]
Schwadron, N. A. & McComas, D. J. 2021,ApJ, 909, 95
2021
-
[49]
Shoda, M., Chandran, B. D. G., Cranmer, S. R. 2021, ApJ, 915, 52
2021
-
[50]
Squire, J., Chandran, B. D. G., & Meyrand, R. 2020, ApJ, 891L, 2
2020
-
[51]
C., Moore, R
Sterling, A. C., Moore, R. L., Falconer, D. A., et al. 2016, ApJ, 821, 100
2016
-
[52]
C., Moore, R
Sterling, A. C., Moore, R. L., Falconer, D. A., & Adams, M. 2015, Natur, 523, 437
2015
-
[53]
C., Moore, R
Sterling, A. C., Moore, R. L., Falconer, D. A., Panesar, N. K., & Martinez, F. 2017, ApJ, 844, 28
2017
-
[54]
C., Moore, R
Sterling, A. C., Moore, R. L., & Panesar, N. K. 2018, ApJ, 864, 68
2018
-
[55]
C., Moore, R
Sterling, A. C., Moore, R. L., Panesar, N. K., et al. 2020, ApJ, 889, 187
2020
-
[56]
Sterling, A. C. & Moore, R. L. 2020, ApJ, 896L, 18
2020
-
[57]
Sterling, A. C. & Moore, R. L. 2016, ApJ, 828L, 9
2016
-
[58]
2020, ApJS, 246, 32
Tenerani, A., Velli, M., Matteini, L., et al. 2020, ApJS, 246, 32
2020
-
[59]
Seripienlert, A., Ruffolo, D., Chuychai, P., & Matthaeus, W
Tooprakai, P. Seripienlert, A., Ruffolo, D., Chuychai, P., & Matthaeus, W. H. 2016, ApJ, 831, 195
2016
-
[60]
M., DeForest, C
Uritsky, V. M., DeForest, C. E., Karpen, J. T., et al. 2021, ApJ, 907, 1
2021
-
[61]
M., DeForest, C
Uritsky, V. M., DeForest, C. E., Karpen, J. T., et al. 1998, ApJ, 508, 899
1998
-
[62]
2019, Natur, 576, 219
Verscharen, D. 2019, Natur, 576, 219
2019
-
[63]
Withbroe, G. L. 1983, ApJ, 267, 825
1983
-
[64]
T., Steinberg, J
Yamauchi, Y., Suess, S. T., Steinberg, J. T., & Sakurai, T. 2004, JGRA, 109, A03104
2004
-
[65]
Yamauchi, Y., Wang, H., Jiang, Y. et al. 2005, ApJ, 629, 572
2005
Reviewed August 6, 2026 · model on record in the stance chip above.
Discussion (0). Continue with ORCID to comment.