REVIEW 3 major objections 4 minor 61 references
Methodological considerations for semialgebraic hypothesis testing with incomplete U-statistics
T0 review · 3 major / 4 minor · reviewed 2026-08-06 · deepseek-v4-flash
Pith's one-line read The SDL test for semialgebraic models works in phylogenetics, but only with careful tuning.
desk verdict A genuinely useful, honest empirical evaluation of the SDL test on phylogenetic models, with a real but disclosed tuning-on-evaluation issue that tempers the headline performance claims. read the letter →
The pith
A machine-rendered reading of the paper's core claim, the machinery that carries it, and where it could break.
The reading
What carries the argument
The machinery is the randomized incomplete U-statistic: a user-specified symmetric kernel $h$ on $m$ data points estimates the constraint vector $f(\theta)$, and the test statistic is the studentized maximum of the average of such kernel evaluations over random subsamples. A Gaussian multiplier bootstrap calibrated with a divide-and-conquer estimator of the H\'ajek projection (the conditional expectation of the kernel given one data point) supplies the null distribution, which is why the method remains valid at singularities and boundaries. The paper's contribution is to show how the knobs of this machinery—kernel order $m$, sampling budget $N$, bootstrap size $A$ and $n_1$, the constraint list, and the symmetrization step—act as levers on the rejection region.
What would settle it
Run the SDL test with the paper's recommended choices on a different semialgebraic model in higher dimensions—for example a five-taxon CFN model or a larger phylogenetic network—and check whether the empirical type I error at nominal 0.05 stays at or below 0.05 across several model parameters, including singular points; any model where the test becomes anti-conservative at the suggested settings would show the guidance is not generic.
Extended reading notes
Core claim
The SDL test, built from randomized incomplete U-statistics and a Gaussian multiplier bootstrap, works on semialgebraic phylogenetic models, but its finite-sample behaviour is governed by user choices that the original proposal left under-specified. With a moderately increased kernel order, redundant constraints generated by random convex combinations, and partial rather than full symmetrization of the kernel, the test matches or approaches the power of deterministic tests on the trinomial quartet-concordance models while remaining conservative or valid at nominal levels. On a four-taxon CFN model, the same procedure yields topology tests without likelihood computation. The authors' central claim is that the method is practically usable across all models they considered, yet no general rules for choosing parameters exist; simulation at several model points is the most informative guide.
Load-bearing premise
The practical guidance rests on a handful of low-dimensional examples ($n=300$ trinomial models and one four-taxon CFN setting), and the paper says no general rules could be extracted; if those settings are not representative, the recommended tuning steps may not transfer to other semialgebraic models.
Editorial extensions
If this is right
- Users should simulate from the model before trusting SDL p-values, testing multiple parameter points including singularities; no one-size-fits-all choice of kernel order $m$ exists.
- Redundant constraints, e.g., random convex combinations of the defining inequalities, can make the rejection region less dependent on an arbitrary semialgebraic description.
- Partial symmetrization with roughly ten random permutations can substitute for full symmetrization, which is computationally prohibitive when constraint degrees are high.
- For reducible models, an intersection-union test over irreducible components can improve power and speed relative to testing the whole model directly.
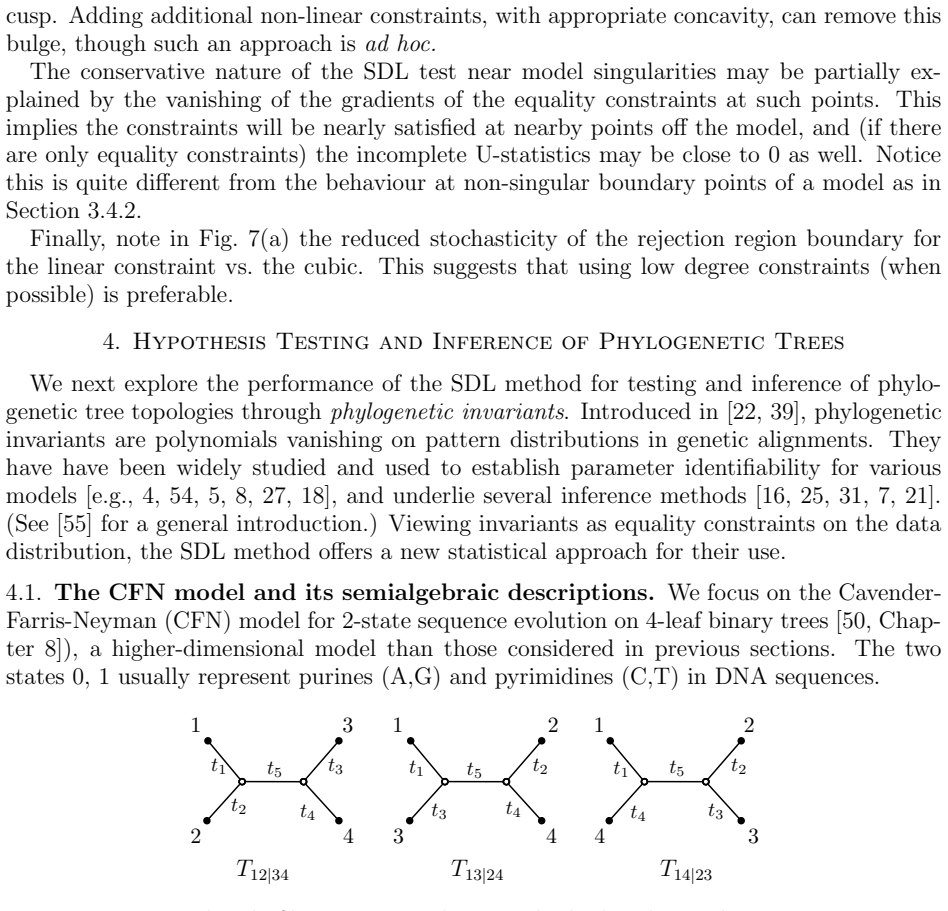
- The CFN topology test shows that SDL can identify gene-tree topology from semialgebraic descriptions alone, without likelihood computation or optimization.
Reading between the lines
- The paper leaves implicit that the same tuning discipline would be needed for any new semialgebraic model, not just phylogenetics; the exact settings found here are not portable.
- A natural next step, not pursued here, is a theoretical account of random partial symmetrization, whose third source of randomness falls outside the existing asymptotic justification.
- The random-convex-combination constraint augmentation could be viewed as averaging over semialgebraic descriptions; formalizing that average might yield a deterministic recipe for choosing how many redundant constraints to add.
- The CFN topology-testing idea may scale to larger trees if component decompositions and semialgebraic descriptions are computed automatically.
Editorial analysis
A structured set of objections, weighed in public.
Referee Report
Summary. The paper evaluates the SDL stochastic hypothesis test for semialgebraic models on four trinomial submodels and a four-taxon CFN model, investigating how kernel order m, choice of constraint description, redundant constraints via random convex combinations, partial symmetrization, and decomposition into irreducible components affect Type I error, power, and p-value stability. The authors report that the method performs well after careful tuning, but they emphasize that they found no general rules for parameter choice and that simulation at a number of model points is the most informative approach.
Significance. If the empirical findings hold, this is a useful practical guide for applying SDL tests to semialgebraic phylogenetic models, and the paper makes several concrete, actionable recommendations: use redundant constraints, consider intersection-union tests for reducible models, and use partial symmetrization with only a few permutations. The manuscript is honest and careful in several respects: the code is publicly available on GitHub, simulations use n = 300 with 1000 datasets for size estimates, and the authors explicitly flag the lack of theory for partial symmetrization and the absence of general rules. The main weaknesses are that the quantitative performance claims are weakened by the selection-on-evaluation-set issue for m, and the breadth of the 'across different settings' claim in the abstract is not matched by the narrow set of simulation settings.
major comments (3)
- [§3.4.1] The kernel order m is selected using simulations at the same null points that are later used to report the test's empirical size, so the reported Type I error for the chosen m is an optimistically biased estimate of the procedure's actual Type I error. The text states, 'In the following subsections, we use the largest m which simulations suggest gives a valid test size at a number of model points,' and the subsequent discussion of Model 2 and Figure 2 reports sizes at exactly those points. Because the authors' central recommendation is simulation-guided parameter choice, the quantitative support for the headline claim of 'excellent performance' is weaker than it appears. I recommend splitting the simulations into a tuning set and an evaluation set, or reporting sensitivity analyses over a grid of m values at several different θ points, so that the reported size is not conditioned on the same simulations used to select m.
- [§3.4.3] The random partial symmetrization with s permutations is presented as an effective substitute for full symmetrization, but the authors correctly note that 'theory justifying its use is currently lacking' and that it introduces a third source of randomness not covered by the asymptotic justification in [53]. Since this device is later used in the CFN application in Section 4, the validity of the results reported there depends on an unproven approximation. The paper should either provide additional empirical evidence that the unbiasedness of the kernel and the bootstrap approximation are preserved (for example, by comparing partial symmetrization with full symmetrization on a model where full symmetrization is computationally feasible, and by checking the null distribution of p-values), or explicitly restrict the claims about partial symmetrization to empirically observed behavior and mark the CFN inference procedure as exploratory.
- [Section 3 and Section 4] The paper's general guidance rests on a small set of low-dimensional simulation settings: four trinomial submodels at n = 300 and one four-taxon CFN model. The authors acknowledge this in §3.4.1 when they say they were 'unable to develop any general rules to apply.' This is an honest limitation, but the abstract's statement that the method 'performs remarkably well across different settings' overstates the evidence, since 'different settings' are a handful of closely related low-dimensional models. I suggest tempering the abstract and the introductory emphasis to say that excellent performance was observed after tuning in the specific models studied, rather than suggesting a general empirical guarantee.
minor comments (4)
- [Introduction, paragraph 2] There is a typo: 'ignore the the challenges' should read 'ignore the challenges.'
- [§3.4.1] The phrase 'For η = m = 1' is slightly confusing because η and m are conceptually distinct (m = η · max deg(fi)); for Model 1 the degree is 1 so they coincide, but this equivalence should be stated explicitly to avoid confusion.
- [§3.4.2] When introducing random convex combinations of inequalities, it would be clearer to state explicitly that a convex combination of polynomials that are non-positive on the model is again non-positive on the model, so the added constraints do not change the null set.
- [§3.4.4] The intersection-union test is described as taking the maximum of component-test p-values; it may be worth noting explicitly that this is valid only when each component test is level α, which is the case if the SDL test's conservatism holds for each component.
Circularity Check
Reported Type I error at the chosen kernel order m is partly self-confirming, since m is selected from those same null simulations; no equation-level circularity or load-bearing self-citation is present.
-
fitted input called prediction
[Section 3.4.1 (applied in Sections 3.4.2-3.4.5)]
"In the following subsections, we use the largest m which simulations suggest gives a valid test size at a number of model points, including singularities and boundary points. For instance, we find that for Model 2 (discussed in the next subsection) m = 5 gave good performance for the boundary parameter point (1/3,1/3,1/3), with empirical test size closely tracking the nominal level (plot not shown)."
The kernel order m is chosen by inspecting empirical Type I error at null model points, and then the empirical sizes obtained at that chosen m are reported as evidence that the test has valid size. The reported 'valid test size' is therefore the selection criterion rather than an independent evaluation of the procedure: at the selected m, matching the nominal level is partly guaranteed by the selection loop. This makes the favorable Type I error numbers for the headline 'excellent performance' claim less informative than they appear. The paper's own caveat that no general rules could be developed and that simulation at model points is the most informative approach mitigates the concern, but the quantitative support for correct size at the chosen m is still partially self-confirming.
full rationale
This is a methods-evaluation paper, not a derivation, so there is no equation-level circularity in the sense of a claimed result reducing by construction to its inputs. The SDL test itself is imported from [53] (Sturma, Drton, Leung), whose authors are distinct from the present authors, and its asymptotic validity is cited as an external, independently stateable result; no self-citation chain is load-bearing. The main circularity burden is procedural: Section 3.4.1 explicitly selects the kernel order m as the largest value that simulations suggest gives a valid test size at a set of null model points, and then the empirical sizes at that same m are used to document correct size behavior, making the reported Type I error partly an artifact of tuning on the evaluation set. The paper is transparent about this limitation, explicitly states that no general rules were found, and recommends simulation at model points as the most informative approach. The other contributions—constraint augmentation via random convex combinations, partial symmetrization, and intersection-union decomposition—are exploratory illustrations rather than predictive claims, and they are compared against deterministic benchmarks rather than being claimed as derived results. Thus the circularity score is low: one selection-on-evaluation loop weakens the quantitative support for the positive performance claim, but the paper's central content remains independent simulation-based evidence rather than a circular derivation.
Assumptions & free parameters
free parameters (6)
- m (kernel order) =
1, 5, 15, 25, 45 depending on model; 5 for Models 1-2, 15 for Model 3, 25 for direct Model 4, 5 for IUT
- N (computational budget) =
1000
- n1 (bootstrap subset size) =
300 (n)
- A (bootstrap draws) =
1000
- r (random convex combinations) =
10 or 100
- s (random permutations for partial symmetrization) =
1, 10, 100
assumptions (5)
- domain assumption Data are i.i.d. samples Xi ~ Pθ for θ in Θ
- domain assumption The null model Θ0 is a basic semialgebraic set defined by finitely many polynomial inequalities fi ≤ 0 (Eq. 2.1)
- domain assumption Unbiased estimators bθj of θj exist and are used to build the kernel h, so that E[h] = f(θ)
- standard math The Gaussian multiplier bootstrap approximation of the test statistic distribution is valid at the finite sample sizes used
- ad hoc to paper Random partial symmetrization with s permutations does not break the unbiasedness or bootstrap approximation
Cite this review
Pith. "Pith review of Methodological considerations for semialgebraic hypothesis testing with incomplete U-statistics." pith.science (2026). https://pith.science/paper/6DD3WDBU
@misc{pith2026250713531,
  author       = {Pith},
  title        = {Pith review of: Methodological considerations for semialgebraic hypothesis testing with incomplete U-statistics},
  year         = {2026},
  howpublished = {\url{https://pith.science/paper/6DD3WDBU}},
  note         = {Machine review of arXiv:2507.13531}
}
read the original abstract
Recently, Sturma, Drton, and Leung proposed a general-purpose stochastic method for hypothesis testing in models defined by polynomial equality and inequality constraints. Notably, the method remains theoretically valid even near irregular points, such as singularities and boundaries, where traditional testing approaches often break down. In this paper, we evaluate its practical performance on a collection of biologically motivated models from phylogenetics. While the method performs remarkably well across different settings, we catalogue a number of issues that should be considered for effective application.
Figures


Figures from the paper (18 more)







Reference graph
Works this paper leans on
-
[53]
Testing many constraints in possibly irregular models using incomplete U-statistics
Nils Sturma, Mathias Drton, and Dennis Leung. “Testing many constraints in possibly irregular models using incomplete U-statistics”. In: Journal of the Royal Statistical Society Series B: Statistical Methodology (Mar. 2024), qkae022. issn: 1369-7412. doi: 10.1093/jrsssb/qkae022
-
[1]
E.S. Allman, J.H. Degnan, and J.A. Rhodes. “Identifying the rooted species tree from the distribution of unrooted gene trees under the coalescent”. In: Journal of Mathe- matical Biology 62.6 (2011), pp. 833–862
work page 2011
-
[2]
Identifiability of parameters in latent struc- ture models with many observed variables
E.S. Allman, C. Matias, and J.A. Rhodes. “Identifiability of parameters in latent struc- ture models with many observed variables”. In: The Annals of Statistics 37.6A (2009), pp. 3099–3132. doi: 10 . 1214 / 09 - AOS689. url: https : / / doi . org / 10 . 1214 / 09 - AOS689
work page 2009
-
[3]
TINNiK: Inference of the tree of blobs of a species network under the coalescent
E.S. Allman et al. “TINNiK: Inference of the tree of blobs of a species network under the coalescent”. In: Algorithms in Molecular Biology 19.1 (2024), p. 23. doi: 10.1186/ s13015-024-00266-2
work page 2024
-
[4]
Quartets and parameter recovery for the gen- eral Markov model of sequence mutation
Elizabeth Allman and John Rhodes. “Quartets and parameter recovery for the gen- eral Markov model of sequence mutation”. In: AMRX Applied Mathematics Research eXpress 2004 (Jan. 2004). doi: 10.1155/S1687120004020283
-
[5]
Elizabeth Allman and John Rhodes. “The identifiability of tree topology for phyloge- netic models, including covarion and mixture models”. In: Journal of Computational Biology 13 (July 2006), pp. 1101–13. doi: 10.1089/cmb.2006.13.1101
-
[6]
The tree of blobs of a species network: identifiability under the coalescent
Elizabeth S Allman et al. “The tree of blobs of a species network: identifiability under the coalescent”. In: Journal of Mathematical Biology 86.1 (2023), p. 10. 37
work page 2023
-
[7]
Split scores: a tool to quantify phylogenetic signal in genome-scale data
Elizabeth S. Allman, Laura S. Kubatko, and John A. Rhodes. “Split scores: a tool to quantify phylogenetic signal in genome-scale data”. In: Systematic Biology 66.4 (Jan. 2017), pp. 620–636. issn: 1063-5157. doi: 10.1093/sysbio/syw103 . eprint: https: //academic.oup.com/sysbio/article-pdf/66/4/620/25423838/syw103.pdf . url: https://doi.org/10.1093/sysbio/syw103
Show all 61 references
-
[8]
Phylogenetic ideals and varieties for the general Markov model
Elizabeth S. Allman and John A. Rhodes. “Phylogenetic ideals and varieties for the general Markov model”. In:Advances in Applied Mathematics 40 (2 Feb. 2008), pp. 127–
2008
-
[9]
Identifying species network features from gene tree quartets under the coalescent model
Hector Ba˜ nos. “Identifying species network features from gene tree quartets under the coalescent model”. In: Bulletin of Mathematical Biology 81 (2019), pp. 494–534
2019
-
[10]
Code repository for ”Methodological considerations for semi- algebraic hypothesis testing with incomplete U-statistics”
David Barnhill et al. Code repository for ”Methodological considerations for semi- algebraic hypothesis testing with incomplete U-statistics” . Version 1.0.0. July 2025. url: https : / / github . com / marinagarrote / Semialg - Hypothesis - Test - with - Incomplete-U-Stats
2025
-
[11]
Detectability of varied hybridization scenarios using genome- scale hybrid detection methods
Marianne B. Bjorner et al. “Detectability of varied hybridization scenarios using genome- scale hybrid detection methods”. In: Bulletin of the Society of Systematic Biologists 3.1 (Oct. 2024). doi: 10.18061/bssb.v3i1.9284
2024 doi
-
[12]
Some properties of incomplete U-statistics
Gunnar Blom. “Some properties of incomplete U-statistics”. In: Biometrika (1976), pp. 573–580
1976
-
[13]
Colored Gaussian DAG models
Tobias Boege et al. “Colored Gaussian DAG models”. In: arXiv preprint arXiv:2404.04024 (2024)
2024
-
[14]
Reduced U-statistics and the Hodges-Lehmann estima- tor
BM Brown and DG Kildea. “Reduced U-statistics and the Hodges-Lehmann estima- tor”. In: The Annals of Statistics (1978), pp. 828–835
1978
-
[15]
Causal Discovery with Latent Confounders Based on Higher-Order Cumulants
Ruichu Cai et al. “Causal Discovery with Latent Confounders Based on Higher-Order Cumulants”. In: Proceedings of the 40th International Conference on Machine Learning. ICML’23. Honolulu, Hawaii, USA: JMLR.org, 2023
2023
-
[16]
Performance of a new invariants method on homogeneous and nonhomogeneous quartet trees
M Casanellas and J Fern´ andez-S´ anchez. “Performance of a new invariants method on homogeneous and nonhomogeneous quartet trees”. In: Molecular Biology and Evolution 24.1 (Oct. 2006), pp. 288–293. issn: 0737-4038. doi: 10.1093/molbev/msl153. eprint: https://academic.oup.com/...
2006 doi
-
[17]
SAQ: Semi- algebraic quartet reconstruction
Marta Casanellas, Jesus Fernandez-Sanchez, and Marina Garrote-Lopez. “SAQ: Semi- algebraic quartet reconstruction”. In: IEEE/ACM Transactions on Computational Bi- ology and Bioinformatics 18 (6 Nov. 2021), pp. 2855–2861. issn: 1545-5963. doi: 10. 1109/TCBB.2021.3101278
2021
-
[18]
Geometry of the Kimura 3-parameter model
Marta Casanellas and Jes´ us Fern´ andez-S´ anchez. “Geometry of the Kimura 3-parameter model”. In: Advances in Applied Mathematics 41.3 (2008), pp. 265–292
2008
-
[19]
Distance to the stochastic part of phylogenetic varieties
Marta Casanellas, Jes´ us Fern´ andez-S´ anchez, and Marina Garrote-L´ opez. “Distance to the stochastic part of phylogenetic varieties”. In: Journal of Symbolic Computation 104 (May 2021), pp. 653–682. issn: 07477171. doi: 10.1016/j.jsc.2020.09.003
2021 doi
-
[20]
Phylogenetic mixtures and linear invariants for equal input models
Marta Casanellas and Mike Steel. “Phylogenetic mixtures and linear invariants for equal input models”. In: Journal of Mathematical Biology 74 (5 Apr. 2017), pp. 1107–
2017
-
[21]
Designing weights for quartet-based methods when data are heterogeneous across lineages
Marta Casanellas et al. “Designing weights for quartet-based methods when data are heterogeneous across lineages”. In: Bulletin of Mathematical Biology 85 (7 July 2023), p. 68. issn: 0092-8240. doi: 10.1007/s11538-023-01167-y
2023 doi
-
[22]
Invariants of phylogenies in a simple case with discrete states
James A. Cavender and Joseph Felsenstein. “Invariants of phylogenies in a simple case with discrete states”. In: Journal of Classification 4.1 (1987), pp. 57–71. doi: 10.1007/BF01890075. url: https://doi.org/10.1007/BF01890075
1987 doi
-
[23]
Gaussian and bootstrap approximations for high-dimensional U-statistics and their applications
Xiaohui Chen. “Gaussian and bootstrap approximations for high-dimensional U-statistics and their applications”. In: The Annals of Statistics 46.2 (2018)
2018
-
[24]
Randomized incomplete U -statistics in high dimen- sions
Xiaohui Chen and Kengo Kato. “Randomized incomplete U -statistics in high dimen- sions”. In: The Annals of Statistics 47.6 (2019), pp. 3127–3156
2019
-
[25]
Quartet inference from SNP data under the coa- lescent model
Julia Chifman and Laura Kubatko. “Quartet inference from SNP data under the coa- lescent model”. In: Bioinformatics 30 (23 Dec. 2014), pp. 3317–3324. issn: 1367-4811. doi: 10.1093/bioinformatics/btu530
2014 doi
-
[26]
Algebraic Statistics and Contingency Table Problems: Log-Linear Models, Likelihood Estimation, and Disclosure Limitation
Adrian Dobra et al. “Algebraic Statistics and Contingency Table Problems: Log-Linear Models, Likelihood Estimation, and Disclosure Limitation”. In: Emerging Applications of Algebraic Geometry . Ed. by Mihai Putinar and Seth Sullivant. New York, NY: Springer New York, 2009, pp....
2009 doi
-
[27]
On the ideals of equivariant tree models
Jan Draisma and Jochen Kuttler. “On the ideals of equivariant tree models”. In: Math- ematische Annalen 344.3 (Dec. 2008), pp. 619–644. issn: 1432-1807. doi: 10.1007/ s00208-008-0320-6 . url: http://dx.doi.org/10.1007/s00208-008-0320-6
2008 doi
-
[28]
Likelihood ratio tests and singularities
Mathias Drton. “Likelihood ratio tests and singularities”. In: Ann. Statist. 37.1 (2009), pp. 979–1012
2009
-
[29]
Model selection and local geometry
Robin J Evans. “Model selection and local geometry”. In: The Annals of Statistics 48.6 (2020), pp. 3513–3544
2020
-
[30]
Cases in which parsimony or compatibility methods Will be pos- itively misleading
Joseph Felsenstein. “Cases in which parsimony or compatibility methods Will be pos- itively misleading”. In: Systematic Zoology 27 (4 Dec. 1978), p. 401. issn: 00397989. doi: 10.2307/2412923
1978 doi
-
[31]
Invariant versus classical quartet in- ference when evolution is heterogeneous across sites and lineages
Jes´ us Fern´ andez-S´ anchez and Marta Casanellas. “Invariant versus classical quartet in- ference when evolution is heterogeneous across sites and lineages”. In: Systematic Bi- ology 65 (2 Mar. 2016), pp. 280–291. issn: 1063-5157. doi: 10.1093/sysbio/syv086
2016 doi
-
[32]
Grayson and Michael E
Daniel R. Grayson and Michael E. Stillman. Macaulay2, a software system for research in algebraic geometry . Available at http://www2.macaulay2.com
-
[33]
PARTIAL IDENTIFIABILITY OF RESTRICTED LA- TENT CLASS MODELS
Yuqi Gu and Gongjun Xu. “PARTIAL IDENTIFIABILITY OF RESTRICTED LA- TENT CLASS MODELS”. In: The Annals of Statistics 48.4 (2020), pp. 2082–2107. issn: 00905364, 21688966. url: https://www.jstor.org/stable/26931550 (visited on 06/15/2025)
2020
-
[34]
A framework for the quantitative study of evo- lutionary trees
Michael D. Hendy and David Penny. “A framework for the quantitative study of evo- lutionary trees”. In: Systematic Zoology 38 (4 Dec. 1989), p. 297. issn: 00397989. doi: 10.2307/2992396
1989 doi
-
[35]
A maximum likelihood estimator for quartets under the Cavender-Farris-Neyman model
Max Hill and Jose Israel Rodriguez. “A maximum likelihood estimator for quartets under the Cavender-Farris-Neyman model”. In: ACM Communications in Computer Algebra 58 (2 June 2024), pp. 35–38. issn: 1932-2232. doi: 10.1145/3712023.3712028
2024
-
[36]
Performance of phylogenetic methods in simulation
John P. Huelsenbeck. “Performance of phylogenetic methods in simulation”. In: Sys- tematic Biology 44.1 (Mar. 1995), pp. 17–48. issn: 1063-5157. doi: 10.1093/sysbio/ 39 44 . 1 . 17. eprint: https : / / academic . oup . com / sysbio / article - pdf / 44 / 1 / 17 / 19501493/44-1...
1995 doi
-
[37]
The asymptotic distributions of incomplete U-statistics
Svante Janson. “The asymptotic distributions of incomplete U-statistics”. In: Zeitschrift f¨ ur Wahrscheinlichkeitstheorie und Verwandte Gebiete66.4 (1984), pp. 495–505
1984
-
[38]
Maximum Likelihood Estimation of Symmetric Group-Based Models via Numerical Algebraic Geometry
Dimitra Kosta and Kaie Kubjas. “Maximum Likelihood Estimation of Symmetric Group-Based Models via Numerical Algebraic Geometry”. In: Bulletin of Mathematical Biology 81.2 (Oct. 2018), pp. 337–360. issn: 1522-9602. doi: 10.1007/s11538-018- 0523-2. url: http://dx.doi.org/10.1007...
2018 doi
-
[39]
A rate-independent technique for analysis of nucleic acid sequences: evolutionary parsimony
James A Lake. “A rate-independent technique for analysis of nucleic acid sequences: evolutionary parsimony.” In: Molecular biology and evolution 4.2 (1987), pp. 167–191
1987
-
[40]
Lauritzen
Steffen L. Lauritzen. Graphical Model. Oxford University Press, 1996
1996
-
[41]
Fourier transform inequalities for phylogenetic trees
Frederick A Matsen. “Fourier transform inequalities for phylogenetic trees”. In:IEEE/ACM transactions on computational biology and bioinformatics 6.1 (2008), pp. 89–95
2008
-
[42]
Detecting hybrid speciation in the presence of incomplete lineage sorting using gene tree incongruence: a model
C. Meng and L.S. Kubatko. “Detecting hybrid speciation in the presence of incomplete lineage sorting using gene tree incongruence: a model”. In: Theoretical Population Bi- ology 75.1 (2009), pp. 35–45. issn: 00405809. doi: 10.1016/j.tpb.2008.10.004
2009 doi
-
[43]
Hypothesis testing near singularities and boundaries
Jonathan D Mitchell, Elizabeth S Allman, and John A Rhodes. “Hypothesis testing near singularities and boundaries”. In: Electronic Journal of Statistics 13.1 (2019), p. 2150
2019
-
[44]
Relationships between gene trees and species trees
P. Pamilo and M. Nei. “Relationships between gene trees and species trees.” In: Mol. Biol. Evol. 5.5 (1988), pp. 568–583
1988
-
[45]
Maximum Likelihood Inference of Small Trees in the Presence of Long Branches
Sarah L. Parks and Nick Goldman. “Maximum Likelihood Inference of Small Trees in the Presence of Long Branches”. In: Systematic Biology 63.5 (July 2014), pp. 798–
2014
-
[46]
R: A Language and Environment for Statistical Computing
R Core Team. R: A Language and Environment for Statistical Computing . R Foun- dation for Statistical Computing. Vienna, Austria, 2023. url: https : / / www . R - project.org/
2023
-
[47]
MSCquartets 1.0: quartet methods for species trees and net- works under the multispecies coalescent model in R
John A Rhodes et al. “MSCquartets 1.0: quartet methods for species trees and net- works under the multispecies coalescent model in R”. In: Bioinformatics 37.12 (Oct. 2020), pp. 1766–1768. issn: 1367-4803. doi: 10 . 1093 / bioinformatics / btaa868. eprint: https : / / academic ...
2020 doi
-
[48]
Invariant based quartet puzzling
Joseph P Rusinko and Brian Hipp. “Invariant based quartet puzzling”. In: Algorithms for Molecular Biology 7 (2012), pp. 1–9. doi: 10.1186/1748-7188-7-35
2012 doi
-
[49]
Causal Discovery of Linear Non- Gaussian Causal Models with Unobserved Confounding
Daniela Schkoda, Elina Robeva, and Mathias Drton. “Causal Discovery of Linear Non- Gaussian Causal Models with Unobserved Confounding”. In: arXiv:2408.04907 (2024)
2024 arXiv
-
[50]
Phylogenetics
Charles Semple and Mike Steel. Phylogenetics. Vol. 24. Oxford University Press on Demand, 2003
2003
-
[51]
Approximating high-dimensional infinite- order U -statistics: Statistical and computational guarantees
Yanglei Song, Xiaohui Chen, and Kengo Kato. “Approximating high-dimensional infinite- order U -statistics: Statistical and computational guarantees”. In: Electronic Journal of Statistics 13.2 (2019), pp. 4794–4848. 40
2019
-
[52]
TestGGM: Testing Gaussian Graphical Models
Nils Sturma. TestGGM: Testing Gaussian Graphical Models . R package version 1.0
-
[54]
Toric ideals of phylogenetic invariants
Bernd Sturmfels and Seth Sullivant. “Toric ideals of phylogenetic invariants”. In: Jour- nal of Computational Biology 12 (4 May 2005), pp. 457–481. issn: 1066-5277. doi: 10.1089/cmb.2005.12.457
2005 doi
-
[55]
Algebraic Statistics
Seth Sullivant. Algebraic Statistics. Vol. 194. American Mathematical Soc., 2018
2018
-
[56]
Long Branch Attraction Biases in Phylogenetics
Edward Susko and Andrew J Roger. “Long Branch Attraction Biases in Phylogenetics”. In: Systematic Biology 70.4 (Feb. 2021), pp. 838–843. issn: 1063-5157. doi: 10.1093/ sysbio/syab001. eprint: https://academic.oup.com/sysbio/article-pdf/70/4/ 838/38663996/syab001.pdf. url: http...
2021 doi
-
[57]
High-dimensional causal discovery under Non- Gaussianity
Y. Samuel Wang and Mathias Drton. “High-dimensional causal discovery under Non- Gaussianity”. In: Biometrika 107.1 (2019), pp. 41–59. eprint: https://academic.oup. com/biomet/article-pdf/107/1/41/32450889/asz055.pdf. Department of Mathematics, United States Naval Academy Depar...
2019
- [148]
-
[811]
issn: 1063-5157. doi: 10 . 1093 / sysbio / syu044. eprint: https : / / academic . oup . com / sysbio / article - pdf / 63 / 5 / 798 / 24585598 / syu044 . pdf. url: https : //doi.org/10.1093/sysbio/syu044
- [1138]
-
[2021]
url: https://github.com/NilsSturma/TestGGM/blob/main/DESCRIPTION
Reviewed August 6, 2026 · model on record in the stance chip above.
Discussion (0). Continue with ORCID to comment.