REVIEW 3 major objections 4 minor 45 references
The HETDEX Survey: Probing neutral hydrogen in the circumgalactic medium of ~88,000 Lyman Alpha Emitters
T0 review · 3 major / 4 minor · reviewed 2026-08-06 · deepseek-v4-flash
Pith's one-line read By stacking millions of fiber spectra around ~88,000 Lyman-alpha emitters, this paper detects neutral-hydrogen absorption out to ~350 kpc and derives an empirical radial equivalent-width profile that a hydrodynamic simulation reproduces.
desk verdict A new and mostly sound stacked measurement of Lyα absorption around ~88,000 LAEs, but the mock-calibrated bias correction and the simulation comparison are coupled to the very absorption signal they aim to validate. read the letter →
The pith
A machine-rendered reading of the paper's core claim, the machinery that carries it, and where it could break.
The reading
What carries the argument
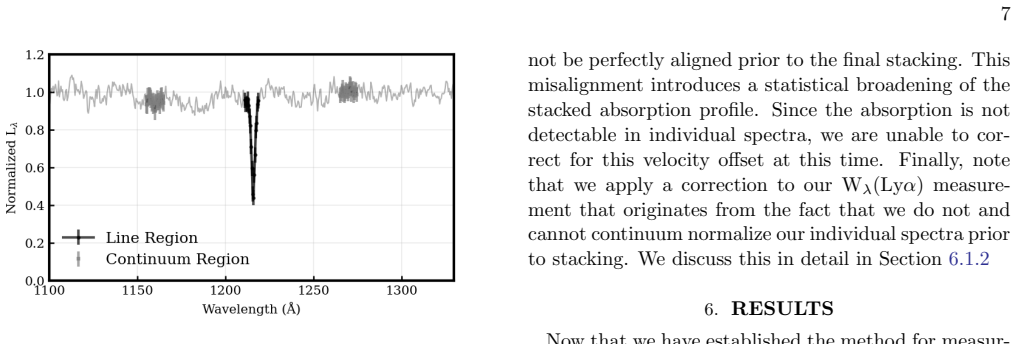
The load-bearing method is annulus spectral stacking: for each of ~88,000 LAEs, spectra from vetted fibers in 20 kpc annuli between 40 and 360 kpc are biweight-averaged, shifted to the LAE rest frame, and then stacked across the sample, so that the integrated light of background galaxies acts as a statistical continuum source. The measured quantity is a non-parametric rest-frame equivalent width, integrated over the Lyman-alpha trough with 100 combinations of continuum windows and integration ranges to carry systematic errors. The comparison tool is forward-modeled mock spectra from the ASTRID simulation, which are used both to reproduce the observed profiles and to calibrate the 19.3% correction for not continuum-normalizing individual spectra before stacking.
What would settle it
Recompute the 19.3% continuum-normalization correction using ASTRID galaxies selected on properties unrelated to absorption shape, such as halo mass or star-formation rate; if the new correction differs by more than the quoted uncertainty, the reported profile shifts. Alternatively, target quasar sightlines passing within 40-350 kpc of spectroscopically confirmed LAEs at $z\sim2.5$; if the resulting individual $W_\lambda(\mathrm{Ly}\alpha)$ values lie systematically below the stacked HETDEX profile by more than the error bars, the stacked measurement is inflated.
Extended reading notes
Core claim
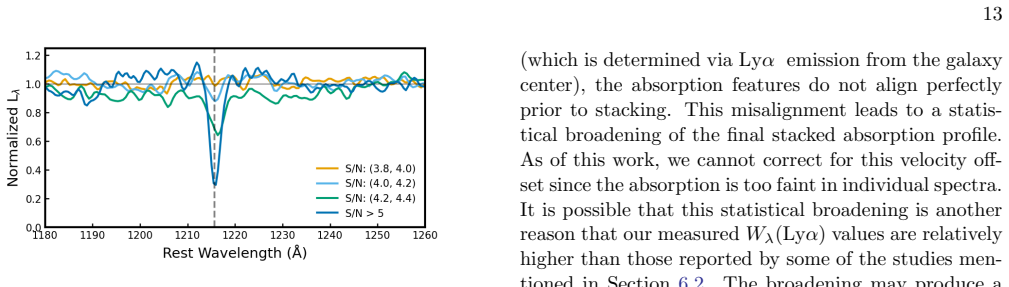
On its own terms, the paper establishes that an average LAE at $z\sim2.5$ is surrounded by neutral hydrogen that imprints a measurable Lyman-$\alpha$ absorption trough on the integrated light of background galaxies, for projected separations from roughly 40 kpc to 350 kpc. After stacking spectra from about three million vetted fibers per radial bin and correcting for the ~19.3% bias introduced by normalizing the continuum only after stacking, the paper obtains a radial $W_\lambda(\mathrm{Ly}\alpha)$ profile that declines with distance, matches the median-stacked LAE measurements from earlier work, lies modestly above continuum-selected Lyman-break-galaxy profiles, and is reproduced in depth and shape by mock spectra built from the ASTRID simulation. The paper further claims that the absorption-to-emission switch seen when binning by signal-to-noise reflects a physical hierarchy: LAEs sitting deeper in dense H I, noisier environments, or dusty interstellar clumps have suppressed Lyman-$\alpha$ emission, so the lowest-signal LAEs are precisely the ones whose halos show the strongest absorption.
Load-bearing premise
The central numbers rest on the assumption that the 840 simulated galaxies used to calibrate the correction and validate the profile are representative of real LAE halos; because those galaxies were chosen for having absorption features like the ones being measured, any mismatch between the mocks and reality propagates directly into the corrected equivalent widths and the agreement claim.
Editorial extensions
If this is right
- A neutral-hydrogen census of galaxy halos at $z\sim2.5$ no longer needs rare quasar sightlines; any sufficiently deep wide-field spectroscopic survey with dense fiber coverage can map diffuse CGM gas statistically.
- Simulations of galaxy formation now have a direct, spatially resolved observable, the radial $W_\lambda(\mathrm{Ly}\alpha)$ profile out to 350 kpc, that they must match rather than only reproduce as an average column density.
- The systematic offset between LAE and Lyman-break-galaxy absorption profiles is partly a selection effect: continuum-bright LAEs show weaker absorption, so continuum-selected samples sit below the full LAE profile.
- The signal-to-noise dependence of the stacked absorption implies that environment and dust geometry regulate the observed Lyman-alpha flux, and future samples can test this by splitting the stack by local density, redshift, and Lyman-alpha luminosity.
Reading between the lines
- (Editorial inference) The 19.3% correction is calibrated on mock galaxies selected for matching the very absorption shapes under study, so the corrected equivalent widths and the claimed agreement with ASTRID are not fully independent; a correction computed from an ASTRID sample selected on halo mass or star-formation rate rather than absorption shape would test whether the calibration holds.
- (Editorial inference) The unexplained continuum suppression between 1180 and 1200 Angstroms in the data but not the mocks hints that future, deeper stacks could detect metal-line absorption (C III, N III, Si II) in the same CGM gas, turning this method into a multi-species probe.
- (Editorial inference) If the environmental picture is right, the profile should steepen when stacking only LAEs in overdense regions; the larger sample expected in the next data release could measure that directly, or disprove it if the profile stays flat.
- (Editorial inference) The technique's dependence on a statistical continuum assumes background-galaxy light is uniform enough to normalize; quasars with foreground LAEs at the same redshifts could provide an independent, per-sightline check of the profile normalization.
Editorial analysis
A structured set of objections, weighed in public.
Referee Report
Summary. The paper stacks millions of HETDEX fiber spectra in annuli around ~88,000 Lyman Alpha Emitters at 1.9<z<3.5 and reports detection of Ly-alpha absorption out to a projected ~350 kpc. The authors measure a rest-frame equivalent-width profile W_lambda(Ly-alpha) as a function of transverse distance, compare it with mock stacks from the ASTRID simulation, and compare with literature measurements. They derive a ~19.3% bias correction to account for the lack of per-spectrum continuum normalization before stacking, and they argue that the resulting profile is in qualitative agreement with ASTRID and modestly above previous LBG-based profiles, with selection and environmental effects as likely explanations.
Significance. If the central quantitative claims hold, this is a valuable new statistical probe of neutral hydrogen in the CGM around high-redshift LAEs, enabled by the unprecedented HETDEX sample size. The paper includes useful internal controls: the [O II] control stack, the low-S/N dilution test, bootstrap error estimation, and explicit forward-modeling of the HETDEX stacking steps. However, the absolute scale of the measured W_lambda profile and the claimed agreement with ASTRID both depend on a mock sample that is preselected on the very absorption features under study and on an assumed continuum-scatter model, so the numerical results are not as independent as the presentation suggests.
major comments (3)
- [Section 6.1, 6.1.2, 6.1.3, Figs. 7-8] The 840 ASTRID galaxies are selected by fitting box-shaped absorption profiles to central line-of-sight spectra and retaining those that 'best match the observed absorption features' (Section 6.1). This same sample is then used both to derive the 19.3% continuum-normalization bias correction (Section 6.1.2, Fig. 7) and to produce the mock radial W_lambda profile compared with the data (Section 6.1.3, Fig. 8). Because the selection enriches for galaxies with strong absorption, the Fig. 8 agreement is not an independent validation of ASTRID, and the bias correction may not transfer to the full HETDEX LAE population, which is selected on Ly-alpha emission rather than on absorption strength. Please demonstrate the sensitivity of the 19.3% correction to the mock selection, for example by recomputing it using an absorption-unbiased sample matched to the LAE population by stellar mass, halo mass, or SFR, and by reporting the correction for several selection cuts.
- [Section 5 and Fig. 6] The continuum-normalization procedure uses blue sidebands extending up to 1185-1195 Å, yet Fig. 6 shows a clear suppression in the data between roughly 1180 and 1200 Å that the authors attribute to metal lines (C III 1175, N III 1183, Si II 1190/1193) absent from the mocks. If part of this suppression falls inside the blue continuum window, the pseudo-continuum will be biased low, directly inflating the measured W_lambda values via Eq. (1). The paper should quantify this effect by recomputing W_lambda with the blue continuum restricted to wavelengths blueward of ~1175 Å and by comparing this against the fiducial measurement.
- [Section 6.1.2] The 19.3% bias correction is derived under an assumed model in which each sight-line spectrum is multiplied by a random factor drawn from a truncated N(1, 0.5) distribution. The magnitude of the correction is expected to depend on the assumed scatter amplitude and on the correlation between continuum level and absorption strength, but the paper provides no test of this dependence. Please show how the correction changes when the scatter is varied over a plausible range and when the mock continuum fluctuations are instead calibrated directly to the HETDEX background-light measurements cited from Weiss et al. 2025.
minor comments (4)
- [Section 5] The notation 'nline' and 'ncont' is introduced in Eq. (2) but never defined; please define the number of line-region and continuum-region choices explicitly, since the total of 100 combinations follows from those definitions.
- [Section 6.1.3, Fig. 8] The claim of 'good qualitative agreement' between the observed and mock radial profiles is not accompanied by a quantitative statistic. A chi-square or residual-based measure, even with a simple covariance model, would substantially strengthen the comparison.
- [Figure 4 caption] The caption says 'The Lyα absorption is apparent in each spectrum until the largest radial bin at ~350 kpc,' but the text in Section 4 states the detection extends 'up to Dtran of ~350 kpc.' Please make the caption wording consistent with the actual outermost bin (e.g., 340-360 kpc) and with the significance of the detection in that bin.
- [Section 8] There is a grammatical error in 'Also LAEs whose their Lyα emitting region lies deeper into dusty ISM clumps will have lower intrinsic Lyα escape fractions'; please rephrase.
Circularity Check
Simulation comparison and 19.3% bias correction rely on the same ASTRID galaxies preselected to match the observed absorption features, partially conditioning the mock 'agreement' and the absolute Wλ scale on the data.
-
fitted input called prediction
[Section 6.1 and Section 6.1.3 (Figures 6 and 8)]
"From the full simulated sample, we select 840 galaxies that exhibit steep, wide absorption troughs with sharp edges in their central line-of-sight spectra. ... The simulated galaxies that best match the observed absorption features form the final sample used for our comparison. ... Overall, the mock profile exhibits good qualitative agreement with the observed profile, indicating that ASTRID effectively reproduces the diffuse H I distribution around galaxies out to ~350 kpc."
The mock sample is not an independent set of galaxies: it is explicitly chosen because its central line-of-sight spectra 'best match the observed absorption features.' The same selected galaxies are then used to build the mock radial Wλ profile that is compared to the observed profile. Because the selection criterion is the absorption phenomenon under study, the agreement in Figure 8 is partly inherited from the sample construction rather than being a free prediction of ASTRID. The comparison is not fully circular since the annuli beyond the center are not the selection input, but the claimed simulation validation is substantially weakened.
-
other
[Section 6.1.2 (Figure 7), applied in Section 6.1.3 (Figure 8)]
"Using the same set of spectra (~215,000 for each annulus) from the 840 galaxies detailed in Section 6.1, we compare two cases. ... Across all eight 40 kpc bins the 'HETDEX-style' stacks (Case b) yield Wλ(Lyα) that are systematically larger by 19.3% ± 0.9%. We therefore apply a uniform correction based on this ~20% bias to the measured HETDEX Wλ(Lyα), so that the values reported in the paper represent the bias-corrected equivalent widths."
The 19.3% bias correction is calibrated on the same 840 ASTRID galaxies that were preselected to match the observed absorption features. If the ratio between per-spectrum-normalized and HETDEX-style stacks depends on absorption depth or continuum distribution, a sample enriched in deep, box-shaped absorption does not necessarily yield the correction appropriate for the full HETDEX population. Applying this single correction to all observed Wλ values propagates the mock-selection bias into the absolute normalization of the empirical profile. The subsequent agreement between the corrected observed profile and the mock profile is therefore not an independent test, since both the correction and the comparison profile are derived from the same input-selected sample.
full rationale
The central detection—stacked Lyα absorption in annuli around ~88,000 HETDEX LAEs out to ~350 kpc—is data-driven and does not depend on the simulations. The circularity burden is concentrated in the validation and normalization chain. In Section 6.1, the ASTRID sample is selected to reproduce the observed absorption features, and this same sample is used both to derive the 19.3% continuum-normalization correction (Section 6.1.2) and to produce the mock profile that is then said to agree with the corrected observed profile (Section 6.1.3). The agreement is therefore partially conditioned on the data at the sample-selection stage, and the absolute Wλ scale inherits the mock selection through the correction. This is a moderate, partial circularity rather than a strict equation-level tautology: the annular profile is not the direct fitting target, and the detection and shape of the observed profile retain independent content. No load-bearing self-citation of a uniqueness theorem or ansatz-smuggling pattern is present; the Weiss et al. citations are to prior HETDEX measurements rather than to an unverified external premise. Score 5 reflects one partially circular validation plus a normalization correction derived from the same preselected mock sample.
Assumptions & free parameters
free parameters (3)
- Bias correction factor =
19.3% ± 0.9% (uniform)
- Mock continuum scatter sigma =
0.5 (truncated N(1,0.5))
- Mock galaxy selection criteria =
unspecified thresholds selecting 840 of the full ASTRID sample
assumptions (4)
- domain assumption The stacked continuum is dominated by integrated light from background galaxies, and the observed flux deficit at Lyα is caused by H I in the foreground LAE's CGM.
- domain assumption ASTRID with the selected 840 galaxies provides a representative model of the diffuse H I distribution around z~2-3 galaxies.
- ad hoc to paper The bias introduced by stacking before continuum normalization is uniform across radius and can be estimated from the mocks.
- domain assumption Sky subtraction and residual correction do not leave a wavelength-dependent artifact at Lyα that mimics absorption.
Cite this review
Pith. "Pith review of The HETDEX Survey: Probing neutral hydrogen in the circumgalactic medium of ~88,000 Lyman Alpha Emitters." pith.science (2026). https://pith.science/paper/KJS7NYQD
@misc{pith2026250715942,
  author       = {Pith},
  title        = {Pith review of: The HETDEX Survey: Probing neutral hydrogen in the circumgalactic medium of ~88,000 Lyman Alpha Emitters},
  year         = {2026},
  howpublished = {\url{https://pith.science/paper/KJS7NYQD}},
  note         = {Machine review of arXiv:2507.15942}
}
abstract
We explore the neutral hydrogen (H I) gas around 1.9 < z < 3.5 Lyman Alpha Emitters (LAEs) from the Hobby-Eberly Telescope Dark Energy Experiment (HETDEX) using faint Ly$\alpha$ absorption. This absorption is the result of H I in the halo of the LAE scattering Ly$\alpha$ photons from the integrated light of background galaxies along the line of sight. We stack millions of spectra from regions around ~88,000 LAEs to focus on the physics of the gas at large radii. The extensive number of fiber spectra contributing to the stacks ensures significant signal-to-noise ratio (S/N) to detect the faint Ly$\alpha$ absorption which would otherwise be buried within the noise. We detect absorption out to a projected ~350 kpc around an average LAE at z~2.5. We use these results to create an empirical radial $W_\lambda$(Ly$\alpha$) profile around LAEs. Comparison with numerical simulations reveals a profile similar to the empirical one within this region. Compared to previous studies, the profile is similar but modestly higher. We also outline a simple physical picture motivated by the observed trends in the data. We plan to quantify this radial profile as a function of redshift, local density, and Ly$\alpha$ luminosity to explore the relationship between LAE environments and H I distribution.
Figures


Figures from the paper (8 more)



Reference graph
Works this paper leans on
-
[1]
Astropy Collaboration, Price-Whelan, A. M., Sip˝ ocz, B. M., et al. 2018, AJ, 156, 123, doi: 10.3847/1538-3881/aabc4f
-
[2]
Johnson, S. D. 2025, ApJL, 979, L32, doi: 10.3847/2041-8213/ada94f
-
[3]
Beers, T. C., Flynn, K., & Gebhardt, K. 1990, AJ, 100, 32, doi: 10.1086/115487
doi:10.1086/115487 1990
-
[4]
2017, FSFE: Fake Spectra Flux Extractor, Astrophysics Source Code Library, record ascl:1710.012
Bird, S. 2017, FSFE: Fake Spectra Flux Extractor, Astrophysics Source Code Library, record ascl:1710.012
work page 2017
-
[5]
2022, MNRAS, 512, 3703, doi: 10.1093/mnras/stac648
Bird, S., Ni, Y., Di Matteo, T., et al. 2022, MNRAS, 512, 3703, doi: 10.1093/mnras/stac648
-
[6]
2023, Journal of Cosmology and Astroparticle Physics, 2023, 037, doi: 10.1088/1475-7516/2023/10/037
Bird, S., Fernandez, M., Ho, M.-F., et al. 2023, Journal of Cosmology and Astroparticle Physics, 2023, 037, doi: 10.1088/1475-7516/2023/10/037
-
[7]
Chen, Y., Steidel, C. C., Hummels, C. B., et al. 2020, MNRAS, 499, 1721, doi: 10.1093/mnras/staa2808
-
[8]
Davis, D., Gebhardt, K., Cooper, E. M., et al. 2023a, ApJ, 954, 209, doi: 10.3847/1538-4357/ace4c2 —. 2023b, ApJ, 946, 86, doi: 10.3847/1538-4357/acb0ca Faucher-Gigu` ere, C.-A., & Oh, S. P. 2023, ARA&A, 61, 131, doi: 10.1146/annurev-astro-052920-125203
Show all 45 references
-
[9]
2021, ApJ, 923, 217, doi: 10.3847/1538-4357/ac2e03
Gebhardt, K., Mentuch Cooper, E., Ciardullo, R., et al. 2021, ApJ, 923, 217, doi: 10.3847/1538-4357/ac2e03
2021 doi
-
[10]
C., Koekemoer, A
Giavalisco, M., Ferguson, H. C., Koekemoer, A. M., et al. 2004, ApJL, 600, L93, doi: 10.1086/379232
2004 doi
-
[11]
W., Calabretta, M
Greisen, E. W., Calabretta, M. R., Valdes, F. G., & Allen, S. L. 2006, A&A, 446, 747, doi: 10.1051/0004-6361:20053818
2006 doi
- [12]
-
[13]
R., Millman, K
Harris, C. R., Millman, K. J., van der Walt, S. J., et al. 2020, Nature, 585, 357, doi: 10.1038/s41586-020-2649-2
2020 doi
-
[14]
2015, ApJ, 812, 157, doi: 10.1088/0004-637X/812/2/157
Hashimoto, T., Verhamme, A., Ouchi, M., et al. 2015, ApJ, 812, 157, doi: 10.1088/0004-637X/812/2/157
2015 doi
-
[15]
J., Drory, N., Good, J
Hill, G. J., Drory, N., Good, J. M., et al. 2018a, in Society of Photo-Optical Instrumentation Engineers (SPIE) Conference Series, Vol. 10700, Ground-based and Airborne Telescopes VII, ed. H. K. Marshall & J. Spyromilio, 107000P, doi: 10.1117/12.2312350
- [16]
-
[17]
J., Lee, H., MacQueen, P
Hill, G. J., Lee, H., MacQueen, P. J., et al. 2021, AJ, 162, 298, doi: 10.3847/1538-3881/ac2c02
2021 doi
-
[18]
Hunter, J. D. 2007, Computing in Science and Engineering, 9, 90, doi: 10.1109/MCSE.2007.55
2007 doi
-
[19]
2022, ApJ, 931, 97, doi: 10.3847/1538-4357/ac69de
Kikuchihara, S., Harikane, Y., Ouchi, M., et al. 2022, ApJ, 931, 97, doi: 10.3847/1538-4357/ac69de
2022 doi
-
[20]
2020, A&A, 635, A82, doi: 10.1051/0004-6361/201937339
Leclercq, F., Bacon, R., Verhamme, A., et al. 2020, A&A, 635, A82, doi: 10.1051/0004-6361/201937339
2020 doi
-
[21]
2022, ApJ, 940, 40, doi: 10.3847/1538-4357/ac9af2
Liu, C., Gebhardt, K., Kollatschny, W., et al. 2022, ApJ, 940, 40, doi: 10.3847/1538-4357/ac9af2
2022 doi
-
[22]
K., Fumagalli, M., Fossati, M., et al
Lofthouse, E. K., Fumagalli, M., Fossati, M., et al. 2020, MNRAS, 491, 2057, doi: 10.1093/mnras/stz3066 Lujan Niemeyer, M., Komatsu, E., Byrohl, C., et al. 2022a, ApJ, 929, 90, doi: 10.3847/1538-4357/ac5cb8 Lujan Niemeyer, M., Bowman, W. P., Ciardullo, R., et al. 2022b, ApJL, ...
2020 doi
-
[23]
2024, MNRAS, 529, 2794, doi: 10.1093/mnras/stae673 Mentuch Cooper, E., Gebhardt, K., Davis, D., et al
Matthee, J., Golling, C., Mackenzie, R., et al. 2024, MNRAS, 529, 2794, doi: 10.1093/mnras/stae673 Mentuch Cooper, E., Gebhardt, K., Davis, D., et al. 2023, ApJ, 943, 177, doi: 10.3847/1538-4357/aca962
2024 doi
-
[24]
2021, ApJ, 909, 117, doi: 10.3847/1538-4357/abd2af
Momose, R., Shimasaku, K., Kashikawa, N., et al. 2021, ApJ, 909, 117, doi: 10.3847/1538-4357/abd2af
2021 doi
-
[25]
J., et al
Mukae, S., Ouchi, M., Hill, G. J., et al. 2020, ApJ, 903, 24, doi: 10.3847/1538-4357/abb81b
2020 doi
-
[26]
2021, MNRAS, 508, 5612, doi: 10.1093/mnras/stab2933
Muzahid, S., Schaye, J., Cantalupo, S., et al. 2021, MNRAS, 508, 5612, doi: 10.1093/mnras/stab2933
2021 doi
-
[27]
M., Fisher, D
Nielsen, N. M., Fisher, D. B., Kacprzak, G. G., et al. 2024, Nature Astronomy, doi: 10.1038/s41550-024-02365-x Planck Collaboration, Aghanim, N., Akrami, Y., et al. 2020, A&A, 641, A6, doi: 10.1051/0004-6361/201833910
2024 doi
-
[28]
2023, MNRAS, 524, 1933, doi: 10.1093/mnras/stad1906
Qezlou, M., Bird, S., Lidz, A., et al. 2023, MNRAS, 524, 1933, doi: 10.1093/mnras/stad1906
2023 doi
-
[29]
W., Adams, M
Ramsey, L. W., Adams, M. T., Barnes, T. G., et al. 1998, in Society of Photo-Optical Instrumentation Engineers (SPIE) Conference Series, Vol. 3352, Advanced Technology Optical/IR Telescopes VI, ed. L. M. Stepp, 34–42, doi: 10.1117/12.319287
1998 doi
-
[30]
1998, ARA&A, 36, 267, doi: 10.1146/annurev.astro.36.1.267
Rauch, M. 1998, ARA&A, 36, 267, doi: 10.1146/annurev.astro.36.1.267
1998 doi
-
[31]
C., Steidel, C
Rudie, G. C., Steidel, C. C., Trainor, R. F., et al. 2012, ApJ, 750, 67, doi: 10.1088/0004-637X/750/1/67
2012 doi
-
[32]
2007, ApJS, 172, 1, doi: 10.1086/516585
Scoville, N., Aussel, H., Brusa, M., et al. 2007, ApJS, 172, 1, doi: 10.1086/516585
2007 doi
-
[33]
E., Steidel, C
Shapley, A. E., Steidel, C. C., Pettini, M., & Adelberger, K. L. 2003, ApJ, 588, 65, doi: 10.1086/373922
2003 doi
-
[34]
L., Gebhardt, K., et al
Song, M., Finkelstein, S. L., Gebhardt, K., et al. 2014, ApJ, 791, 3, doi: 10.1088/0004-637X/791/1/3
2014 doi
-
[35]
C., Bogosavljevi´ c, M., Shapley, A
Steidel, C. C., Bogosavljevi´ c, M., Shapley, A. E., et al. 2011, ApJ, 736, 160, doi: 10.1088/0004-637X/736/2/160
2011 doi
-
[36]
C., Erb, D
Steidel, C. C., Erb, D. K., Shapley, A. E., et al. 2010, ApJ, 717, 289, doi: 10.1088/0004-637X/717/1/289 16
2010 doi
-
[37]
S., & Werk, J
Tumlinson, J., Peeples, M. S., & Werk, J. K. 2017, ARA&A, 55, 389, doi: 10.1146/annurev-astro-091916-055240
2017 doi
-
[38]
K., et al
Tumlinson, J., Thom, C., Werk, J. K., et al. 2011, Science, 334, 948, doi: 10.1126/science.1209840
2011 doi
-
[39]
Strom, A. L. 2014, MNRAS, 445, 794, doi: 10.1093/mnras/stu1801
2014 doi
-
[40]
E., et al
Virtanen, P., Gommers, R., Oliphant, T. E., et al. 2020, Nature Methods, 17, 261, doi: 10.1038/s41592-019-0686-2
2020 doi
-
[41]
H., Davis, D., Gebhardt, K., et al
Weiss, L. H., Davis, D., Gebhardt, K., et al. 2024, ApJ, 962, 102, doi: 10.3847/1538-4357/ad1b51
2024 doi
-
[42]
H., Gebhardt, K., Davis, D., et al
Weiss, L. H., Gebhardt, K., Davis, D., et al. 2025, The Astrophysical Journal, 983, 72, doi: 10.3847/1538-4357/adc0f9
2025 doi
-
[43]
K., Prochaska, J
Werk, J. K., Prochaska, J. X., Tumlinson, J., et al. 2014, ApJ, 792, 8, doi: 10.1088/0004-637X/792/1/8
2014 doi
-
[44]
White, S. D. M., & Rees, M. J. 1978, MNRAS, 183, 341, doi: 10.1093/mnras/183.3.341
1978 doi
-
[45]
2024, ApJ, 961, 63, doi: 10.3847/1538-4357/ad07d3
Zhang, H., Cai, Z., Liang, Y., et al. 2024, ApJ, 961, 63, doi: 10.3847/1538-4357/ad07d3
2024 doi
Reviewed August 6, 2026 · model on record in the stance chip above.
Discussion (0). Continue with ORCID to comment.