BDIViz: An Interactive Visualization System for Biomedical Schema Matching with LLM-Powered Validation
Pith reviewed 2026-05-19 04:01 UTC · model grok-4.3
The pith
BDIViz combines interactive visualizations with LLM validation to raise accuracy and lower effort in biomedical schema matching.
A machine-rendered reading of the paper's core claim, the machinery that carries it, and where it could break.
Core claim
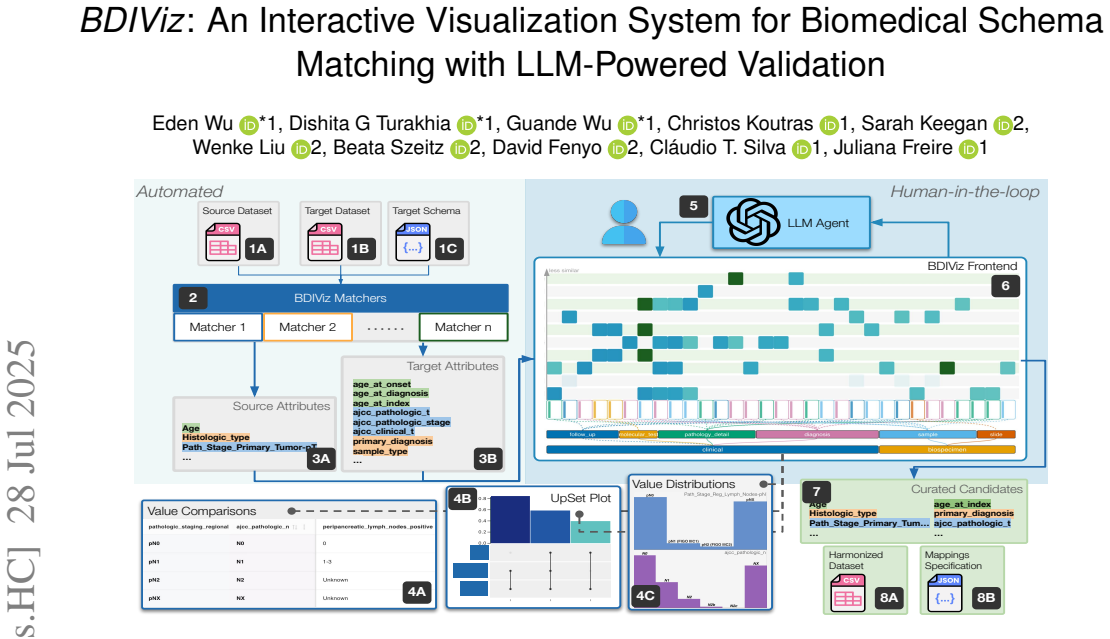
BDIViz is a visual analytics system that streamlines biomedical schema matching through an ensemble of matching methods validated by large language models, interactive heatmaps that summarize matches, and coordinated views that support quick comparison of attributes and their values. The system is method-agnostic so it can incorporate different algorithms and address both scalability for large numbers of attributes and semantic ambiguity in nuanced biomedical terms.
What carries the argument
The BDIViz interactive visualization system that uses ensemble matching plus LLM validation together with heatmaps and coordinated views to let users review and refine matches.
If this is right
- Biomedical data harmonization proceeds with higher accuracy, supporting more reliable exploratory analyses and meta-studies.
- Domain experts spend less time and mental effort on curation, freeing capacity for other tasks.
- The method-agnostic design allows quick adoption of improved matching algorithms as they become available.
- Large schemas with subtle semantic differences become manageable through visual summaries and linked views.
Where Pith is reading between the lines
- The same combination of ensemble methods, LLM checks, and coordinated visualizations could apply to schema matching in other domains that face large, semantically rich datasets.
- Further gains may come from tuning the LLM validation component to biomedical-specific language and terminology.
- Keeping the human in the loop while automating more steps could extend the approach to even larger integration projects.
Load-bearing premise
Formative studies with domain experts captured all essential requirements for an effective system and the LLM validation step improves match quality without introducing systematic errors that would escape detection in the user study.
What would settle it
A controlled within-subject study in which domain experts using BDIViz achieve no higher matching accuracy or require equal or greater time than when using baseline tools, or in which LLM suggestions produce consistent errors that experts fail to catch.
Figures


read the original abstract
Biomedical data harmonization is essential for enabling exploratory analyses and meta-studies, but the process of schema matching - identifying semantic correspondences between elements of disparate datasets (schemas) - remains a labor-intensive and error-prone task. Even state-of-the-art automated methods often yield low accuracy when applied to biomedical schemas due to the large number of attributes and nuanced semantic differences between them. We present BDIViz, a novel visual analytics system designed to streamline the schema matching process for biomedical data. Through formative studies with domain experts, we identified key requirements for an effective solution and developed interactive visualization techniques that address both scalability challenges and semantic ambiguity. BDIViz employs an ensemble approach that combines multiple matching methods with LLM-based validation, summarizes matches through interactive heatmaps, and provides coordinated views that enable users to quickly compare attributes and their values. Our method-agnostic design allows the system to integrate various schema matching algorithms and adapt to application-specific needs. Through two biomedical case studies and a within-subject user study with domain experts, we demonstrate that BDIViz significantly improves matching accuracy while reducing cognitive load and curation time compared to baseline approaches.
Editorial analysis
A structured set of objections, weighed in public.
Referee Report
Summary. The paper introduces BDIViz, an interactive visual analytics system for biomedical schema matching. It combines an ensemble of matching algorithms with LLM-based validation, interactive heatmaps for summarizing matches, and coordinated views for comparing attributes and values. Formative studies informed the design; two biomedical case studies and a within-subject user study with domain experts are used to claim significant gains in matching accuracy, reduced cognitive load, and shorter curation time versus baselines. The system is presented as method-agnostic and adaptable.
Significance. If the evaluation claims hold under proper controls, BDIViz could meaningfully advance biomedical data harmonization by reducing the labor and error rates in schema matching, a persistent bottleneck for meta-studies and integrative analyses. The combination of visualization techniques with LLM validation and the method-agnostic architecture are practical strengths that could be adopted in related domains.
major comments (1)
- [User Study] User Study section: The within-subject design does not report counterbalancing of condition order, washout periods, or post-hoc analysis for order effects. This leaves open the possibility that familiarity gained from the baseline condition inflates accuracy, time, and cognitive-load gains attributed to BDIViz, directly weakening the central claim of significant improvement.
minor comments (2)
- [Abstract] Abstract: No information is given on participant count, statistical tests, exact baseline systems, or how LLM validation errors were quantified, making the strength of the reported improvements hard to judge from the summary alone.
- [Case Studies] Case Studies: Additional detail on the specific schemas, number of attributes, and concrete examples of LLM validation correcting or introducing errors would improve reproducibility and allow readers to assess the practical impact.
Simulated Author's Rebuttal
We thank the referee for their constructive feedback, which highlights an important aspect of reporting transparency in our user study. We address the major comment below and will revise the manuscript to incorporate additional details that strengthen the validity of our evaluation.
read point-by-point responses
-
Referee: The within-subject design does not report counterbalancing of condition order, washout periods, or post-hoc analysis for order effects. This leaves open the possibility that familiarity gained from the baseline condition inflates accuracy, time, and cognitive-load gains attributed to BDIViz, directly weakening the central claim of significant improvement.
Authors: We agree that these details are essential for fully substantiating the within-subject comparison and should have been explicitly reported. In the revised manuscript, we will expand the User Study section to describe the counterbalancing of condition order (via a Latin-square design across the 12 participants), the 10-minute washout period inserted between conditions to reduce carry-over effects, and the results of a post-hoc mixed-effects analysis showing no significant order-by-condition interactions for accuracy, completion time, or NASA-TLX scores. These additions will directly address the concern about potential inflation of BDIViz gains and reinforce the central claims. revision: yes
Circularity Check
No significant circularity; claims rest on empirical user studies and case studies
full rationale
The paper describes a visualization system evaluated via formative studies with domain experts, two biomedical case studies, and a within-subject user study. No equations, model derivations, fitted parameters, or predictions are present that could reduce to self-definitional loops or self-citation chains. The central claims of improved matching accuracy and reduced cognitive load are supported by external participant data and performance metrics rather than by renaming inputs as outputs or importing uniqueness from prior self-work. The evaluation chain is self-contained against the reported studies and does not rely on any of the enumerated circular patterns.
Axiom & Free-Parameter Ledger
axioms (1)
- domain assumption LLM-based validation can be trusted to improve match quality in biomedical schemas when combined with human review
Lean theorems connected to this paper
-
IndisputableMonolith/Foundation/RealityFromDistinction.leanreality_from_one_distinction unclear?
unclearRelation between the paper passage and the cited Recognition theorem.
BDIViz employs an ensemble approach that combines multiple matching methods with LLM-based validation, summarizes matches through interactive heatmaps...
-
IndisputableMonolith/Cost/FunctionalEquation.leanwashburn_uniqueness_aczel unclear?
unclearRelation between the paper passage and the cited Recognition theorem.
NASA TLX ... accuracy ... reduced cognitive load and curation time
What do these tags mean?
- matches
- The paper's claim is directly supported by a theorem in the formal canon.
- supports
- The theorem supports part of the paper's argument, but the paper may add assumptions or extra steps.
- extends
- The paper goes beyond the formal theorem; the theorem is a base layer rather than the whole result.
- uses
- The paper appears to rely on the theorem as machinery.
- contradicts
- The paper's claim conflicts with a theorem or certificate in the canon.
- unclear
- Pith found a possible connection, but the passage is too broad, indirect, or ambiguous to say the theorem truly supports the claim.
Reference graph
Works this paper leans on
- [1]
-
[2]
doi: 10.1145/2470654.2470724 3
-
[3]
D. Aumueller, H.-H. Do, S. Massmann, and E. Rahm. Schema and ontology matching with COMA++. 2005. doi: 10.1145/1066157.1066283 2
-
[4]
https://github.com/ VIDA-NYU/bdi-kit, 2024
bdi-kit: Python library for data harmonization. https://github.com/ VIDA-NYU/bdi-kit, 2024. 5, 6
work page 2024
- [5]
-
[6]
A. Bonifati and Y . Velegrakis. Schema matching and mapping: from usage to evaluation. In Proceedings of the 14th International Conference on Extending Database Technology, 2011. doi: 10.1145/1951365.1951431 1
-
[7]
R. Cappuzzo, P. Papotti, and S. Thirumuruganathan. Creating embeddings of heterogeneous relational datasets for data integration tasks. In Proceed- ings of the ACM SIGMOD International Conference on Management of Data, p. 1335–1349. ACM, 2020. doi: 10.1145/3318464.3389742 2
-
[8]
R. Chen, D. Weng, Y . Huang, X. Shu, J. Zhou, G. Sun, and Y . Wu. Rigel: Transforming tabular data by declarative mapping. IEEE Trans. Vis. Comput. Graph., 2023. doi: 10.1109/TVCG.2022.3209385 3
-
[9]
C. Cheng, L. Messerschmidt, I. Bravo, M. Waldbauer, R. Bhavikatti, C. Schenk, V . Grujic, T. Model, R. Kubinec, and J. Barceló. A general primer for data harmonization. Scientific Data, 2024. doi: 10.1038/s41597 -024-02956-3 1
-
[10]
D. J. Clark, S. M. Dhanasekaran, F. Petralia, J. Pan, X. Song, Y . Hu, F. da Veiga Leprevost, B. Reva, T.-S. M. Lih, H.-Y . Chang, et al. Integrated proteogenomic characterization of clear cell renal cell carcinoma. Cell,
-
[11]
doi: 10.1016/j.cell.2019.12.026 4
-
[12]
T. Cong, F. Nargesian, and H. Jagadish. Pylon: Semantic table union search in data lakes. 2023. doi: 10.48550/arXiv.2301.04901 1
-
[13]
H.-H. Do and E. Rahm. Chapter 53 - coma — a system for flexible combination of schema matching approaches. In VLDB ’02: Proceedings of the 28th International Conference on Very Large Databases. 2002. doi: 10.1016/B978-155860869-6/50060-3 2, 3
-
[14]
Y . Dou, E. A. Kawaler, et al. Proteogenomic characterization of endome- trial carcinoma. Cell, 2020. doi: 10.1016/j.cell.2020.01.026 8
- [15]
-
[16]
A. Endert, W. Ribarsky, C. Turkay, B. W. Wong, I. Nabney, I. D. Blanco, and F. Rossi. The state of the art in integrating machine learning into visual analytics. Computer Graphics Forum, 2017. doi: 10.1111/cgf.13092 4
-
[17]
S. M. Falconer and N. F. Noy. Interactive Techniques to Support Ontology Matching. 2010. doi: 10.1007/978-3-642-16518-4_2 1
-
[18]
N. F. Fernandez, G. W. Gundersen, A. Rahman, M. L. Grimes, K. Rikova, P. Hornbeck, and A. Ma’ayan. Clustergrammer, a web-based heatmap visu- alization and analysis tool for high-dimensional biological data. Scientific data, 2017. doi: 10.1038/sdata.2017.151 3
-
[19]
R. C. Fernandez, E. Mansour, et al. Seeping semantics: Linking datasets using word embeddings for data discovery. In IEEE Int. Conf. Data Eng. (ICDE), 2018. doi: 10.1109/ICDE.2018.00093 2
- [20]
-
[21]
Genomic data commons data portal, 2023. 7
work page 2023
-
[22]
M. Ghoniem, J.-D. Fekete, and P. Castagliola. On the readability of graphs using node-link and matrix-based representations: A controlled experiment and statistical analysis. Information Visualization, 2005. doi: 10.1057/palgrave.ivs.9500092 3, 4
-
[23]
M. A. Gillette, S. Satpathy, et al. Proteogenomic characterization reveals therapeutic vulnerabilities in lung adenocarcinoma. Cell, 2020. doi: 10. 1016/j.cell.2020.06.013 9
work page 2020
-
[24]
J. Goguen and R. Zhuang. A categorical approach to generalized inter- operability. In Proceedings of the 24th ACM SIGMOD-SIGACT-SIGART Symposium on Principles of Database Systems (PODS) , 2005. doi: 10. 1007/3-540-45719-4_29 1
work page 2005
-
[25]
R. Gove, N. Gramsky, R. Kirby, E. Sefer, A. Sopan, C. Dunne, B. Shneider- man, and M. Taieb-Maimon. Netvisia: Heat map & matrix visualization of dynamic social network statistics & content. In IEEE 3rd Int. Conf. Pri- vacy, Secur., Risk Trust (PASSAT) and IEEE 3rd Int. Conf. Social Comput. (SocialCom), 2011. doi: 10.1109/PASSAT/SOCIALCOM.2011.216 3
-
[26]
R. L. Grossman. Ten lessons for data sharing with a data commons. Scientific Data, 2023. doi: 10.1038/s41597-023-02029-x 1, 2
-
[27]
S. G. Hart and L. E. Staveland. Nasa task load index (tlx): Paper and pencil package, 1986. 2
work page 1986
-
[28]
A. P. Heath, V . Ferretti, et al. The nci genomic data commons. Nature Genetics, 2021. doi: 10.1038/s41588-021-00791-5 1, 2
-
[29]
J. Heer and B. Shneiderman. Interactive dynamics for visual analysis: A taxonomy of tools that support the fluent and flexible use of visualizations. Queue, 2012. doi: 10.1145/2133416.2146416 4
-
[30]
N. Henry and J.-d. Fekete. Matrixexplorer: a dual-representation system to explore social networks. IEEE Trans. Vis. Comput. Graph., 2006. doi: 10.1109/TVCG.2006.160 3, 4
-
[31]
F. Hohman, K. Wongsuphasawat, M. B. Kery, and K. Patel. Understanding and visualizing data iteration in machine learning. In Proceedings of the 2020 CHI Conference on Human Factors in Computing Systems , 2020. doi: 10.1145/3313831.3376177 4
-
[32]
D. Holten. Hierarchical edge bundles: Visualization of adjacency relations in hierarchical data. IEEE Trans. Vis. Comput. Graph., 2006. doi: 10. 1109/TVCG.2006.147 4
work page 2006
-
[33]
Implicit multidimensional projection of local subspaces,
T. Horak, P. Berger, H. Schumann, R. Dachselt, and C. Tominski. Re- sponsive matrix cells: A focus+context approach for exploring and editing multivariate graphs. IEEE Trans. Vis. Comput. Graph., 2021. doi: 10. 1109/TVCG.2020.3030371 3
-
[34]
P. Isokoski, J. Kangas, and P. Majaranta. Useful approaches to exploratory analysis of gaze data: enhanced heatmaps, cluster maps, and transition maps. In Proceedings of the 2018 ACM Symposium on Eye Tracking Research & Applications, 2018. doi: 10.1145/3204493.3204591 3
-
[35]
S. Kandel, J. Heer, C. Plaisant, J. Kennedy, F. van Ham, N. H. Riche, C. Weaver, B. Lee, D. Brodbeck, and P. Buono. Research directions in data wrangling: Visualizations and transformations for usable and credible data. Information Visualization, 2011. doi: 10.1177/1473871611415994 3
-
[36]
S. Kandel, A. Paepcke, J. Hellerstein, and J. Heer. Wrangler: interactive visual specification of data transformation scripts. In Proceedings of the SIGCHI Conference on Human Factors in Computing Systems, 2011. doi: 10.1145/1978942.1979444 3
-
[37]
M. Kayali, A. Lykov, I. Fountalis, N. Vasiloglou, D. Olteanu, and D. Suciu. CHORUS: foundation models for unified data discovery and exploration. Proc. VLDB Endow., 2024. doi: 10.14778/3659437.3659461 1
-
[38]
A. Khatiwada, G. Fan, R. Shraga, Z. Chen, W. Gatterbauer, R. J. Miller, and M. Riedewald. Santos: Relationship-based semantic table union search. Proceedings of the ACM on Management of Data, 2023. doi: 10. 1145/3588689 1
work page 2023
-
[39]
C. Koutras, K. Psarakis, G. Siachamis, A. Ionescu, M. Fragkoulis, A. Boni- fati, and A. Katsifodimos. Valentine in action: matching tabular data at scale. Proceedings of the VLDB Endowment (PVLDB) , 2021. doi: 10. 14778/3476311.3476366 3
-
[40]
C. Koutras, G. Siachamis, A. Ionescu, K. Psarakis, J. Brons, M. Fragkoulis, C. Lofi, A. Bonifati, and A. Katsifodimos. Valentine: Evaluating matching techniques for dataset discovery. In IEEE Int. Conf. Data Eng. (ICDE),
-
[41]
doi: 10.1109/ICDE51399.2021.00047 1, 2, 6
-
[42]
C. Koutras, J. Zhang, X. Qin, C. Lei, V . Ioannidis, C. Faloutsos, G. Karypis, and A. Katsifodimos. Omnimatch: Effective self-supervised any-join discovery in tabular data repositories. arXiv preprint arXiv:2403.07653,
-
[43]
doi: 10.48550/ARXIV.2403.07653 2
-
[44]
A. Lex, N. Gehlenborg, H. Strobelt, R. Vuillemot, and H. Pfister. Upset: visualization of intersecting sets. IEEE Trans. Vis. Comput. Graph., 2014. doi: 10.1109/TVCG.2014.2346248 5
- [45]
-
[46]
G. X. Li, L. Chen, et al. Comprehensive proteogenomic characterization of rare kidney tumors. Cell Reports Medicine, 2024. doi: 10.1016/j.xcrm. 2024.101547 7
-
[47]
P. Li, Y . He, D. Yashar, W. Cui, S. Ge, H. Zhang, D. Rifinski Fainman, D. Zhang, and S. Chaudhuri. Table-gpt: Table fine-tuned gpt for diverse table tasks. Proc. ACM Manag. Data, 2024. doi: 10.1145/3654979 2
-
[48]
S. Li, R. J. Crouser, G. Griffin, C. Gramazio, H.-J. Schulz, H. Childs, and R. Chang. Exploring hierarchical visualization designs using phylogenetic trees. In Visualization and Data Analysis 2015, 2015. doi: 10.1117/12. 2078857 3
work page doi:10.1117/12 2015
-
[49]
Y . Li, Y . Dou, F. D. V . Leprevost, Y . Geffen, A. P. Calinawan, F. Aguet, Y . Akiyama, S. Anand, C. Birger, S. Cao, et al. Proteogenomic data and resources for pan-cancer analysis. Cancer cell, 2023. doi: 10.1016/j.ccell. 2023.06.009 2
-
[50]
Y . Liu, E. Pena, A. Santos, E. Wu, and J. Freire. Magneto: Combining small and large language models for schema matching. Proceedings of the VLDB Endowment , 2025. To appear. Preprint available at https: //arxiv.org/abs/2412.08194. doi: 10.14778/3742728.3742757 1, 2, 3, 6, 8
-
[51]
Y . Liu, A. Santos, E. H. Pena, R. Lopez, E. Wu, and J. Freire. Enhancing biomedical schema matching with llm-based training data generation. In NeurIPS 2024 Third Table Representation Learning Workshop, 2024. 2, 6
work page 2024
-
[52]
P. Mork, L. Seligman, A. Rosenthal, J. Korb, and C. Wolf. The harmony integration workbench. Journal on Data Semantics XI , 2008. doi: 10. 1007/978-3-540-92148-6_3 2
work page 2008
-
[53]
A. Narayan, I. Chami, L. Orr, and C. Ré. Can foundation models wrangle your data? Proc. VLDB Endow., 2022. doi: 10.14778/3574245.3574258 1
-
[54]
Proteomics data commons (pdc), 2024
National Cancer Institute. Proteomics data commons (pdc), 2024. 1, 7
work page 2024
-
[55]
National Library of Medicine. Pubmed. https://pubmed.ncbi.nlm. nih.gov/, 2024. Accessed: 2025-03-30. 1
work page 2024
-
[56]
C. Nobre, M. Meyer, M. Streit, and A. Lex. The state of the art in visualizing multivariate networks. Computer Graphics Forum, 2019. doi: 10.1111/cgf.13728 3, 4
- [57]
-
[58]
2025, arXiv e-prints, arXiv:2510.13477, doi:10.48550/arXiv
M. Parciak, B. Vandevoort, F. Neven, L. M. Peeters, and S. Vansummeren. Schema matching with large language models: an experimental study. Proceedings of the VLDB Endowment. ISSN, 2024. doi: 10.48550/arXiv. 2407.11852 2
work page internal anchor Pith review doi:10.48550/arxiv 2024
-
[59]
E. Peukert, J. Eberius, and E. Rahm. Amc - a framework for modelling and comparing matching systems as matching processes. In IEEE Int. Conf. Data Eng. (ICDE), 2011. doi: 10.1109/ICDE.2011.5767940 2
-
[60]
L. Popa, M. Hernandez, Y . Velegrakis, R. Miller, F. Naumann, and H. Ho. Mapping xml and relational schemas with clio. In Proceedings 18th International Conference on Data Engineering, 2002. doi: 10.1109/ICDE. 2002.994768 2
- [61]
-
[62]
E. Rahm and P. A. Bernstein. A survey of approaches to automatic schema matching. the VLDB Journal, 2001. doi: 10.1007/S007780100057 2
-
[63]
Large language models help humans verify truthfulness – except when they are convincingly wrong
N. Reimers and I. Gurevych. Sentence-BERT: Sentence embeddings using Siamese BERT-networks. In EMNLP-IJCNLP, 2019. doi: 10.18653/v1/ D19-1410 6
- [64]
-
[65]
doi: 10.1016/j.neucom.2017.01.105 4
-
[66]
H.-J. Schulz. Treevis. net: A tree visualization reference. IEEE Comput. Graph. Appl., 2011. doi: 10.1109/MCG.2011.103 3
-
[67]
L. Seligman, P. Mork, A. Halevy, K. Smith, M. J. Carey, K. Chen, C. Wolf, J. Madhavan, A. Kannan, and D. Burdick. Openii: an open source infor- mation integration toolkit. In Proceedings of the 2010 ACM SIGMOD International Conference on Management of data, 2010. doi: 10.1145/ 1807167.1807285 2
-
[68]
B. Shneiderman. Tree visualization with tree-maps: 2-d space-filling approach. ACM Transactions on graphics (TOG), 1992. doi: 10.1145/ 102377.115768 3
-
[69]
Z. Stark, D. Glazer, O. Hofmann, A. Rendon, C. R. Marshall, G. S. Gins- burg, C. Lunt, N. Allen, M. Effingham, J. Hastings Ward, et al. A call to action to scale up research and clinical genomic data sharing. Nature Reviews Genetics, 2024. doi: 10.1038/s41576-024-00776-0 1
-
[70]
Y . Sun, L. Xu, Y . Li, J. Lin, H. Li, Y . Gao, X. Huang, H. Zhu, Y . Zhang, K. Wei, et al. Single-cell transcriptomics uncover key regulators of skin regeneration in human long-term mechanical stretch-mediated expansion therapy. Frontiers in Cell and Developmental Biology , 2022. doi: 10. 3389/fcell.2022.865983 3
-
[71]
S. M. Sweeney, H. K. Hamadeh, N. Abrams, S. J. Adam, S. Brenner, D. E. Connors, G. J. Davis, L. D. Fiore, S. H. Gawel, R. L. Grossman, et al. Case studies for overcoming challenges in using big data in cancer. Cancer research, 2023. doi: 10.1158/0008-5472.CAN-22-1277 1
-
[72]
R. R. Thangudu, M. Holck, D. Singhal, A. Pilozzi, N. Edwards, P. A. Rudnick, M. J. Domagalski, P. Chilappagari, L. Ma, Y . Xin, et al. Nci’s proteomic data commons: A cloud-based proteomics repository empow- ering comprehensive cancer analysis through cross-referencing with ge- nomic and imaging data. Cancer Research Communications, 2024. doi: 10.1158/276...
-
[73]
A. Tiessen, E. A. Cubedo-Ruiz, and R. Winkler. Improved representation of biological information by using correlation as distance function for heatmap cluster analysis. American Journal of Plant Sciences, 2017. doi: 10.4236/ajps.2017.83035 3
-
[74]
N. VIDA. Bdiviz: Interactive schema matching. https://github.com/ VIDA-NYU/bdi-viz, 2025. 2, 6
work page 2025
-
[75]
D. Wang, J. D. Weisz, M. Muller, P. Ram, W. Geyer, C. Dugan, Y . Tausczik, H. Samulowitz, and A. Gray. Human-ai collaboration in data science: Exploring data scientists’ perceptions of automated ai. Proc. ACM Hum.- Comput. Interact., 2019. doi: 10.1145/3359313 4
-
[76]
Z. Wang, T. M. Davidsen, G. R. Kuffel, K. Addepalli, A. Bell, E. Casas- Silva, H. Dingerdissen, K. Farahani, A. Fedorov, S. Gaheen, et al. Nci cancer research data commons: resources to share key cancer data.Cancer Research, 2024. doi: 10.1158/0008-5472.CAN-23-2468 1
-
[77]
J. Wei, X. Wang, D. Schuurmans, M. Bosma, B. Ichter, F. Xia, E. Chi, Q. Le, and D. Zhou. Chain-of-thought prompting elicits reasoning in large language models. In NeurIPS, 2022. 6
work page 2022
-
[78]
M. D. Wilkinson, M. Dumontier, I. J. Aalbersberg, G. Appleton, M. Axton, A. Baak, N. Blomberg, J.-W. Boiten, L. B. da Silva Santos, P. E. Bourne, et al. The fair guiding principles for scientific data management and stewardship. Scientific data, 2016. doi: 10.1038/sdata.2016.18 1
-
[79]
N. Woldmar, A. Schwendenwein, M. Kuras, B. Szeitz, K. Boettiger, A. Tisza, V . László, L. Reiniger, A. Bagó, Z. Szállási, J. Moldvay, A. Szász, J. Malm, P. Horvatovich, L. Pizzatti, G. Domont, F. Rényi-Vámos, K. Hoetzenecker, M. Hoda, G. Marko-Varga, K. Schelch, Z. Megyesfalvi, M. Rezeli, and B. Döme. Proteomic analysis of brain metastatic lung ade- nocar...
-
[80]
K. Wongsuphasawat, D. Moritz, A. Anand, J. Mackinlay, B. Howe, and J. Heer. V oyager: Exploratory analysis via faceted browsing of visualiza- tion recommendations. IEEE Trans. Vis. Comput. Graph., 2016. doi: 10. 1109/TVCG.2015.2467191 4
discussion (0)
Sign in with ORCID, Apple, or X to comment. Anyone can read and Pith papers without signing in.