REVIEW 2 major objections 6 minor 86 references
Write, Rank, or Rate: Comparing Methods for Studying Visualization Affordances
T0 review · 2 major / 6 minor · reviewed 2026-08-06 · deepseek-v4-flash
Pith's one-line read Structured chart tasks can approximate, but not replace, free-response studies of what viewers take away from charts.
desk verdict Well-run empirical comparison with an abstract that overclaims: the 'combined proxy' is never actually combined or tested. read the letter →
The pith
A machine-rendered reading of the paper's core claim, the machinery that carries it, and where it could break.
The reading
What carries the argument
The load-bearing object is the five-factor taxonomy of chart takeaways: Points, Small Trends, Shape, Large Trends, and Clusters. This taxonomy was derived from exploratory factor analysis of participants' free-response conclusions in a preliminary study, and it drives the entire comparison: stimuli are built from it, coding in Study 1 uses it, and the takeaways ranked or rated in Studies 2 through 4 are constructed to represent it. If the taxonomy is incomplete or does not generalize, every subsequent method is evaluated only against its five categories, and any affordance outside those categories would be invisible to all four methods.
What would settle it
A reader could test this by conducting an independent free-response study in which participants are not shown the five factors, then having independent coders label the responses without using the taxonomy. If new takeaway categories emerge (for example, uncertainty judgments or distribution comparisons), or if the coders disagree on where responses like 'revenue peaked in Year 5' fit, the taxonomy's completeness would be shown to be too narrow to support the method comparison.
Extended reading notes
Core claim
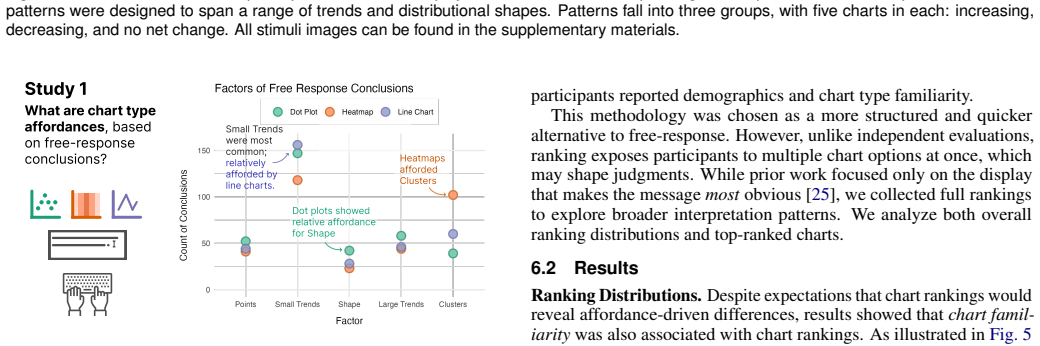
The central claim is that while no method fully replicates the affordances observed in free-response conclusions, combinations of ranking and rating methods can serve as an effective proxy at a broad scale. Across four crowdsourced studies, free-response data showed that heatmaps afford Clusters, line charts afford Small Trends, and dot plots afford Shape or Points depending on the method. Chart-ranking tasks were biased by familiarity and overall preference for line charts, conclusion-ranking tasks partially aligned with free-response for heatmaps and line charts but inflated the salience of Shape, and salience ratings captured overall patterns like Small Trends but missed chart-specific affordances. The paper also claims that GPT-4o, prompted with the same instructions as human participants, performs best as a human proxy for the salience-rating methodology but suffers from severe constraints, including inaccuracies, low diversity, and strong default preferences, in the other three methods.
Load-bearing premise
The entire comparison depends on the five-factor taxonomy (Points, Small Trends, Shape, Large Trends, Clusters) being a complete and valid representation of the takeaways readers actually form from these charts; if the factor analysis missed or merged categories, every method inherits that bias.
Editorial extensions
If this is right
- If the ranking and rating combination works as claimed, researchers studying these three chart types can substitute structured tasks for free-response coding to detect broad affordance patterns at lower cost.
- The familiarity bias documented in chart ranking (line charts ranked highest and correlated with self-reported familiarity) implies that ranking-based affordance signals should be interpreted cautiously when chart familiarity varies.
- The salience-rating method's failure to find chart-specific interactions suggests that what is visually salient is not equivalent to what readers spontaneously take away, a distinction that matters for selecting evaluation metrics.
- The GPT-4o case study implies that out-of-the-box LLMs are not yet reliable proxies for human free-response or ranking data, but their salience ratings may be usable as a coarse screening tool for candidate takeaways.
- Because the five-factor taxonomy is used as the common coding scheme, any new chart type or dataset that produces a different kind of takeaway would require extending the taxonomy before the method comparison would apply.
Reading between the lines
- The paper's method comparison is a template that could be applied to other chart families (bar charts, scatterplots, area charts) to test whether the ranking-plus-rating proxy generalizes beyond line charts, dot plots, and heatmaps.
- The factor analysis that produced the five-factor taxonomy was conducted on time-series data with a limited set of trends; an independent replication on a wider range of data shapes could either validate the taxonomy or reveal that some affordances (e.g., distributional comparisons, uncertainty judgments) are missing.
- A natural extension would be to give GPT-4o the same combination task (e.g., rank-then-rate) and measure whether the combination reduces the model's default preferences, since the paper only evaluates each method in isolation.
- The observed discrepancy between free-response (Shape rarely mentioned) and conclusion-ranking (Shape ranked highest) suggests that comparative tasks may systematically alter perceived affordances; this could be tested directly by asking participants to generate their own takeaways after completing a ranking task and comparing the two outputs.
Editorial analysis
A structured set of objections, weighed in public.
Referee Report
Summary. The paper compares four methods for eliciting visualization affordances (free response, chart ranking, conclusion ranking, salience rating) across line charts, dot plots, and heatmaps, and additionally evaluates GPT-4o as a human proxy. A preliminary study derives a five-factor taxonomy of takeaways (Points, Small Trends, Shape, Large Trends, Clusters). Study 1 establishes free-response benchmark affordances: heatmaps afford Clusters, line charts afford Small Trends, dot plots afford Shape. Studies 2–4 evaluate the structured methods; each partially aligns with the benchmark but shows distinct biases (familiarity-driven line-chart preference, inflated Shape rankings, and absence of chart-specific interaction, respectively). The GPT-4o case study finds salience ratings most closely match human patterns. The abstract claims that combinations of ranking and rating methods can serve as an effective proxy, but no combination is actually tested.
Significance. If its central claim were supported, this paper would provide a valuable, cost-effective alternative to labor-intensive free-response coding in visualization affordance research. The empirical work has notable strengths: a priori power analyses, a large participant sample (N≈1,350 across studies), double-coding with κ=0.73, chi-square residual analyses, and a systematic human–LLM comparison. The proposed chart-specific affordances (heatmaps–Clusters, line charts–Small Trends) are concrete and falsifiable. However, the main contribution is undermined by the untested combination claim and the unvalidated, underreported taxonomy; the paper is a solid descriptive comparison but not yet a demonstration of the proxy method.
major comments (2)
- [Abstract; Sec. 10] The abstract's central claim—that combinations of ranking and rating methods can serve as an effective proxy at a broad scale—is never directly tested. Studies 2–4 are analyzed individually, and each has a distinct failure mode: Study 2 rankings are dominated by a line-chart preference correlated with familiarity (Sec. 6.2); Study 3 ranks Shape highest across all chart types even though Shape was the least common free-response factor (Sec. 7.2); Study 4 reports no significant chart type × factor interaction (Sec. 8.2). Section 10 only suggests that salience ratings and conclusion rankings "could triangulate" patterns, without specifying an ensemble, weighting, or decision rule, and without comparing such a combination against the Study 1 benchmark. The inference from partial overlaps to an effective combined proxy is therefore unsupported. Please either soften the claim to a hypothesis or add an explicit post-hoc combination analysis—for example, a decision rule that aggregates first-ranked conclusions from Study 3 and top-rated factors from Study 4 per chart type and evaluates agreement with Study 1 factor frequencies.
- [Sec. 4.3; Sec. 11] The five-factor taxonomy from Sec. 4.3 is load-bearing: it defines the coding scheme for Study 1 and the conclusion options in Studies 2–4 and the GPT-4o prompts. Yet the factor analysis is underreported: no factor loadings, eigenvalues, BIC values, or model-comparison statistics are provided, and the choice of the five-factor model is justified only as a "balance of attributes." The taxonomy is not validated against any external coding scheme or independent dataset. The authors acknowledge in Sec. 11 that the factors "may not fully reflect the range of interpretations," but this limitation is more central than presented: if the taxonomy misses or merges affordance categories, the benchmark and all method comparisons inherit that bias, and the "proxy" claim is only about the five-factor space. Please report the factor-analysis details or validate the taxonomy independently, and reframe the contribution accordingly.
minor comments (6)
- [Sec. 9.2.1] The sentence "About 97% of human conclusions were accurate, as opposed to 63% of GPT-4o conclusions contained" is grammatically incomplete; please rewrite (e.g., "contained inaccuracies").
- [Sec. 9.2.1] The chi-square value reported for the GPT-4o free-response analysis (χ² = 46.3, df = 8) is identical to the value reported for human responses in Sec. 5.2; this appears to be an error and should be verified and corrected.
- [Sec. 6.1; Sec. 2.1] The parenthetical in "Based on the five factors from the preliminary study (Sec. 4.3, we created..." is missing a closing parenthesis; Sec. 2.1 also contains the typo "scattplots."
- [Fig. 1] The embedded figure text contains garbled spacing (e.g., "Shap e", "P oints", "S m all T ren d s"); please ensure the final PDF text is correctly vectorized.
- [Sec. 9.2.3] The phrase "GPT-4o generated overall poorly aligned relative takeaway rankings as compared to humans" is awkwardly worded; consider "GPT-4o's relative takeaway rankings aligned poorly with humans' rankings."
- [Abstract; Sec. 11] The paper would benefit from clarifying at the outset that the comparison operates within a five-factor affordance space; the current abstract's "broad scale" overstates the scope given the Sec. 11 limitation to three time-series chart types.
Circularity Check
No significant circularity: the method comparison is an empirical study with independent participant samples, and no fitted parameter is relabeled as a prediction.
full rationale
The paper is an empirical comparison rather than a derivation, so the circularity burden is low. The five-factor taxonomy from the preliminary study (Sec. 4.3) is used both to code the Study 1 free responses and to construct the response options for Studies 2-4, but this shared measurement instrument does not force the outcomes: the participants in each study are independent, and the studies produce genuinely divergent results (e.g., Shape is the least common free-response factor but the highest-ranked conclusion factor in Study 3; Study 4 finds no significant chart-type-by-factor interaction). The suggested chart affordances are descriptive summaries of observed frequencies, rankings, and ratings, not fitted parameters presented as predictions. The author self-citations, such as [40] and [74], are used for related work or for choice of GPT-4o prompting parameters and do not carry the central comparative claim. The abstract's broader claim that combinations of ranking and rating methods can serve as an effective proxy is not tested by a specified ensemble, and the completeness of the five-factor taxonomy is assumed, as the Limitations section acknowledges; these are evidentiary and external-validity concerns, not circularity.
Assumptions & free parameters
free parameters (1)
- Number of affordance factors =
5
assumptions (4)
- domain assumption Free-response elicitation is the gold standard for capturing visualization affordances.
- domain assumption The five factors from the preliminary study are an exhaustive and mutually exclusive categorization of reader takeaways.
- domain assumption Self-reported familiarity with chart types is a meaningful measure of actual familiarity.
- standard math Statistical tests treat observations as independent across trials even though each participant contributes multiple responses.
invented entities (1)
-
Five-factor affordance taxonomy (Points, Small Trends, Shape, Large Trends, Clusters)
Cite this review
Pith. "Pith review of Write, Rank, or Rate: Comparing Methods for Studying Visualization Affordances." pith.science (2026). https://pith.science/paper/AZZP3CPZ
@misc{pith2026250717024,
  author       = {Pith},
  title        = {Pith review of: Write, Rank, or Rate: Comparing Methods for Studying Visualization Affordances},
  year         = {2026},
  howpublished = {\url{https://pith.science/paper/AZZP3CPZ}},
  note         = {Machine review of arXiv:2507.17024}
}
read the original abstract
A growing body of work on visualization affordances highlights how specific design choices shape reader takeaways from information visualizations. However, mapping the relationship between design choices and reader conclusions often requires labor-intensive crowdsourced studies, generating large corpora of free-response text for analysis. To address this challenge, we explored alternative scalable research methodologies to assess chart affordances. We test four elicitation methods from human-subject studies: free response, visualization ranking, conclusion ranking, and salience rating, and compare their effectiveness in eliciting reader interpretations of line charts, dot plots, and heatmaps. Overall, we find that while no method fully replicates affordances observed in free-response conclusions, combinations of ranking and rating methods can serve as an effective proxy at a broad scale. The two ranking methodologies were influenced by participant bias towards certain chart types and the comparison of suggested conclusions. Rating conclusion salience could not capture the specific variations between chart types observed in the other methods. To supplement this work, we present a case study with GPT-4o, exploring the use of large language models (LLMs) to elicit human-like chart interpretations. This aligns with recent academic interest in leveraging LLMs as proxies for human participants to improve data collection and analysis efficiency. GPT-4o performed best as a human proxy for the salience rating methodology but suffered from severe constraints in other areas. Overall, the discrepancies in affordances we found between various elicitation methodologies, including GPT-4o, highlight the importance of intentionally selecting and combining methods and evaluating trade-offs.
Figures


Figures from the paper (5 more)


Reference graph
Works this paper leans on
- [1]
-
[2]
Aickin and H
M. Aickin and H. Gensler. Adjusting for multiple testing when reporting research results: the bonferroni vs holm methods. American journal of public health, 86(5):726–728, 1996. 5
1996
-
[3]
Ajani, E
K. Ajani, E. Lee, C. Xiong, C. N. Knaflic, W. Kemper, and S. Franconeri. Declutter and focus: Empirically evaluating design guidelines for effective data communication. IEEE Transactions on Visualization and Computer Graphics, 28(10):3351–3364, 2021. 7
2021
-
[4]
R. Amar, J. Eagan, and J. Stasko. Low-level components of analytic activity in information visualization. In Proceedings of the Proceedings of the 2005 IEEE Symposium on Information Visualization, INFOVIS ’05, p. 15. IEEE Computer Society, USA, 2005. doi: 10.1109/INFOVIS.2005.24 3
-
[5]
L. P. Argyle, E. C. Busby, N. Fulda, J. R. Gubler, C. Rytting, and D. Wingate. Out of one, many: Using language models to simulate human samples. Political Analysis, 31(3):337–351, 2023. 2, 3
2023
-
[6]
L. Battle and A. Ottley. What exactly is an insight? a literature review. In 2023 IEEE Visualization and Visual Analytics (VIS), pp. 91–95, 2023. doi: 10.1109/VIS54172.2023.00027 2
arXiv 2023
- [7]
-
[8]
A. Bendeck and J. Stasko. An empirical evaluation of the gpt-4 multimodal language model on visualization literacy tasks. IEEE VIS, pp. 1–11, 2024. to appear. doi: 10.1109/TVCG.2024.3456155 2
arXiv 2024
Show all 86 references
-
[9]
J. Bertin. Semiology of graphics; diagrams networks maps. Technical report, 1983. 3
1983
-
[10]
Bertini, M
E. Bertini, M. Correll, and S. Franconeri. Why shouldn’t all charts be scatter plots? beyond precision-driven visualizations. In 2020 IEEE Visualization Conference (VIS), pp. 206–210. IEEE Computer Society, Los Alamitos, CA, USA, oct 2020. doi: 10.1109/VIS47514.2020.00048 1, 3, 4, 9
2020
-
[11]
M. A. Borkin, A. A. V o, Z. Bylinskii, P. Isola, S. Sunkavalli, A. Oliva, and H. Pfister. What makes a visualization memorable? IEEE Transactions on Visualization and Computer Graphics, 19(12):2306–2315, 2013. 4
2013
-
[12]
J. Boy, L. Eveillard, F. Detienne, and J.-D. Fekete. Suggested interactivity: Seeking perceived affordances for information visualization. IEEE Trans- actions on Visualization and Computer Graphics, 22(1):639–648, 2015. 1
2015
-
[13]
Brehmer and T
M. Brehmer and T. Munzner. A multi-level typology of abstract visualiza- tion tasks. IEEE Transactions on Visualization and Computer Graphics, 19(12):2376–2385, 2013. 3
2013
-
[14]
Burns, C
A. Burns, C. Xiong, S. Franconeri, A. Cairo, and N. Mahyar. How to evaluate data visualizations across different levels of understanding. In 2020 IEEE Workshop on Evaluation and Beyond - Methodological Approaches to Visualization (BELIV), pp. 19–28. IEEE Computer Society, Los ...
2020
-
[15]
Cabouat, T
A.-F. Cabouat, T. He, P. Isenberg, and T. Isenberg. Previs: Perceived read- ability evaluation for visualizations. IEEE Transactions on Visualization and Computer Graphics, 2024. 7
2024
-
[16]
N. Chen, Y . Zhang, J. Xu, K. Ren, and Y . Yang. Viseval: A benchmark for data visualization in the era of large language models. IEEE VIS, 19 pages, 2024. to appear. 2
2024
-
[17]
W. S. Cleveland and R. McGill. Graphical perception: Theory, experimen- tation, and application to the development of graphical methods. Journal of the American Statistical Association, 79(387):531–554, 1984. 2
1984
-
[18]
R. J. Crouser and R. Chang. An affordance-based framework for human computation and human-computer collaboration. IEEE Transactions on Visualization and Computer Graphics, 18(12):2859–2868, 2012. 1
2012
-
[19]
Y . Cui, L. W. Ge, Y . Ding, L. Harrison, F. Yang, and M. Kay. Promises and pitfalls: Using large language models to generate visualization items. IEEE Transactions on Visualization and Computer Graphics, pp. 1–11,
-
[20]
A. K. Das, K. Mueller, and C. Xiong. Leveraging large language models for personalized public messaging. In Proceedings of the 2025 CHI Conference on Human Factors in Computing Systems Extended Abstracts (CHI LBW). ACM, Honolulu, HI, USA, 2025. Late-Breaking Work. 2, 9
2025
-
[21]
Dillion, N
D. Dillion, N. Tandon, Y . Gu, and K. Gray. Can ai language models replace human participants? Trends in Cognitive Sciences, 27(7):597–600,
-
[22]
Elhamdadi, A
H. Elhamdadi, A. Stefkovics, J. Beyer, E. Moerth, H. Pfister, C. X. Bearfield, and C. Nobre. Vistrust: a multidimensional framework and empirical study of trust in data visualizations. IEEE Transactions on Visualization and Computer Graphics, 30(1):348–358, 2023. 7
2023
-
[23]
F. Faul, E. Erdfelder, A.-G. Lang, and A. Buchner. G* power 3: A flexible statistical power analysis program for the social, behavioral, and biomedical sciences. Behavior research methods, 39(2):175–191, 2007. 4, 7
2007
-
[24]
Forsell and J
C. Forsell and J. Johansson. An heuristic set for evaluation in information visualization. In Proceedings of the International Conference on Advanced Visual Interfaces, pp. 199–206, 2010. 3, 7
2010
-
[25]
Fygenson, S
R. Fygenson, S. Franconeri, and E. Bertini. The arrangement of marks impacts afforded messages: Ordering, partitioning, spacing, and coloring in bar charts. IEEE Transactions on Visualization and Computer Graphics, 30(01):1008–1018, jan 2024. doi: 10.1109/TVCG.2023.3326590 1, 2, 3, 5
2024
-
[26]
Gilardi, M
F. Gilardi, M. Alizadeh, and M. Kubli. Chatgpt outperforms crowd workers for text-annotation tasks.Proceedings of the National Academy of Sciences, 120(30):e2305016120, 2023. 2, 3
2023
-
[27]
Gleicher, D
M. Gleicher, D. Albers, R. Walker, I. Jusufi, C. D. Hansen, and J. C. Roberts. Visual comparison for information visualization. Informa- tion Visualization, 10(4):289–309, 21 pages, oct 2011. doi: 10.1177/ 1473871611416549 1
2011
-
[28]
Goethals and L
S. Goethals and L. Rhue. One world, one opinion? the superstar effect in llm responses. arXiv preprint arXiv:2412.10281, 2024. 2
2024 arXiv
-
[29]
Gutiérrez, X
F. Gutiérrez, X. Ochoa, K. Seipp, T. Broos, and K. Verbert. Benefits and trade-offs of different model representations in decision support systems for non-expert users. In IFIP TC13 International Conference on Human- Computer Interaction, pp. 576–597. Springer, 2019. 7
2019
-
[30]
Hämäläinen, M
P. Hämäläinen, M. Tavast, and A. Kunnari. Evaluating large language models in generating synthetic hci research data: a case study. In Pro- ceedings of the 2023 CHI Conference on Human Factors in Computing Systems, pp. 1–19, 2023. 2, 3
2023
-
[31]
Harding, W
J. Harding, W. D’Alessandro, N. Laskowski, and R. Long. Ai lan- guage models cannot replace human research participants. Ai & Society, 39(5):2603–2605, 2024. 2, 3
2024
-
[32]
Harrison, F
L. Harrison, F. Yang, S. Franconeri, and R. Chang. Ranking Visualizations of Correlation Using Weber’s Law. IEEE Transactions on Visualization and Computer Graphics, 20(12):1943–1952, 2014. doi: 10.1109/tvcg.2014. 2346979 2
1943 doi
-
[33]
T. He, P. Isenberg, R. Dachselt, and T. Isenberg. Beauvis: A validated scale for measuring the aesthetic pleasure of visual representations. IEEE Transactions on Visualization and Computer Graphics, 2022. 7
2022
-
[34]
M. A. Hearst, P. Laskowski, and L. Silva. Evaluating information vi- sualization via the interplay of heuristic evaluation and question-based scoring. In Proceedings of the 2016 CHI Conference on Human Factors in Computing Systems, pp. 5028–5033, 2016. 3, 7
2016
-
[35]
Heider, A
P. Heider, A. Pierre-Pierre, R. Li, and C. Grimm. Local shape descriptors, a survey and evaluation. In Proceedings of the 4th Eurographics Conference on 3D Object Retrieval , 3DOR ’11, 8 pages, p. 49–56. Eurographics Association, Goslar, DEU, 2011. 2
2011
-
[36]
Holder and C
E. Holder and C. Xiong. Dispersion vs disparity: Hiding variability can encourage stereotyping when visualizing social outcomes. IEEE Transactions on Visualization and Computer Graphics, 29(1):624–634,
-
[37]
J. Hong, C. Seto, A. Fan, and R. Maciejewski. Do llms have visualization literacy? an evaluation on modified visualizations to test generalization in data interpretation. IEEE Transactions on Visualization and Computer Graphics, 2025. 2
2025
-
[38]
J. J. Horton. Large language models as simulated economic agents: What can we learn from homo silicus? Technical report, National Bureau of Economic Research, 2023. 2, 3
2023
-
[39]
M. Kay, T. Kola, J. R. Hullman, and S. A. Munson. When (ish) is my bus? user-centered visualizations of uncertainty in everyday, mobile predictive systems. In Proceedings of the 2016 CHI Conference on Human Factors in Computing Systems, CHI ’16, 12 pages, p. 5092–5103. Associa...
2016 doi
-
[40]
K. Lin, C. Stokes, and C. X. Bearfield. Llms are not reliable human proxies to study affordances in data visualizations. In CHI 2025 Workshop on Human-centered Evaluation and Auditing of Language Models, 8 pages. Association for Computing Machinery, 2025. 8
2025
-
[41]
N. F. Liu, K. Lin, J. Hewitt, A. Paranjape, M. Bevilacqua, F. Petroni, and P. Liang. Lost in the middle: How language models use long contexts. Transactions of the Association for Computational Linguistics, 12:157– 173, 2024. 9
2024
-
[42]
S. Liu, W. Cui, Y . Wu, and M. Liu. A survey on information visualization: recent advances and challenges. The Visual Computer, 30:1373–1393,
-
[43]
Z. Liu, C. Chen, J. Wang, X. Che, Y . Huang, J. Hu, and Q. Wang. Fill in the blank: Context-aware automated text input generation for mobile gui testing. In Proceedings of the 45th International Conference on Software Engineering, ICSE ’23, 13 pages, p. 1355–1367. IEEE Press, ...
2023
-
[44]
Malpica, D
S. Malpica, D. Martin, A. Serrano, D. Gutierrez, and B. Masia. Task- dependent visual behavior in immersive environments: A comparative study of free exploration, memory and visual search. IEEE Transactions on Visualization and Computer Graphics, 29(11):4417–4425, 2023. doi: 1...
2023
-
[45]
L. E. Matzen, B. C. Howell, M. C. S. Trumbo, and K. M. Divis. Numerical and visual representations of uncertainty lead to different patterns of decision making. IEEE Computer Graphics and Applications, 43(5):72– 82, 2023. doi: 10.1109/MCG.2023.3299875 2
2023
-
[46]
T. Munzner. Visualization analysis and design. CRC press, 2014. 2
2014
-
[47]
D. Navon. Forest before trees: The precedence of global features in visual perception. Cognitive psychology, 9(3):353–383, 1977. 3
1977
-
[48]
L. M. Padilla, S. H. Creem-Regehr, M. Hegarty, and J. K. Stefanucci. Deci- sion making with visualizations: a cognitive framework across disciplines. Cognitive research: principles and implications, 3(1):29, 2018. 2
2018
-
[49]
L. M. Padilla, S. H. Creem-Regehr, and W. Thompson. The powerful influence of marks: Visual and knowledge-driven processing in hurricane track displays. Journal of experimental psychology: applied , 26(1):1,
-
[50]
Palan and C
S. Palan and C. Schitter. Prolific. ac—a subject pool for online experiments. Journal of Behavioral and Experimental Finance, 17:22–27, 2018. 3, 4, 5
2018
-
[51]
Pandey, O
S. Pandey, O. G. McKinley, R. J. Crouser, and A. Ottley. Do you trust what you see? toward a multidimensional measure of trust in visualization. In 2023 IEEE Visualization and Visual Analytics (VIS), pp. 26–30. IEEE,
2023
-
[52]
Plaisant, J.-D
C. Plaisant, J.-D. Fekete, and G. Grinstein. Promoting insight-based evaluation of visualizations: From contest to benchmark repository. IEEE Transactions on Visualization and Computer Graphics, 14(1):120–134,
-
[53]
Qin and J
G. Qin and J. Eisner. Learning how to ask: Querying LMs with mixtures of soft prompts. In Proceedings of the 2021 Conference of the North Amer- ican Chapter of the Association for Computational Linguistics: Human Language Technologies, pp. 5203–5212. Association for Computatio...
2021 doi
-
[54]
R. A. Rensink and G. Baldridge. The perception of correlation in scatter- plots. In Computer graphics forum, vol. 29, pp. 1203–1210. Wiley Online Library, 2010. 2
2010
-
[55]
Revelle and M
W. Revelle and M. W. Revelle. Package ‘psych’. The comprehensive R archive network, 337:338, 2015. 3
2015
-
[56]
Saraiya, C
P. Saraiya, C. North, and K. Duca. An insight-based methodology for eval- uating bioinformatics visualizations. IEEE Transactions on Visualization and Computer Graphics, 11(4):443–456, 2005. doi: 10.1109/TVCG.2005.53 2
2005 doi
-
[57]
M. M. Schapira, A. B. Nattinger, and C. A. McHorney. Frequency or probability? a qualitative study of risk communication formats used in health care. Medical Decision Making, 21(6):459–467, 2001. 2
2001
-
[58]
K. B. Schloss. Color semantics in human cognition. Current Directions in Psychological Science, 33(1):58–67, 2024. 2
2024
-
[59]
Schulz, T
H.-J. Schulz, T. Nocke, M. Heitzler, and H. Schumann. A design space of visualization tasks. IEEE Transactions on Visualization and Computer Graphics, 19(12):2366–2375, 2013. 3
2013
-
[60]
Setlur and M
V . Setlur and M. C. Stone. A linguistic approach to categorical color assignment for data visualization. IEEE Transactions on Visualization and Computer Graphics, 22(1):698–707, 2015. 2
2015
-
[61]
Shneiderman
B. Shneiderman. The eyes have it: A task by data type taxonomy for information visualizations. In The Craft of Information Visualization, pp. 364–371. Elsevier, 2003. 3
2003
-
[62]
Słomska-Przech and I
K. Słomska-Przech and I. M. Goł˛ ebiowska. Do different map types support map reading equally? comparing choropleth, graduated symbols, and isoline maps for map use tasks. ISPRS International Journal of Geo-Information, 10(2):69, 2021. 7
2021
-
[63]
Snow and M
J. Snow and M. Mann. Qualtrics survey software: handbook for research professionals. Provo, UT: Qualtrics Labs, 209 pages, 2013. 3
2013
-
[64]
South, D
L. South, D. Saffo, O. Vitek, C. Dunne, and M. A. Borkin. Effective use of likert scales in visualization evaluations: A systematic review. In Computer Graphics Forum, vol. 41, pp. 43–55. Wiley Online Library,
-
[65]
B. G. Southwell, J. S. B. Brennen, R. Paquin, V . Boudewyns, and J. Zeng. Defining and measuring scientific misinformation. The ANNALS of the American Academy of Political and Social Science, 700(1):98–111, 2022. 2
2022
-
[66]
Stokes, C
C. Stokes, C. Sanker, B. Cogley, and V . Setlur. From Delays to Densities: Exploring Data Uncertainty through Speech, Text, and Visualization. In Computer Graphics Forum, vol. 43, p. e15100. Wiley Online Library,
-
[67]
Stokes, V
C. Stokes, V . Setlur, B. Cogley, A. Satyanarayan, and M. A. Hearst. Striking a balance: reader takeaways and preferences when integrating text and charts. IEEE Transactions on Visualization and Computer Graphics, 29(1):1233–1243, 2022. 4
2022
-
[68]
Strobelt, A
H. Strobelt, A. Webson, V . Sanh, B. Hoover, J. Beyer, H. Pfister, and A. M. Rush. Interactive and visual prompt engineering for ad-hoc task adaptation with large language models. IEEE Transactions on Visualization and Computer Graphics, 29(1):1146–1156, 2022. 9
2022
-
[69]
doi: 10.1111/cgf.15100 1, 7
-
[70]
Tory and T
M. Tory and T. Moller. Rethinking visualization: A high-level taxonomy. In IEEE Symposium on Information Visualization , pp. 151–158. IEEE, Austin, TX, USA, 2004. 3
2004
-
[71]
Treisman
A. Treisman. Perceptual grouping and attention in visual search for features and for objects. Journal of experimental psychology: human perception and performance, 8(2):194, 1982. 3
1982
-
[72]
D. A. Szafir, S. Haroz, M. Gleicher, and S. Franconeri. Four types of ensemble coding in data visualizations. Journal of Vision, 16(5):11–11,
-
[73]
J. W. Tukey et al. Exploratory data analysis, vol. 2. Springer, 1977. 2
1977
-
[74]
H. W. Wang, J. Hoffswell, S. M. T. Thane, V . S. Bursztyn, and C. X. Bearfield. How aligned are human chart takeaways and llm predictions? a case study on bar charts with varying layouts. IEEE VIS, 11 pages, 2024. to appear. 2, 3, 7
2024
-
[75]
Tseng, A
C. Tseng, A. Z. Wang, G. J. Quadri, and D. A. Szafir. Shape it up: An empirically grounded approach for designing shape palettes. IEEE VIS, 11 pages, 2024. to appear. 2
2024
-
[76]
Xiong, V
C. Xiong, V . Setlur, B. Bach, E. Koh, K. Lin, and S. Franconeri. Visual arrangements of bar charts influence comparisons in viewer takeaways. IEEE Transactions on Visualization and Computer Graphics, 28(1):955– 965, 2021. 2, 3
2021
-
[77]
Xu and E
Z. Xu and E. Wall. Exploring the capability of llms in performing low- level visual analytic tasks on svg data visualizations. IEEE VIS, 5 pages,
-
[78]
Wongsuphasawat, Z
K. Wongsuphasawat, Z. Qu, D. Moritz, R. Chang, F. Ouk, A. Anand, J. Mackinlay, B. Howe, and J. Heer. V oyager 2: Augmenting visual analysis with partial view specifications. In Proceedings of the 2017 chi conference on human factors in computing systems, pp. 2648–2659, 2017. 9
2017
-
[79]
Zacks and B
J. Zacks and B. Tversky. Bars and lines: A study of graphic communica- tion. Memory & Cognition, 27(6):1073–1079, 1999. 2, 3
1999
-
[80]
L. Zha, J. Zhou, L. Li, R. Wang, Q. Huang, S. Yang, J. Yuan, C. Su, X. Li, A. Su, et al. Tablegpt: Towards unifying tables, nature language and commands into one gpt. arXiv preprint arXiv:2307.08674, 13 pages, 2023. 2, 3
2023 arXiv
-
[81]
F. Yang, M. Cai, C. Mortenson, H. Fakhari, A. D. Lokmanoglu, J. Hullman, S. Franconeri, N. Diakopoulos, E. C. Nisbet, and M. Kay. Swaying the public? impacts of election forecast visualizations on emotion, trust, and intention in the 2022 u.s. midterms. IEEE Transactions on Vi...
2022 doi
-
[82]
Zohrevandi, C
E. Zohrevandi, C. A. Westin, J. Lundberg, and A. Ynnerman. Design and evaluation study of visual analytics decision support tools in air traffic control. In Computer Graphics Forum, vol. 41, pp. 230–242. Wiley Online Library, 2022. 2
2022
-
[84]
Y . Zhao, Y . Zhang, Y . Zhang, X. Zhao, J. Wang, Z. Shao, C. Turkay, and S. Chen. Leva: Using large language models to enhance visual analytics. IEEE Transactions on Visualization and Computer Graphics, pp. 1–17,
-
[85]
doi: 10.1109/TVCG.2024.3368060 2
2024
-
[2008]
doi: 10.1109/TVCG.2007.70412 2
2007
-
[2024]
doi: 10.1109/TVCG.2024.3456309 3
2024
Reviewed August 6, 2026 · model on record in the stance chip above.
Discussion (0). Sign in to comment.