REVIEW 3 major objections 4 minor 13 references
EFS: Evolutionary Factor Searching for Sparse Portfolio Optimization Using Large Language Models
T0 review · 3 major / 4 minor · reviewed 2026-08-06 · deepseek-v4-flash
Pith's one-line read Large language models can evolve alpha factors, and EFS shows this beats sparse portfolio baselines across eight datasets.
desk verdict The method is plausible but the headline result is in-sample: the aggregated backtest pools factors evolved on the same period it scores, so Tables 1 and 2 do not establish out-of-sample outperformance. read the letter →
The pith
A machine-rendered reading of the paper's core claim, the machinery that carries it, and where it could break.
The reading
What carries the argument
The central object is the evolving factor pool: a set of executable Python scoring functions, seeded with basic return, volatility, momentum, and technical-indicator formulas, that the LLM edits at computation-graph level through mutation and crossover. Performance feedback—factor-level RankIC and RankICIR plus portfolio-level Sharpe and drawdown—is fed back into prompts, making the LLM an evolutionary variation operator rather than a one-shot generator. The key identity doing the work is the composite score $s_i = k^{-1}\sum_{j=1}^k f^i_j$; because candidates are validated and pruned against adaptive benchmarks, the pool stays small, diverse, and directly used for ranking.
What would settle it
Run EFS with an explicit cutoff: evolve and prune factors only on data up to date $D$, freeze the final pool, then backtest strictly on days after $D$ without any pooling or re-evaluation of the evolved factors. If cumulative wealth and Sharpe ratio against ASMCVaR and mSSRM-PGA collapse to baseline levels, the central claim is falsified.
Extended reading notes
Core claim
EFS reformulates sparse portfolio optimization—choosing at most $m$ of $n$ assets under an $\ell^0$ constraint—as a top-$m$ ranking problem driven by LLM-generated factors. Each factor maps an asset's recent price and return history to a score; the factors' scores are averaged, the top-$m$ assets are selected, and weights are either equal or score-proportional. The discovery is that an evolutionary loop can improve these factors: prompts containing the current best factors and anonymized performance metrics (RankIC, Sharpe ratio) ask the LLM to produce mutated and crossed-over versions, candidates are backtested, pruned against benchmark criteria, and the pool is updated. The paper reports that this process yields the best cumulative wealth, Sharpe ratio, and drawdown among all methods compared, especially at $m=10$ on FF100, US50, and CSI300, with the gap widening exactly where sparse portfolios are hardest.
Load-bearing premise
The reported outperformance assumes the backtest used to evolve factors is a valid out-of-sample test of those same factors; if the pooled re-evaluation merely re-scores factors on data that already guided their selection, the gains could be an artifact.
Editorial extensions
If this is right
- If EFS works as reported, a 10-15 asset portfolio can outperform full-universe and optimization-based portfolios by averaging a handful of LLM-mutated scoring formulas.
- Portfolio construction becomes interpretable: the final factors are human-readable formulas, so one can see whether the system chose momentum, volatility-filtered breakouts, or mean reversion in a given regime.
- The framework inherits LLM choice: switching the backend from GPT-4.1 to DeepSeek-V3 changes magnitudes but preserves the edge, suggesting the loop, not a specific model, carries the result.
- Transaction-cost experiments in the paper show the edge survives 0.1-0.2% per-rebalance costs on US50 and CSI300, though less so on HSI45.
Reading between the lines
- Our read: the reported three-run pooled evaluation may still contain in-sample selection, because factors are pooled and then re-scored on the same backtest window; the honest test is to freeze the evolved pool at a cutoff and score only later data.
- One testable extension: replace the LLM with random subtree mutation to see how much of the edge is LLM prior knowledge versus the evolutionary loop alone.
- Connecting to neighboring problems: the same ranking-and-prune loop could attack cardinality-constrained index tracking or sparse mean-CVaR selection by swapping the backtest metric in the prompt.
Editorial analysis
A structured set of objections, weighed in public.
Referee Report
Summary. The paper proposes EFS, an LLM-guided evolutionary framework for sparse portfolio optimization. EFS uses prompts to make an LLM generate, mutate, and cross over alpha-factor expressions; the factors are scored by RankIC and portfolio-level metrics, the pool is pruned and updated over time, and the top-m assets are selected by the aggregated factor scores. Experiments are reported on five Fama-French datasets and three real-market universes (US50, HSI45, CSI300), with claims of state-of-the-art cumulative wealth, Sharpe ratio, and drawdown, plus ablation studies on prompt components, factor counts, and LLM backends.
Significance. The framework is timely and well motivated: combining LLM-based factor generation with an evolutionary loop and sparse top-m portfolio construction is a reasonable and potentially useful research direction. The paper also includes useful qualitative analysis of generated factors and a transaction-cost robustness check. However, the central empirical claim of significant out-of-sample outperformance is not established by the current evaluation protocol. The aggregated evaluation described in Section 5.1 appears to select and prune factors using backtest performance on the same data over which final performance is reported, and Appendix E.1 introduces an asymmetric warm-up that favors EFS relative to the baselines. If these issues are corrected with a genuinely out-of-sample walk-forward protocol, the paper could be a meaningful contribution; as written, the headline results in Tables 1 and 2 are not interpretable as out-of-sample performance.
major comments (3)
- [5.1] The aggregated evaluation protocol undermines the paper's central claim. Section 5.1 states that "all discovered factors across the three runs are pooled together into a unified factor library, and then re-evaluated in a single backtest." Because factor generation, filtering, and pruning are driven by RankIC and Sharpe performance on the backtest window (Algorithm 1, steps 12-34), pooling and re-evaluating the resulting factors on that same window means the final metrics in Tables 1 and 2 reflect in-sample factor selection. A factor discovered late in one run can be scored on early data it never saw during evolution, and the decision to keep or prune a factor is made using information from the evaluation period. The "Data Safety Guarantee" in Appendix E.1 only anonymizes tickers and dates; it does not prevent the final pool from being selected on full-sample backtests. The paper must either (i) split the data into a search/selection period and a disjoint evaluation period, or (ii) run a strict walk-forward procedure in which each rebalance uses only factors selected from data available at that time, and report the resulting out-of-sample metrics. Without this, the headline outperformance is not established.
- [E.1] The evaluation of EFS versus the baselines is asymmetric. Appendix E.1 states that "for all experiments conducted using EFS, we compute the daily portfolio return using a 1/N baseline strategy during the warm-up phase—i.e., from the start point until the first evolution step begins," while optimization-based baselines "are evaluated from the very first step." This gives EFS a risk-free 1/N warm-up period during which its portfolio is not subject to factor-based selection, while the baselines' performance includes the same early period. On the relatively short HSI45 and CSI300 horizons, this difference can materially affect cumulative wealth, Sharpe ratio, and drawdown comparisons. The warm-up period should be identical for all methods, or the reported metrics should clearly exclude it for every method.
- [5.2] The paper repeatedly claims that EFS "significantly outperforms" or "substantially outperforms" baselines (e.g., Section 5.2), but Tables 1 and 2 report only point estimates without confidence intervals, standard deviations, or any significance test. Given the acknowledged stochasticity of LLM outputs and the fact that the paper runs only three search repetitions, Table 3 shows large standard deviations (for example, US50 CW is 32.993±6.044 and HSI45 CW is 3.193±0.923), so the point estimates in Tables 1 and 2 may not be stable. The main tables should include per-run dispersion or a statistical comparison, at least for the EFS variants, before the outperformance claim can be evaluated.
minor comments (4)
- [1] There are several typos throughout the manuscript, including "impoartant" (Section 1), "rigirous" (Section 1), "sparese" (Section 4), "time-erioes" (Section 3.2), and "transparancy" (Section 4). A careful proofreading pass is needed.
- [5.2] The figure references are inconsistent: for example, the text refers to Figure 10 before Figure 8, and Figure 12 before Figure 11. The figures should be renumbered or the in-text citations adjusted.
- [5.1] The description of the real-market datasets says CSI300 data spans "the same period as HSI45," but it is not clear whether the exact dates are identical or whether the two datasets cover different lengths of history. The dataset construction should state explicit date ranges for each universe.
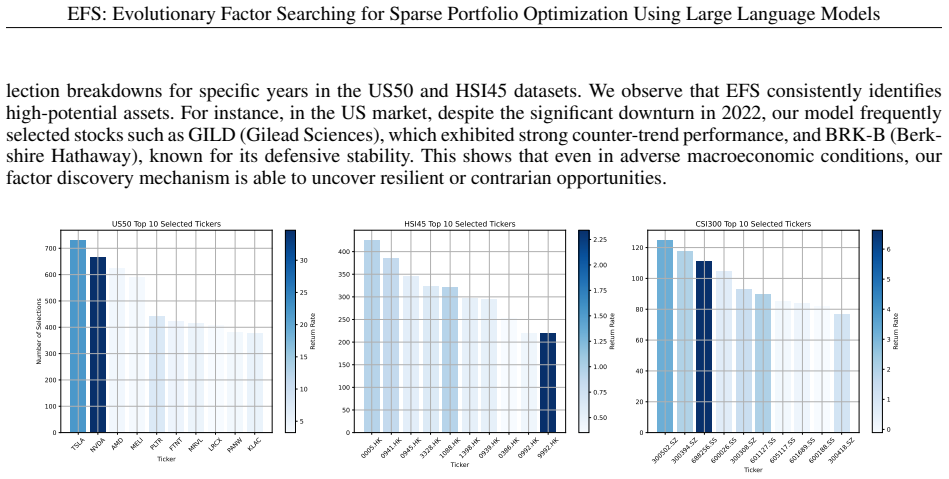
- [5.4] The statement that "EFS tends to allocate toward growth-leading stocks in bull markets and shifts to more stable assets during downturns" is only supported by qualitative inspection of a few tickers; a quantitative measure of regime-dependent tilts would strengthen the claim.
Circularity Check
Reported outperformance is the objective of the search: factors are evolved by backtest RankIC/Sharpe and then scored on a pooled re-backtest of the same period (Sec. 5.1), so Tables 1-2 are an in-sample selection result.
-
fitted input called prediction
[Section 5.1 (Implement and Parameters Details) with Section 4.2 (Iterative Evolution and Portfolio Optimization)]
"Specifically, for each market dataset, to mitigate noise from individual LLM outputs and transient market conditions, we repeat the factor search process three times and report performance under aggregated evaluation, where all discovered factors across the three runs are pooled together into a unified factor library, and then re-evaluated in a single backtest. [...] EFS evaluates the current pool of factors using recent portfolio (e.g. Sharpe Ratio) and factor-specific metrics (e.g. RankIC). Top-performing factors are selected..."
The factor pool is evolved and pruned by backtest performance: factors that fail to meet adaptive benchmark criteria are pruned, and top-performing factors by RankIC/Sharpe drive the prompts and are retained. The reported CW/SR/MDD in Tables 1-2 come from re-evaluating the pooled three-run factor library in a single backtest over the same period that supplied the search feedback. Thus a factor can be kept precisely because it scored well on the backtest that is then used to compute the headline metrics; the 'prediction' of strong portfolio performance is the selection objective, not an independent out-of-sample result.
full rationale
The central circular step is the evaluation protocol, not the LLM factor-generation mechanism. Section 4.2 states that EFS selects and prunes factors using recent portfolio and factor-specific metrics such as Sharpe Ratio and RankIC, and Section 5.1 states that the final reported results come from pooling all discovered factors across three runs and re-evaluating them 'in a single backtest.' If that single backtest spans the same period used for search feedback, the final table entries are the value of the objective being optimized, so the claimed state-of-the-art outperformance is not an independent prediction. This fits the fitted-input-called-prediction pattern: the factor pool is fit to backtest performance, and the same backtest is reported as the evaluation. A separate fairness issue, noted in Appendix E.1, is that EFS uses a 1/N warm-up while optimization baselines are evaluated from the first step; this is not circularity but makes the comparisons unequal. I found no load-bearing self-citation or imported uniqueness theorem; the paper's citations to prior work are not used to force its conclusions. The LLM-generated factor expressions and evolutionary loop are non-trivial and could be validated with a genuinely out-of-sample protocol, but the headline numbers as reported do not establish that validation, giving a partial circularity score of 6.
Assumptions & free parameters
free parameters (1)
- LLM candidate factor count M per search step =
5 (default setting; M=5 showed best average performance in ablation)
assumptions (3)
- domain assumption Historical price and return data are sufficient to construct alpha factors that predict future relative performance.
- ad hoc to paper The rolling backtest with aggregated factor pooling is a valid estimate of out-of-sample performance.
- domain assumption LLM-generated Python factor functions are executed correctly and their outputs are reliable signals.
Cite this review
Pith. "Pith review of EFS: Evolutionary Factor Searching for Sparse Portfolio Optimization Using Large Language Models." pith.science (2026). https://pith.science/paper/MFIZAMAX
@misc{pith2026250717211,
  author       = {Pith},
  title        = {Pith review of: EFS: Evolutionary Factor Searching for Sparse Portfolio Optimization Using Large Language Models},
  year         = {2026},
  howpublished = {\url{https://pith.science/paper/MFIZAMAX}},
  note         = {Machine review of arXiv:2507.17211}
}
read the original abstract
Sparse portfolio optimization is a fundamental yet challenging problem in quantitative finance, since traditional approaches heavily relying on historical return statistics and static objectives can hardly adapt to dynamic market regimes. To address this issue, we propose Evolutionary Factor Search (EFS), a novel framework that leverages large language models (LLMs) to automate the generation and evolution of alpha factors for sparse portfolio construction. By reformulating the asset selection problem as a top-m ranking task guided by LLM-generated factors, EFS incorporates an evolutionary feedback loop to iteratively refine the factor pool based on performance. Extensive experiments on five Fama-French benchmark datasets and three real-market datasets (US50, HSI45 and CSI300) demonstrate that EFS significantly outperforms both statistical-based and optimization-based baselines, especially in larger asset universes and volatile conditions. Comprehensive ablation studies validate the importance of prompt composition, factor diversity, and LLM backend choice. Our results highlight the promise of language-guided evolution as a robust and interpretable paradigm for portfolio optimization under structural constraints.
Figures


Figures from the paper (10 more)





Reference graph
Works this paper leans on
-
[1]
Output ONLY a Python list of function strings - no comments or explanations
-
[2]
Each function MUST: - Be bug-free and executable - Maintain identical input signature: prices, window - Use only numpy (as np), don’t depend on any external function or variable, you need to do computation all inside function - Handle edge cases (short series, NaNs) - Clearly indicate if combining or modifying existing factors
-
[3]
Absolute prohibitions: - No external functions - No hardcoded values that should be parameters - No pandas or other libraries - No comments in output code
-
[4]
Factor name rules: [factor name part] [window size] v[version number], the window size can only be the following value: 3, 7, 14, 21
-
[5]
Value of output factor: For factors, higher value means better asset, please make sure the output value is positive related to performance of assets. ACTION SPACE:
-
[8]
Improve existing factors by mutation: - Modifying parameters (e.g., inner parameters) - Adjusting logic - Updating inside operators for factors
-
[9]
Improve existing factors by crossover: - Combining two existing factors to create a new one if you think they can work together - Restart version number from v1 for new factors IMPROVEMENT CRITERIA:
-
[10]
Version increments must show clear: - if you improve from a given version, increase 1 to version number, the version number can only be integer like v1, v2, v3, don’t include any other character. - Performance enhancement - Robustness improvement - Computational efficiency - if you create a new factor by crossover from other two, restart version number fr...
Show all 13 references
-
[11]
def test run avg(*args, **kwargs):\n a=np.array(prices) \n if a: \n print(a) \n return np.mean(kwargs[’prices’]) \n
Combined factors should demonstrate: - Logical interaction - Complementary strengths 18 EFS: Evolutionary Factor Searching for Sparse Portfolio Optimization Using Large Language Models - Better risk-adjusted returns - Don’t make combined factors too complex, try to keep it sim...
-
[12]
Tanh norm converts deviations to [0,1) range: Values near 0 → Price hovering near EMA (no momentum) Values approaching 1 → Strong directional breakout
Significant Short-Term Price Deviation (Momentum Component). Tanh norm converts deviations to [0,1) range: Values near 0 → Price hovering near EMA (no momentum) Values approaching 1 → Strong directional breakout
-
[13]
Low Overall Volatility (Stability Component) Calculates standard Bollinger Band width Inverts volatility to create stability score: 1 = Extremely narrow bands (high stability) 0 = Extremely wide bands (high volatility) The combined signal suggests: ✔ High-Probability Breakouts...
2023
-
[2024]
URL https://aclanthology.org/2024.finnlp-2.4/
-. URL https://aclanthology.org/2024.finnlp-2.4/. Stephen F Witt and Richard Dobbins. The markowitz contribution to portfolio theory.Managerial finance, 5(1):3–17, 1979. Xiao Yang, Weiqing Liu, Dong Zhou, Jiang Bian, and Tie-Yan Liu. Qlib: An ai-oriented quantitative investmen...
2024 arXiv
-
[2025]
To reduce potential bias caused by the overall underperformance of the Hong Kong market before mid-2024, we randomly select and add 15 large-cap blue-chip stocks from the HSI index
However, since some companies were listed relatively late and lack sufficient historical data, we replace them with similar firms from the same industry within the broader HSI index. To reduce potential bias caused by the overall underperformance of the Hong Kong market before...
2024
Reviewed August 6, 2026 · model on record in the stance chip above.
Discussion (0). Sign in to comment.