REVIEW 3 major objections 5 minor 61 references
gsaot: an R package for Optimal Transport-based sensitivity analysis
T0 review · 3 major / 5 minor · reviewed 2026-08-15 · deepseek-v4-flash
Pith's one-line read Optimal transport ranks model inputs straight from data
desk verdict A genuinely useful R package for OT-based sensitivity analysis, blighted by a few fixable reproducibility mistakes and an unacknowledged binning bias. read the letter →
The pith
A machine-rendered reading of the paper's core claim, the machinery that carries it, and where it could break.
The reading
What carries the argument
The load-bearing object is the OT-based sensitivity index $\iota_K(Y,X_i) = E[K(P_Y, P_{Y|X_i})] / M_K[Y]$, where $K$ is the optimal transport cost under a user-chosen ground metric and $M_K[Y] = E[c(Y, Y')]$ is the expected cost between independent output replicas. The estimator replaces the conditioning event $X_i = x_i$ with membership in one of $H$ bins covering the input support, then averages the empirical OT costs over bins. This single plug-in device connects three computational routes: a closed-form quantile solution in one dimension, the Wasserstein-Bures closed form for elliptical distributions, and general empirical OT solved by network-flow or Sinkhorn algorithms.
What would settle it
Take a model with known true OT indices (for example, a Gaussian model as in the paper) and add a small-amplitude, high-frequency oscillation to the conditional output as a function of $X_i$, so that within every chosen bin the conditional distribution varies appreciably. Then compute the package's estimate at increasing $N$ with $H$ fixed; if the estimate stays biased away from the truth as $N$ grows while an exact-conditioning Monte Carlo estimate converges, the binning approximation—and with it the package's reliability—is refuted.
Extended reading notes
Core claim
The paper's central claim is that the Wasserstein distance between the marginal output distribution and the output distribution conditional on an input defines a global sensitivity index that can be estimated from data alone, and that this index preserves the strong axiomatic properties of genuine measures of statistical association. Specifically, fixing input $X_i$ at $x_i$, the local separation $\zeta_K(x_i) = K(P_Y, P_{Y|X_i=x_i})$ is averaged over $X_i$ and divided by the maximum attainable cost $M_K[Y]$, yielding $\iota_K(Y,X_i)$ in $[0,1]$. The index is zero exactly when $Y$ and $X_i$ are independent and one exactly when $Y$ is a deterministic function of $X_i$. The paper implements this for one-dimensional outputs through a quantile formula, for elliptical or Gaussian outputs through the closed-form Wasserstein-Bures metric, and for general multivariate outputs through numerical optimal transport solvers, including entropic Sinkhorn regularization as a fast approximation.
Load-bearing premise
The whole method rests on replacing "fix $X_i$ at a precise value" with "$X_i$ falls in one of a few broad bins" and averaging the results over those bins; if this replacement is biased at finite sample sizes, the computed indices and rankings are unreliable.
Editorial extensions
If this is right
- Analysts can rank input importance for any black-box model from a stored dataset, removing the need for purpose-built sampling designs or model reruns.
- Multivariate and time-series outputs are treated as whole distributions, so an input that changes the shape or covariance of the output is detected even when marginal means do not move.
- Correlated inputs do not invalidate the index; the ranking and its zero and one extremes remain well defined.
- The index decomposes into advective (mean-shift), diffusive (covariance-shift), and higher-order components, allowing analysts to say not only how much but in what way an input affects the output.
- Entropic regularization provides a fast, lower-bounded approximation that converges to the classical index as the regularization parameter goes to zero, making large-$N$ analyses feasible.
Reading between the lines
- If the binning estimator is unbiased in practice, gsaot could be used as a screening tool on archival datasets in fields where experimenter-controlled sampling is impossible, such as epidemiology or observational climate analysis.
- The mean/covariance decomposition suggests a diagnostic not developed in the paper: comparing advective with diffusive components across inputs can reveal which inputs drive heteroscedasticity, something variance-based indices miss.
- Because the population index satisfies max-functionality, the package could double as an independence test for multivariate dependence, but the paper does not provide distributional results or calibration for such testing.
- The dummy-variable irrelevance threshold is heuristic; a formal false-discovery or calibration analysis would strengthen its use for variable screening, but the paper does not propose one.
Signed reviews
Editorial analysis
A structured set of objections, weighed in public.
Referee Report
Summary. The manuscript presents gsaot, an R package for global sensitivity analysis based on Optimal Transport (OT) distances. It defines OT-based sensitivity indices from Borgonovo et al. (2024), including the Wasserstein-Bures decomposition into advective, diffusive, and higher-moment components, and implements given-data estimators that partition each input into H bins and average OT costs between the marginal output distribution and conditional output distributions. The package supports one-dimensional outputs, Gaussian/Bures closed-form estimation, classical OT via the transport package, and entropic OT via custom C++ Sinkhorn solvers, together with bootstrap confidence intervals, plotting, and an irrelevance-threshold tool based on dummy inputs. Three applications are shown: a linear Gaussian model with known analytical values, a spruce budworm ODE model with time-dependent output, and a DICE-based climate model with a custom ground cost.
Significance. If the estimates are reliable, the package is a useful contribution: it is model-agnostic, works directly from a dataset, supports correlated inputs and multivariate outputs, and implements indices with zero-independence and max-functionality. The paper also ships reproducible R code, makes the package available on CRAN, and checks one analytical benchmark. The main weakness is that the reliability of the central given-data estimator is not established beyond heuristics, and the benchmark contains a matrix inconsistency, so the validation currently does not close that gap.
major comments (3)
- [Section 3.1] The given-data estimator in Eq. (16) is the backbone of the package, yet the paper provides no bias, variance, or consistency analysis for it. For fixed H, by convexity of the Kantorovich cost in the second marginal, K(P_Y, P_{Y|X_i∈X^h_i}) ≤ (1/P(X^h_i)) ∫_{X^h_i} K(P_Y, P_{Y|X_i=x_i}) dP(x_i), so the binning estimator is downward biased and converges as N→∞ to a bin-average, not to ξ_K(Y,X_i). Because different inputs generally have different within-bin heterogeneity, rankings can change even in large samples. The heuristics in the text (at least 100 points per bin, the Strong-Oakley plateau, the dummy threshold) do not quantify this error. The Gaussian example in Section 3.1 cannot settle the question because the benchmark itself is compromised (see next comment). I ask the authors to add either a consistency result with H=H(N)→∞, or a systematic numerical study showing that the bias is negligible and rankings are stable for representative nonlinear and non-Gaussian models.
- [Section 3.1] The validation against Table 2 is not a clean check because the matrix used in the R code differs from the matrix stated in the text. The text defines A = [[4,2,3],[2,5,-1]], but the code 'A <- matrix(data = c(4,-2,1,2,5,-1), nrow = 2, byrow = TRUE)' produces A = [[4,-2,1],[2,5,-1]]. As a result, the column for X3 (and the correlated-input structure) differs between the claimed analytical model and the simulated data. Please reconcile the two definitions and report which matrix was actually used to generate the results; the comparison between ot_indices_wb, networkflow, and Sinkhorn remains informative only after this correction.
- [Equation (10)] Equation (10) is missing the normalization by M_K[Y] in the remainder term. Since the first two terms are defined in Eqs. (11)–(12) as normalized indices, the decomposition should read ι_K = ι_V + ι_Σ + M_K[Y]^{-1} E[Γ(P_Y,P_{Y|X_i})]; as written, the right-hand side mixes normalized and unnormalized quantities. This is a local fix, but the equation is part of the theoretical basis of the package's decomposition property and should be corrected.
minor comments (5)
- [Eq. (17)] The one-dimensional formula in Eq. (17) is written as a sum over j=1,...,N of the p-th differences of empirical quantile functions at j/N, but the conditional sample has N_h < N points; please state how the conditional quantile function is evaluated at the finer grid and confirm that the expression equals the L_p^p Wasserstein cost between the two empirical measures.
- [Section 2.4 / code examples] The number of partitions is denoted H in Eq. (16) and in the statement 'partitioned into H subsets,' but the code and the later discussion use M throughout; please unify the notation.
- [Section 3.3] The text says the example uses 'the fourth power of Minkowski distance of order 4 (L3^3)', while the code custom_metric uses dist(..., method='minkowski', p=3)^3; please correct the verbal description to match the implemented L_3^3 cost.
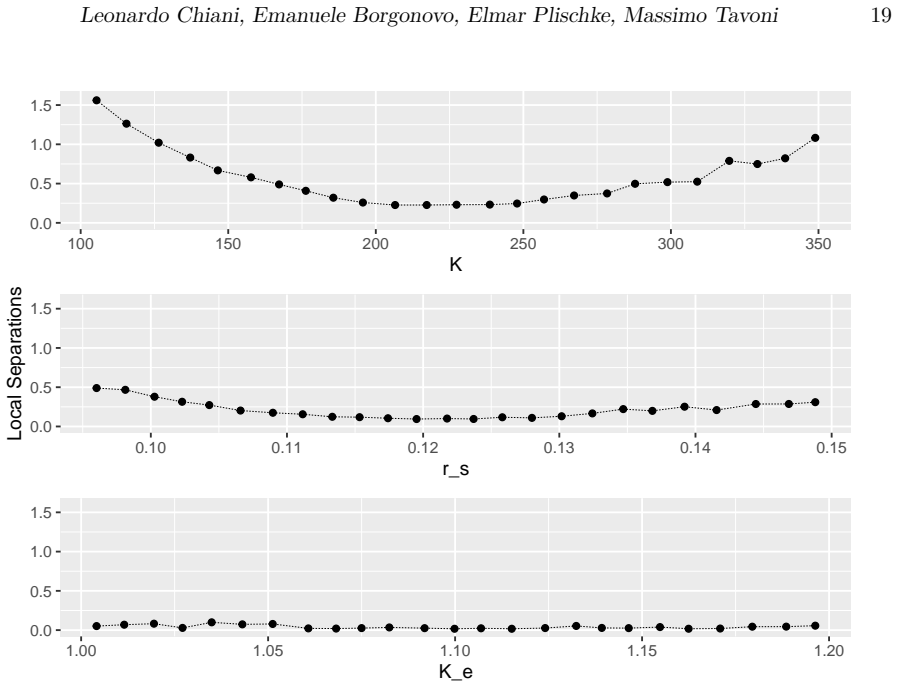
- [Section 3.2, Figure 4] The third panel in Figure 4 is labeled K_e, and the text says the plot shows the three most important inputs; the subsequent sentence about local separations for T_e should refer to a variable that is actually plotted, or the figure/ranking should be changed.
- [Throughout] There are several spelling and style slips, e.g., 'inizialize' should be 'initialize', and the sentence in Section 3.3 beginning 'We inizialize' should be reworded; a careful proofread is recommended.
Circularity Check
No significant circularity: the package implements independently published OT-based indices and validates them against external analytical benchmarks; self-citations are not load-bearing.
full rationale
The derivation chain is self-contained rather than circular. The index iota_K is defined through the OT cost K(P_Y, P_Y|Xi=xi), with upper bound M_K[Y] = E[c(Y,Y')] and normalization iota_K = xi_K / M_K[Y]. The estimator in Eq. (16) replaces the conditioning event with a partition cell and averages empirical OT costs; this is an explicit approximation, not a restatement of the index. No parameter is fitted to force agreement: the number of partitions H is user-chosen with heuristic guidance, and the denominator is a U-statistic. The Gaussian validation in Section 3.1 is an external ground truth, albeit weakened by the code's matrix A (c(4,-2,1,2,5,-1)) differing from the text's A ([[4,2,3],[2,5,-1]]); that is a reproducibility/correctness issue, not circularity. The paper relies on the authors' prior work for the indices' zero-independence and max-functionality properties, but those properties are published results in peer-reviewed venues and are not themselves the target of this paper's derivation; they are also corroborated by independent work on Wasserstein-based dependence measures. No uniqueness theorem is imported to forbid alternatives, and no ansatz is smuggled in via self-citation. The binning estimator's possible downward bias under convex OT costs is a statistical accuracy concern, not evidence that the prediction reduces to its inputs by construction. Section 4 promises a discussion of limitations but does not actually list limitations; this is a completeness issue, not a circular step.
Assumptions & free parameters
free parameters (3)
- Number of partitions H (M) =
M = 20 (Gaussian), M = 25 (budworm), M = 15 (DICE)
- Sinkhorn regularization epsilon =
0.001 (DICE), 0.05 and 0.001 (Gaussian comparison)
- Sinkhorn solver tolerance and iteration limits =
numIterations = 1e+06 or 1e+05, maxErr = 0.001
assumptions (5)
- standard math Kantorovich formulation of OT and Wasserstein metric properties
- standard math Gelbrich's closed-form L2 Wasserstein formula for elliptical distributions with equal generators
- standard math Entropic OT converges to classical OT as epsilon tends to zero
- domain assumption Partition-based plug-in approximation of conditional OT cost is a valid estimator
- domain assumption Properties of the indices (zero-independence, normalization, max-functionality)
Cite this review
Pith. "Pith review of gsaot: an R package for Optimal Transport-based sensitivity analysis." pith.science (2026). https://pith.science/paper/MAM6QGPX
@misc{pith2026250718588,
  author       = {Pith},
  title        = {Pith review of: gsaot: an R package for Optimal Transport-based sensitivity analysis},
  year         = {2026},
  howpublished = {\url{https://pith.science/paper/MAM6QGPX}},
  note         = {Machine review of arXiv:2507.18588}
}
read the original abstract
gsaot is an R package for Optimal Transport-based global sensitivity analysis. It provides a simple interface for indices estimation using a variety of state-of-the-art Optimal Transport solvers such as the network simplex and Sinkhorn-Knopp. The package is model-agnostic, allowing analysts to perform the sensitivity analysis as a post-processing step. Moreover, gsaot provides functions for indices and statistics visualization. In this work, we provide an overview of the theoretical grounds, of the implemented algorithms, and show how to use the package in different examples.
Figures


Figures from the paper (4 more)


Reference graph
Works this paper leans on
-
[1]
Adams BM, Bohnhoff WJ, Dalbey KR, Ebeida MS, Eddy JP, Eldred MS, Hooper RW, Hough PD, Hu KT, Jakeman JD, et al. (2020). Dakota , a multilevel parallel object-oriented framework for design optimization, parameter estimation, uncertainty quantification, and sensitivity analysis: version 6.13 user's manual. Technical report, Sandia National Lab.(SNL-NM), Alb...
work page 2020
-
[2]
Anderson B, Borgonovo E, Galeotti M, Roson R (2014). Uncertainty in Climate Change Modeling : Can Global Sensitivity Analysis Be of Help ? Risk Analysis, 34(2), 271--293. ISSN 1539-6924. doi:10.1111/risa.12117
-
[3]
Fast and Elegant Numerical Linear Algebra Using the RcppEigen Package
Bates D, Eddelbuettel D (2013). Fast and Elegant Numerical Linear Algebra Using the RcppEigen Package . Journal of Statistical Software, 52, 1--24. ISSN 1548-7660. doi:10.18637/jss.v052.i05
-
[4]
OpenTURNS : An Industrial Software for Uncertainty Quantification in Simulation , pp
Baudin M, Dutfoy A, Iooss B, Popelin AL (2016). OpenTURNS : An Industrial Software for Uncertainty Quantification in Simulation , pp. 1--38. Springer International Publishing, Cham. ISBN 978-3-319-11259-6. doi:10.1007/978-3-319-11259-6_64-1. ://doi.org/10.1007/978-3-319-11259-6_64-1
-
[5]
A Unifying Framework for Parallel and Distributed Processing in R using Futures
Bengtsson H (2021). A Unifying Framework for Parallel and Distributed Processing in R using Futures. The R Journal , 13(2), 208--227. doi:10.32614/RJ-2021-048. ://doi.org/10.32614/RJ-2021-048
-
[6]
multisensi : Multivariate Sensitivity Analysis
Bidot C, Lamboni M, Monod H (2018). multisensi : Multivariate Sensitivity Analysis . R package version 2.1-1, ://CRAN.R-project.org/package=multisensi
work page 2018
-
[7]
Displacement Interpolation Using Lagrangian Mass Transport
Bonneel N, van de Panne M, Paris S, Heidrich W (2011). Displacement Interpolation Using Lagrangian Mass Transport. In Proceedings of the 2011 SIGGRAPH Asia Conference , SA '11, pp. 1--12. Association for Computing Machinery, New York, NY, USA. ISBN 978-1-4503-0807-6. doi:10.1145/2024156.2024192
-
[8]
A new uncertainty importance measure
Borgonovo E (2007). A new uncertainty importance measure. Reliability Engineering & System Safety, 92(6), 771--784
work page 2007
Show all 61 references
-
[9]
Convexity and Measures of Statistical Association
Borgonovo E, Figalli A, Ghosal P, Plischke E, Savar \'e G (2025). Convexity and Measures of Statistical Association. Journal of the Royal Statistical Society Series B: Statistical Methodology, p. qkaf018. ISSN 1369-7412. doi:10.1093/jrsssb/qkaf018
2025 doi
-
[10]
Global Sensitivity Analysis via Optimal Transport
Borgonovo E, Figalli A, Plischke E, Savar \'e G (2024). Global Sensitivity Analysis via Optimal Transport . Management Science. doi:10.1287/mnsc.2023.01796
2024
-
[11]
A Common Rationale for Global Sensitivity Measures and Their Estimation
Borgonovo E, Hazen GB, Plischke E (2016). A Common Rationale for Global Sensitivity Measures and Their Estimation . Risk Analysis, 36(10), 1871--1895. ISSN 1539-6924. doi:10.1111/risa.12555
2016 doi
-
[12]
Convergence rate of general entropic optimal transport costs
Carlier G, Pegon P, Tamanini L (2023). Convergence rate of general entropic optimal transport costs. Calculus of Variations and Partial Differential Equations, 62(4), 116
2023
-
[13]
A New Coefficient of Correlation
Chatterjee S (2021). A New Coefficient of Correlation . Journal of the American Statistical Association, 116(536), 2009--2022. ISSN 0162-1459. doi:10.1080/01621459.2020.1758115
2021
-
[14]
XICOR : Robust and generalized correlation coefficients
Chatterjee S, Holmes S (2023). XICOR : Robust and generalized correlation coefficients . Https://github.com/spholmes/XICOR, ://CRAN.R-project.org/package=XICOR
2023
-
[15]
Sinkhorn Distances : Lightspeed Computation of Optimal Transport
Cuturi M (2013). Sinkhorn Distances : Lightspeed Computation of Optimal Transport . In Advances in Neural Information Processing Systems , volume 26. Curran Associates, Inc
2013
-
[16]
Optimal Transport Tools ( OTT ): A JAX Toolbox for all things Wasserstein
Cuturi M, Meng-Papaxanthos L, Tian Y, Bunne C, Davis G, Teboul O (2022). Optimal Transport Tools ( OTT ): A JAX Toolbox for all things Wasserstein. arXiv preprint arXiv:2201.12324
2022 arXiv
- [17]
-
[18]
approxOT : approximate optimal transport
Dunipace EA (2024). approxOT : approximate optimal transport . R package version 1.1, ://github.com/ericdunipace/approxOT
2024
-
[19]
Rcpp : Seamless R and C++ Integration
Eddelbuettel D, Francois R (2011). Rcpp : Seamless R and C++ Integration . Journal of Statistical Software, 40, 1--18. ISSN 1548-7660. doi:10.18637/jss.v040.i08
2011 doi
-
[20]
An Invitation to Optimal Transport , Wasserstein Distances , and Gradient Flows
Figalli A, Glaudo F (2021). An Invitation to Optimal Transport , Wasserstein Distances , and Gradient Flows . https://ems.press/books/etb/190. doi:10.4171/etb/22
2021 doi
-
[21]
POT : Python Optimal Transport
Flamary R, Courty N, Gramfort A, Alaya MZ, Boisbunon A, Chambon S, Chapel L, Corenflos A, Fatras K, Fournier N, Gautheron L, Gayraud NT, Janati H, Rakotomamonjy A, Redko I, Rolet A, Schutz A, Seguy V, Sutherland DJ, Tavenard R, Tong A, Vayer T (2021). POT : Python Optimal Tran...
2021
-
[22]
Sensitivity Analysis for Multidimensional and Functional Outputs
Gamboa F, Janon A, Klein T, Lagnoux A (2014). Sensitivity Analysis for Multidimensional and Functional Outputs. Electronic Journal of Statistics, 8(1), 575--603. ISSN 1935-7524, 1935-7524. doi:10.1214/14-EJS895
2014 doi
-
[23]
On a Formula for the L2 Wasserstein Metric between Measures on Euclidean and Hilbert Spaces
Gelbrich M (1990). On a Formula for the L2 Wasserstein Metric between Measures on Euclidean and Hilbert Spaces . Mathematische Nachrichten, 147(1), 185--203. ISSN 1522-2616. doi:10.1002/mana.19901470121
1990 doi
-
[24]
The Shortlist Method for Fast Computation of the Earth Mover 's Distance and Finding Optimal Solutions to Transportation Problems
Gottschlich C, Schuhmacher D (2014). The Shortlist Method for Fast Computation of the Earth Mover 's Distance and Finding Optimal Solutions to Transportation Problems . PLOS ONE, 9(10), e110214. ISSN 1932-6203. doi:10.1371/journal.pone.0110214
2014 doi
-
[25]
SALib : An open-source Python library for Sensitivity Analysis
Herman J, Usher W (2017). SALib : An open-source Python library for Sensitivity Analysis. The Journal of Open Source Software, 2(9). doi:10.21105/joss.00097. ://doi.org/10.21105/joss.00097
2017 doi
-
[26]
sensitivity : Global Sensitivity Analysis of Model Outputs
Iooss B, Veiga SD, Janon A, Pujol G, with contributions from Baptiste Broto, Boumhaout K, Delage T, Amri RE, Fruth J, Gilquin L, Guillaume J, Herin M, Idrissi MI, Le Gratiet L, Lemaitre P, Marrel A, Meynaoui A, Nelson BL, Monari F, Oomen R, Rakovec O, Ramos B, Roustant O, Sara...
2022
-
[27]
Toward SALib 2.0: Advancing the accessibility and interpretability of global sensitivity analyses
Iwanaga T, Usher W, Herman J (2022). Toward SALib 2.0: Advancing the accessibility and interpretability of global sensitivity analyses. Socio-Environmental Systems Modelling, 4, 18155. doi:10.18174/sesmo.18155. ://sesmo.org/article/view/18155
2022 doi
-
[28]
Entropic Optimal Transport between Unbalanced Gaussian Measures Has a Closed Form
Janati H, Muzellec B, Peyr \'e G, Cuturi M (2020). Entropic Optimal Transport between Unbalanced Gaussian Measures Has a Closed Form . In Advances in Neural Information Processing Systems , volume 33, pp. 10468--10479. Curran Associates, Inc
2020
-
[29]
Multivariate Sensitivity Analysis to Measure Global Contribution of Input Factors in Dynamic Models
Lamboni M, Monod H, Makowski D (2011). Multivariate Sensitivity Analysis to Measure Global Contribution of Input Factors in Dynamic Models. Reliability Engineering & System Safety, 96(4), 450--459. ISSN 0951-8320. doi:10.1016/j.ress.2010.12.002
2011 doi
-
[30]
Qualitative Analysis of Insect Outbreak Systems: The Spruce Budworm and Forest
Ludwig D, Jones DD, Holling CS (2022). Qualitative Analysis of Insect Outbreak Systems: The Spruce Budworm and Forest. In Qualitative Analysis of Insect Outbreak Systems: The Spruce Budworm and Forest, pp. 547--564. University of Chicago Press. ISBN 978-0-226-12553-4. doi:10.7...
2022
-
[31]
Linear and Nonlinear Programming , volume 228 of International Series in Operations Research & Management Science
Luenberger DG, Ye Y (2021). Linear and Nonlinear Programming , volume 228 of International Series in Operations Research & Management Science . Springer International Publishing, Cham. ISBN 978-3-030-85449-2 978-3-030-85450-8. doi:10.1007/978-3-030-85450-8
2021 doi
-
[32]
UQLab : A Framework for Uncertainty Quantification in MATLAB
Marelli S, Sudret B (2014). UQLab : A Framework for Uncertainty Quantification in MATLAB . pp. 2554--2563. doi:10.1061/9780784413609.257
2014 doi
-
[33]
Four Simple Axioms of Dependence Measures
M \'o ri TF, Sz \'e kely GJ (2019). Four Simple Axioms of Dependence Measures. Metrika, 82(1), 1--16. ISSN 1435-926X. doi:10.1007/s00184-018-0670-3
2019 doi
- [34]
- [35]
-
[36]
MATLAB / R workflows to assess critical choices in Global Sensitivity Analysis using the SAFE toolbox
Noacco V, Sarrazin F, Pianosi F, Wagener T (2019). MATLAB / R workflows to assess critical choices in Global Sensitivity Analysis using the SAFE toolbox. MethodsX, 6, 2258--2280
2019
-
[37]
Revisiting the Social Cost of Carbon
Nordhaus WD (2017). Revisiting the Social Cost of Carbon. Proceedings of the National Academy of Sciences, 114(7), 1518--1523. doi:10.1073/pnas.1609244114
2017 doi
-
[38]
On the General Theory of Skew Correlation and Non-Linear Regression
Pearson K (1905). On the General Theory of Skew Correlation and Non-Linear Regression
1905
-
[39]
patchwork : The Composer of Plots
Pedersen TL (2024). patchwork : The Composer of Plots . R package version 1.2.0, ://CRAN.R-project.org/package=patchwork
2024
- [40]
-
[41]
A MATLAB Toolbox for Global Sensitivity Analysis
Pianosi F, Sarrazin F, Wagener T (2015). A MATLAB Toolbox for Global Sensitivity Analysis . Environmental Modelling & Software, 70, 80--85. ISSN 1364-8152. doi:10.1016/j.envsoft.2015.04.009
2015 doi
-
[42]
A simple and efficient method for global sensitivity analysis based on cumulative distribution functions
Pianosi F, Wagener T (2015). A simple and efficient method for global sensitivity analysis based on cumulative distribution functions. Environmental Modelling & Software, 67, 1--11
2015
-
[43]
sensobol : An R Package to Compute Variance-Based Sensitivity Indices
Puy A, Piano SL, Saltelli A, Levin SA (2022). sensobol : An R Package to Compute Variance-Based Sensitivity Indices . Journal of Statistical Software, 102, 1--37. ISSN 1548-7660. doi:10.18637/jss.v102.i05
2022 doi
-
[44]
The Future of Sensitivity Analysis : An Essential Discipline for Systems Modeling and Policy Support
Razavi S, Jakeman A, Saltelli A, Prieur C, Iooss B, Borgonovo E, Plischke E, Lo Piano S, Iwanaga T, Becker W, Tarantola S, Guillaume JHA, Jakeman J, Gupta H, Melillo N, Rabitti G, Chabridon V, Duan Q, Sun X, Smith S, Sheikholeslami R, Hosseini N, Asadzadeh M, Puy A, Kucherenko...
2021
-
[45]
On Measures of Dependence
R \'e nyi A (1959). On Measures of Dependence. Acta Mathematica Academiae Scientiarum Hungarica, 10(3), 441--451. ISSN 1588-2632. doi:10.1007/BF02024507
1959 doi
-
[46]
Detecting novel associations in large data sets
Reshef DN, Reshef YA, Finucane HK, Grossman SR, McVean G, Turnbaugh PJ, Lander ES, Mitzenmacher M, Sabeti PC (2011). Detecting novel associations in large data sets. science, 334(6062), 1518--1524
2011
-
[47]
Global Sensitivity Analysis : The Primer
Saltelli A, Ratto M, Andres T, Campolongo F, Cariboni J, Gatelli D, Saisana M, Tarantola S (2008). Global Sensitivity Analysis : The Primer . John Wiley & Sons. ISBN 978-0-470-72517-7
2008
-
[48]
Optimal Transport for Applied Mathematicians
Santambrogio F (2015). Optimal Transport for Applied Mathematicians . Birkh\"auser, Cham
2015
-
[49]
Stabilized Sparse Scaling Algorithms for Entropy Regularized Transport Problems
Schmitzer B (2019). Stabilized Sparse Scaling Algorithms for Entropy Regularized Transport Problems . SIAM Journal on Scientific Computing, 41(3), A1443--A1481. ISSN 1064-8275. doi:10.1137/16M1106018
2019 doi
-
[50]
transport : Computation of Optimal Transport Plans and Wasserstein Distances
Schuhmacher D, Bähre B, Bonneel N, Gottschlich C, Hartmann V, Heinemann F, Schmitzer B, Schrieber J (2024). transport : Computation of Optimal Transport Plans and Wasserstein Distances. R package version 0.15-2, ://cran.r-project.org/package=transport
2024
-
[51]
Diagonal Equivalence to Matrices with Prescribed Row and Column Sums
Sinkhorn R (1967). Diagonal Equivalence to Matrices with Prescribed Row and Column Sums . The American Mathematical Monthly, 74(4), 402--405. ISSN 0002-9890. doi:10.2307/2314570. 2314570
1967 doi
-
[52]
Global sensitivity indices for nonlinear mathematical models and their Monte Carlo estimates
Sobol IM (2001). Global sensitivity indices for nonlinear mathematical models and their Monte Carlo estimates. Mathematics and computers in simulation, 55(1-3), 271--280
2001
-
[53]
Solving Differential Equations in R : Package de S olve
Soetaert K, Petzoldt T, Setzer RW (2010). Solving Differential Equations in R : Package de S olve . Journal of Statistical Software, 33(9), 1--25. doi:10.18637/jss.v033.i09
2010 doi
-
[54]
An efficient method for computing partial expected value of perfect information for correlated inputs
Strong M, Oakley JE (2013). An efficient method for computing partial expected value of perfect information for correlated inputs. Medical Decision-Making, 33(6), 755--766
2013
-
[55]
furrr : Apply Mapping Functions in Parallel using Futures
Vaughan D, Dancho M (2022). furrr : Apply Mapping Functions in Parallel using Futures . R package version 0.3.1, ://CRAN.R-project.org/package=furrr
2022
-
[56]
Optimal Transport , volume 338 of Grundlehren Der Mathematischen Wissenschaften
Villani C (2009). Optimal Transport , volume 338 of Grundlehren Der Mathematischen Wissenschaften . Springer, Berlin, Heidelberg. ISBN 978-3-540-71049-3 978-3-540-71050-9. doi:10.1007/978-3-540-71050-9
2009 doi
-
[57]
ggplot2 : Elegant Graphics for Data Analysis
Wickham H (2016). ggplot2 : Elegant Graphics for Data Analysis . Springer-Verlag New York. ISBN 978-3-319-24277-4. ://ggplot2.tidyverse.org
2016
-
[58]
Measuring Association with Wasserstein Distances
Wiesel JCW (2022). Measuring Association with Wasserstein Distances. Bernoulli, 28(4), 2816--2832. ISSN 1350-7265. doi:10.3150/21-BEJ1438
2022 doi
-
[59]
T4transport : Tools for Computational Optimal Transport
You K (2023). T4transport : Tools for Computational Optimal Transport . R package version 0.1.2, ://CRAN.R-project.org/package=T4transport
2023
-
[60]
, " * write output.state after.block = add.period write newline
ENTRY address archive author booktitle chapter collaboration doi edition editor eid eprint howpublished institution isbn issn journal key month note number numpages organization pages publisher school series title type url volume year label extra.label sort.label short.list IN...
-
[61]
write newline
" write newline "" before.all 'output.state := FUNCTION n.dashify 't := "" t empty not t #1 #1 substring "-" = t #1 #2 substring "--" = not "--" * t #2 global.max substring 't := t #1 #1 substring "-" = "-" * t #2 global.max substring 't := while if t #1 #1 substring * t #2 gl...
Reviewed August 15, 2026 · model on record in the stance chip above.
Discussion (0). Continue with ORCID to comment.