REVIEW 2 major objections 5 minor 78 references
Magellan Spectroscopy of AGNs in Low-mass Galaxies: Scaling Relations and a Triple-Peaked AGN
T0 review · 2 major / 5 minor · reviewed 2026-08-06 · deepseek-v4-flash
Pith's one-line read Four low-mass active galaxies sit on the same black hole scaling relations as massive galaxies, and one of them shows a triple-peaked spectrum consistent with an AGN outflow plus a surrounding ring or disk of gas ionized by shocks or star…
desk verdict A useful, honest data paper with a rare triple-peaked AGN, but the shock-ionized ring conclusion leans on forced [O III] components that are not detected. read the letter →
The pith
A machine-rendered reading of the paper's core claim, the machinery that carries it, and where it could break.
The reading
What carries the argument
The argument is carried by a multi-component Gaussian decomposition of the AGN emission lines, anchored by the [S II] doublet and extended to H$\alpha$, [N II], and H$\beta$ under velocity-space width constraints, with an independent fit to [O III] tested against three models. For the triple-peaked galaxy, the red and blue components are forced in Model 3 to match the offsets, widths, and flux ratios seen in the other lines, which is what allows the flanking gas to be placed on diagnostic diagrams; the spatial offset of the emission is read directly from the two-dimensional spectra. Virial black hole masses come from the standard single-epoch estimator using broad H$\alpha$ luminosity and FWHM, and stellar velocity dispersions come from absorption-line fitting where absorption is detected, with [N II] line widths used as a proxy otherwise.
What would settle it
A deeper, higher signal-to-noise spectrum of the [O III] region of GAMA 5227891 that can detect or rule out weak components at $-131$ and $+156$ km s$^{-1}$ relative to the central peak would settle the matter; if the red and blue [O III] peaks are absent, Model 3 and the shock/star-formation classification of the outer gas would fail.
Extended reading notes
Core claim
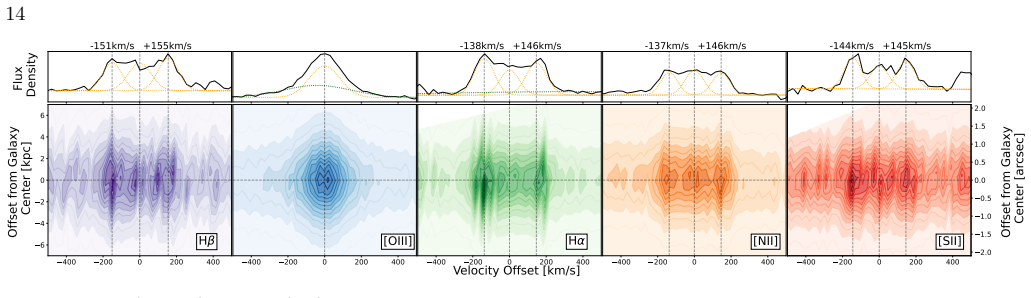
The central claim is that the low-mass active galaxies studied here continue the canonical black hole scaling relations: the four objects with broad H$\alpha$ detections have virial masses $M_{\rm BH}\sim10^{6.2}$--$10^{7.3}\,M_\odot$ and velocity dispersions $\sim25$--$80$ km s$^{-1}$, and they sit within the scatter of the canonical $M_{\rm BH}$--$\sigma_*$ relation and the $M_{\rm BH}$--$M_*$ relation for local AGNs. The paper's second, more novel claim concerns GAMA 5227891, a more massive host ($M_*\sim10^{10.97}\,M_\odot$), whose Balmer and forbidden lines show three kinematic components separated by roughly $\pm140$ km s$^{-1}$ while [O III] keeps a single narrow peak plus a broad, blueshifted component. The authors argue the data are consistent with a single central AGN whose outflow produces the broad [O III], together with an extended, roughly symmetric ring or disk of gas visible in the other lines. Line ratios of the flanking components fall in the composite/star-forming region of BPT diagrams and match shock models at electron density $\sim100$ cm$^{-3}$ and velocities of $\sim400$--$1000$ km s$^{-1}$; the authors caution that a triple-AGN system, while not formally ruled out, is highly unlikely.
Load-bearing premise
The interpretation of the outer gas as shock- or star-formation-ionized rests on weak red and blue peaks in the [O III] line whose positions and fluxes were forced by the fitter to match the other triple-peaked lines; if those peaks are not real, the shock and star-formation diagnosis loses its main spectral support.
Editorial extensions
If this is right
- If the scaling-relation result holds, surveys of faint active galaxies in dwarfs can estimate black hole masses from galaxy stellar mass or velocity dispersion alone in the $M_{\rm BH}\sim10^6$--$10^7\,M_\odot$ range.
- The triple-peaked system implies that AGN outflows can coexist with—and possibly help create—extended gas structures whose ionization is dominated by shocks, so feedback may be visible as a kinematic ring or disk rather than only as a nuclear line.
- The absence of a downturn at low $\sigma_*$ is consistent with earlier low-mass AGN samples, but the paper notes that selection bias toward more massive black holes leaves the lowest-mass end of the relations untested.
- The two galaxies without broad H$\alpha$ receive only upper limits on black hole mass that fall below scaling-relation predictions, indicating that many low-mass AGNs may lack a broad-line region or be type 2 sources.
Reading between the lines
- If the shocked-gas picture is right, GAMA 5227891 is a nearby system in which the same AGN outflow that ionizes the nuclear gas also shapes gas at kiloparsec radii; a deep narrow-band image should reveal star-forming regions or shocked filaments at the radii corresponding to the red and blue line offsets.
- The forced Model 3 fit to [O III] is the empirical hinge of the shock and star-formation interpretation, and higher signal-to-noise spectroscopy of the [O III] region would settle whether the flanking components are real; until then, the outer-gas ionization story should be treated as suggestive rather than established.
- If the apparent absence of a low-mass downturn in $M_{\rm BH}$--$\sigma_*$ is real rather than a selection effect, it would argue against the strongest light-seeding scenarios, but the paper's own bias discussion shows the present sample cannot carry that weight.
- Extending the three-component fitting strategy to other AGNs with asymmetric lines could uncover more such systems, especially if the forced-component approach is replaced by a Bayesian model comparison that handles undetected peaks explicitly.
Editorial analysis
A structured set of objections, weighed in public.
Referee Report
Summary. The paper presents new Magellan/MagE spectroscopy of six AGN host galaxies selected from GAMA/SDSS, with stellar masses mostly below 5×10^9 M_sun. For four galaxies with broad H-alpha, the authors estimate virial black hole masses using the Greene & Ho (2005) scaling relation, and derive stellar velocity dispersions either from stellar absorption lines (two objects) or from the [N II] gas width as a proxy (four objects). They compare these measurements with the Kormendy & Ho (2013) M_BH-σ* and Reines & Volonteri (2015) M_BH-M* relations and report general consistency. The central new result is GAMA 5227891, a galaxy with triple-peaked H-alpha, H-beta, [N II], and [S II] emission lines while [O III] shows a single narrow peak plus a broad component. The authors interpret the central component as AGN photoionization with an outflow, and the red/blue peaks as an extended ring/disk ionized by shocks and/or star formation, based in part on BPT positions of forced [O III] components and Allen et al. (2008) shock models.
Significance. If the triple-peaked interpretation is correct, this is a rare, spatially resolved example of AGN feedback affecting circumnuclear gas, with a central AGN driving an outflow and outer gas ionized by shocks or star formation. The paper also adds four low-mass points to the black hole scaling relations using a consistent methodology. Strengths include the verification of the triple peaks against the raw 2D spectra (Appendix), the transparent description of the line fitting, and the explicit caveats about small sample size and the gas-proxy velocity dispersions. The main weakness is that the [O III] red/blue components, which carry the shock/star-formation diagnostic, are not independently detected; they are forced to match the other lines and are not statistically preferred by the fit.
major comments (2)
- [§4.6, Fig. 5; §6.2, Fig. 9] The three-component [O III] fit (Model 3) is not statistically preferred: the reduced chi-squared is 0.986 versus 0.927 for Model 2, and the unconstrained three-component fit collapses to zero flux in one peak. The red and blue [O III] components are therefore not detected independently; their fluxes, offsets, and widths are forced to follow the other emission lines. Nevertheless, Section 6.2 and Figure 9 use exactly these forced components to compute [O III]/H-beta for the red and blue peaks, place them on the BPT diagrams, and compare them with Allen et al. (2008) shock grids, and the abstract and conclusions state that the outer gas is 'predominantly ionized by shocks and/or star formation.' Since the [O III]/H-beta axis is unconstrained by the data for these components, the shock/star-formation interpretation is not supported by an independent diagnostic. The authors should either reframe the conclusion as conditional on the assumed [O III] model or provide an analysis that does not depend on the forced components (for example, using [S II]/H-alpha alone or showing how the BPT placement changes with plausible [O III] flux upper limits).
- [§6.3, Fig. 8] The interpretation of the red/blue peaks as an extended ring/disk rests on the 2D spectra showing emission offset in position and velocity, but no quantitative measure is provided, such as the spatial extent of the emission, the spatial centroids of the red and blue components, or a rotation-curve fit. The data are also consistent with other kinematic structures, including a bipolar outflow or a warped disk, and the discussion in Section 6.3 acknowledges that distinguishing these scenarios is difficult. To make the 'ring/disk' language in the abstract and conclusions load-bearing, the authors should either quantify the spatial distribution and its kinematics, or soften the claim to a structure that is 'disk-like or outflow-related' and specify what future observation would discriminate between these cases.
minor comments (5)
- [Table 2] For GAMA 5227891, the tabulated [O III] fluxes are those of Model 2, but the red/blue BPT points in Figure 9 use Model 3 forced components whose fluxes are not listed anywhere; report the Model 3 component fluxes and their uncertainties since they are used in diagnostic plots.
- [§4.6, Table 3] The stellar velocity dispersion reported for GAMA 5227891 is derived from the total [N II] width of a triple-peaked profile (157 km/s); using this as a proxy likely overestimates the true stellar velocity dispersion, and this should be noted prominently when interpreting the object's position in Figure 6.
- [§5.1] The text says four galaxies are compared with the scaling relations, but four of the six galaxies have σ* from the [N II] gas proxy; the figures and text should consistently remind the reader that those points carry an additional 0.15 dex scatter from the σ_g-σ* relation.
- [§6.2] The sentence 'the red and blue peaks lie in the composite and star-forming regions' should explicitly say 'under Model 3's assumed [O III] components,' not just 'if these red/blue peaks in [O III] do indeed exist,' because the fluxes are model-imposed.
- [§2] The sample description says 'we select a subset of five galaxies' and then adds one filler object, making six; the wording could be clarified to avoid apparent inconsistency.
Circularity Check
No significant circularity: the scaling-relation results rest on external virial and benchmark relations, and the triple-peaked [O III] interpretation is explicitly conditional rather than a predicted derivation.
full rationale
The main scientific results of this paper are the virial black hole masses and their placement on the M_BH-sigma* and M_BH-M* relations. The BH masses are obtained from Equation (1), which is the Greene & Ho (2005) virial relation with epsilon = 1 as in Reines et al. (2013); this is an external calibration applied to the measured broad H-alpha luminosity and FWHM, and the comparison relations (Kormendy & Ho 2013; Reines & Volonteri 2015; Xiao et al. 2011; Baldassare et al. 2020) are independent external benchmarks. The velocity dispersions come from pPXF fits to stellar absorption lines or from the [N II] width using the external sigma*-sigma_g relation of Barth et al. (2008). Self-citations (Salehirad et al. 2022; Reines et al. 2013) supply the target list and the fitting recipe, but they are not fitted constraints and the new MagE data are independent. For the triple-peaked galaxy, the red/blue peaks in H-alpha, H-beta, [N II], and [S II] are robustly detected and confirmed in the raw 2-D spectra (Appendix). The [O III] red/blue components are not independently detected: Section 4.6 states that the unconstrained three-component fit collapses, and Model 3 is only obtained by forcing offsets, widths, and flux ratios to mimic the other lines, with reduced chi^2 = 0.986 versus 0.927 for Model 2. However, the paper does not present Model 3 as a prediction; it explicitly hedges the interpretation with "if these red/blue peaks in the [O III] line do indeed exist" and "very dim, if present at all", and in Section 6.3 calls the shock/ring scenario "speculative" and needing additional observations. The BPT and shock-model comparison for the red/blue [O III] peaks is therefore a conditional consistency argument built on an assumed model, not a derived result whose output is equivalent to its input. Accordingly, no circular step meeting the quoted-evidence standard is present; the closest issue is a robustness and assumption concern, not circularity.
Assumptions & free parameters
assumptions (5)
- domain assumption Gas in the broad-line region is virialized and the BLR size scales with H alpha luminosity as in Greene & Ho (2005), applied here via Eq. (1) with epsilon=1.
- domain assumption [N II] line width is a valid proxy for stellar velocity dispersion with about 0.15 dex scatter (Barth et al. 2008), used for four galaxies.
- domain assumption The local scaling relations from Kormendy & Ho (2013) and Reines & Volonteri (2015) are applicable at z about 0.2 without redshift evolution.
- domain assumption Shock models from Allen et al. (2008) with transverse magnetic field b=1 microGauss describe the ionization of the red and blue gas.
- domain assumption The stellar mass of GAMA 5227891 from the GAMA ProSpect table (10^10.97 Msun) is reliable despite the missing g-band imaging that motivated the change from the originally reported value.
Cite this review
Pith. "Pith review of Magellan Spectroscopy of AGNs in Low-mass Galaxies: Scaling Relations and a Triple-Peaked AGN." pith.science (2026). https://pith.science/paper/2HLYV2MM
@misc{pith2026250718703,
  author       = {Pith},
  title        = {Pith review of: Magellan Spectroscopy of AGNs in Low-mass Galaxies: Scaling Relations and a Triple-Peaked AGN},
  year         = {2026},
  howpublished = {\url{https://pith.science/paper/2HLYV2MM}},
  note         = {Machine review of arXiv:2507.18703}
}
abstract
In this work, we aim to further populate the low-mass regime of black hole (BH) scaling relations to better understand the formation and growth mechanisms of central supermassive BHs. We target six galaxies that have been previously identified as hosting active galactic nuclei (AGN) based on optical spectroscopy from the Galaxy and Mass Assembly (GAMA) survey or the Sloan Digital Sky Survey (SDSS) with stellar masses reported to be M$_\star < 5 \times 10^9$ M$_\odot$. Using follow-up optical spectroscopy from the Magellan Echellette Spectrograph (MagE), we extract galaxy velocity dispersions ($\sigma_\star$) and estimate virial BH masses from broad H$\alpha$ emission. We find that the galaxies in our sample do not deviate significantly from either the M$_{BH}-\sigma_\star$ or M$_{BH}-$M$_{\star}$ scaling relations defined by higher mass galaxies. Additionally, we identify one galaxy with triple-peaked SII, NII, H$\alpha$ and H$\beta$ emission lines. This spectral shape is not shared by OIII and, in fact, the OIII line appears to have distinct kinematics from the other emission lines. Incorporating the spatial distribution of the various emission lines, we find that the galaxy spectrum is consistent with a prominent central AGN driving an outflow, surrounded by an extended ring/disk of gas predominantly ionized by shocks and/or star formation. This work has implications for the demographics of BHs in low-mass galaxies and the role of AGN feedback.
Figures


Figures from the paper (6 more)




Reference graph
Works this paper leans on
-
[1]
Allen, M. G., Groves, B. A., Dopita, M. A., Sutherland, R. S., & Kewley, L. J. 2008, ApJS, 178, 20, doi: 10.1086/589652
doi:10.1086/589652 2008
-
[2]
F., Dickey, C., Geha, M., & Reines, A
Baldassare, V. F., Dickey, C., Geha, M., & Reines, A. E. 2020, ApJL, 898, L3, doi: 10.3847/2041-8213/aba0c1
-
[3]
Baldassare, V. F., Reines, A. E., Gallo, E., & Greene, J. E. 2015, ApJL, 809, L14, doi: 10.1088/2041-8205/809/1/L14 —. 2017, ApJ, 850, 196, doi: 10.3847/1538-4357/aa9067
-
[4]
Baldassare, V. F., Reines, A. E., Gallo, E., et al. 2016, ApJ, 829, 57, doi: 10.3847/0004-637X/829/1/57
-
[5]
Baldwin, J. A., Phillips, M. M., & Terlevich, R. 1981, Publications of the Astronomical Society of the Pacific, 93, 5, doi: 10.1086/130766
doi:10.1086/130766 1981
-
[6]
Barth, A. J., Greene, J. E., & Ho, L. C. 2008, AJ, 136, 1179, doi: 10.1088/0004-6256/136/3/1179
-
[7]
Barth, A. J., Ho, L. C., Rutledge, R. E., & Sargent, W. L. W. 2004, ApJ, 607, 90, doi: 10.1086/383302 18
doi:10.1086/383302 2004
-
[8]
Bellstedt, S., Robotham, A. S. G., Driver, S. P., et al. 2020, MNRAS, 498, 5581, doi: 10.1093/mnras/staa2620 Ben ´ ıtez, E., Rodr ´ ıguez-Espinosa, J. M., Cruz-Gonz´ alez, I., et al. 2018, MNRAS, 474, L56, doi: 10.1093/mnrasl/slx188 Ben ´ ıtez, E., Cruz-Gonz´ alez, I., Rodr ´ ıguez-Espinosa, J. M., et al. 2019, MNRAS, 490, 5521, doi: 10.1093/mnras/stz2884
Show all 78 references
-
[9]
Malkan, M. A. 2011, ApJ, 726, 59, doi: 10.1088/0004-637X/726/2/59
2011 doi
-
[10]
N., Treu, T., Auger, M
Bennert, V. N., Treu, T., Auger, M. W., et al. 2015, ApJ, 809, 20, doi: 10.1088/0004-637X/809/1/20
2015 doi
-
[11]
2003, MNRAS, 344, 1000, doi: 10.1046/j.1365-8711.2003.06897.x
Bruzual, G., & Charlot, S. 2003, MNRAS, 344, 1000, doi: 10.1046/j.1365-8711.2003.06897.x
2003
-
[12]
2020, A&A, 634, A114, doi: 10.1051/0004-6361/201936321
Caglar, T., Burtscher, L., Brandl, B., et al. 2020, A&A, 634, A114, doi: 10.1051/0004-6361/201936321
2020 doi
-
[13]
2017, MNRAS, 466, 798, doi: 10.1093/mnras/stw3020
Cappellari, M. 2017, MNRAS, 466, 798, doi: 10.1093/mnras/stw3020
2017 doi
-
[14]
2004, PASP, 116, 138, doi: 10.1086/381875
Cappellari, M., & Emsellem, E. 2004, PASP, 116, 138, doi: 10.1086/381875
2004 doi
-
[15]
C., Peletier, R
Chen, Y.-P., Trager, S. C., Peletier, R. F., et al. 2014, A&A, 565, A117, doi: 10.1051/0004-6361/201322505 De Rosa, A., Vignali, C., Bogdanovi´ c, T., et al. 2019, NewAR, 86, 101525, doi: 10.1016/j.newar.2020.101525
2014
-
[16]
J., Lang, D., et al
Dey, A., Schlegel, D. J., Lang, D., et al. 2019, AJ, 157, 168, doi: 10.3847/1538-3881/ab089d
2019 doi
-
[17]
Elitzur, M., & Ho, L. C. 2009, ApJL, 701, L91, doi: 10.1088/0004-637X/701/2/L91
2009 doi
- [18]
-
[19]
V., & Sargent, W
Filippenko, A. V., & Sargent, W. L. W. 1989, ApJL, 342, L11, doi: 10.1086/185472
1989 doi
-
[21]
2000, The Astrophysical Journal, 539, L13, doi: 10.1086/312840
Gebhardt, K., Bender, R., Bower, G., et al. 2000, The Astrophysical Journal, 539, L13, doi: 10.1086/312840
2000 doi
-
[22]
W., & Scott, N
Graham, A. W., & Scott, N. 2014, The Astrophysical Journal, 798, 54, doi: 10.1088/0004-637x/798/1/54
2014 doi
-
[23]
E., & Ho, L
Greene, J. E., & Ho, L. C. 2005, ApJ, 630, 122, doi: 10.1086/431897 —. 2007, ApJ, 670, 92, doi: 10.1086/522082
2005 doi
-
[24]
E., Ho, L
Greene, J. E., Ho, L. C., & Barth, A. J. 2008, The Astrophysical Journal, 688, 159, doi: 10.1086/592078
2008 doi
-
[25]
E., Strader, J., & Ho, L
Greene, J. E., Strader, J., & Ho, L. C. 2020, ARA&A, 58, 257, doi: 10.1146/annurev-astro-032620-021835
2020 doi
-
[26]
E., Peng, C
Greene, J. E., Peng, C. Y., Kim, M., et al. 2010, The Astrophysical Journal, 721, 26, doi: 10.1088/0004-637x/721/1/26
2010 doi
-
[27]
2002, ApJ, 579, 205, doi: 10.1086/342703
Gu, Q., & Huang, J. 2002, ApJ, 579, 205, doi: 10.1086/342703
2002 doi
-
[28]
R., Suntzeff, N
Hamuy, M., Walker, A. R., Suntzeff, N. B., et al. 1992, PASP, 104, 533, doi: 10.1086/133028
1992 doi
-
[29]
A., Tremonti, C
Hao, L., Strauss, M. A., Tremonti, C. A., et al. 2005, AJ, 129, 1783, doi: 10.1086/428485
2005 doi
- [30]
-
[31]
E., Bennert, V
Harris, C. E., Bennert, V. N., Auger, M. W., et al. 2012, ApJS, 201, 29, doi: 10.1088/0067-0049/201/2/29
2012 doi
-
[32]
M., Miley, G
Heckman, T. M., Miley, G. K., & Green, R. F. 1984, ApJ, 281, 525, doi: 10.1086/162125
1984 doi
-
[33]
1986, PASP, 98, 609, doi: 10.1086/131801
Horne, K. 1986, PASP, 98, 609, doi: 10.1086/131801
1986 doi
-
[34]
2008, Monthly Notices of the Royal Astronomical Society, 386, 2242, doi: 10.1111/j.1365-2966.2008.13195.x H¨ aring, N., & Rix, H.-W
Hu, J. 2008, Monthly Notices of the Royal Astronomical Society, 386, 2242, doi: 10.1111/j.1365-2966.2008.13195.x H¨ aring, N., & Rix, H.-W. 2004, The Astrophysical Journal, 604, L89, doi: 10.1086/383567 Juodˇ zbalis, I., Conselice, C. J., & Singh, M. 2023, MNRAS, 525, 1353, do...
2008
-
[35]
M., Tremonti, C., et al
Kauffmann, G., Heckman, T. M., Tremonti, C., et al. 2003, MNRAS, 346, 1055, doi: 10.1111/j.1365-2966.2003.07154.x
2003
-
[36]
J., Dopita, M
Kewley, L. J., Dopita, M. A., Sutherland, R. S., Heisler, C. A., & Trevena, J. 2001, ApJ, 556, 121, doi: 10.1086/321545
2001 doi
-
[37]
J., Groves, B., Kauffmann, G., & Heckman, T
Kewley, L. J., Groves, B., Kauffmann, G., & Heckman, T. 2006, MNRAS, 372, 961, doi: 10.1111/j.1365-2966.2006.10859.x
2006
-
[38]
2021, ApJ, 911, 134, doi: 10.3847/1538-4357/abec40
Geha, M. 2021, ApJ, 911, 134, doi: 10.3847/1538-4357/abec40
2021 doi
- [39]
-
[40]
2013, A&A, 549, A100, doi: 10.1051/0004-6361/201219411
Kollatschny, W., & Zetzl, M. 2013, A&A, 549, A100, doi: 10.1051/0004-6361/201219411
2013 doi
-
[41]
Kormendy, J., Bender, R., & Cornell, M. E. 2011, Nature, 469, 374, doi: 10.1038/nature09694
2011 doi
-
[42]
Kormendy, J., & Ho, L. C. 2013, ARA&A, 51, 511, doi: 10.1146/annurev-astro-082708-101811
2013 doi
- [43]
-
[44]
R., Greene, J
Ludwig, R. R., Greene, J. E., Barth, A. J., & Ho, L. C. 2012, ApJ, 756, 51, doi: 10.1088/0004-637X/756/1/51
2012 doi
- [45]
-
[46]
Marconi, A., & Hunt, L. K. 2003, The Astrophysical Journal, 589, L21, doi: 10.1086/375804 19
2003 doi
- [47]
-
[48]
J., & Ma, C.-P
McConnell, N. J., & Ma, C.-P. 2013, The Astrophysical Journal, 764, 184, doi: 10.1088/0004-637x/764/2/184
2013 doi
-
[49]
2001, The Astrophysical Journal, 547, 140, doi: 10.1086/318372 M¨ uller-S´ anchez, F., Comerford, J
Merritt, D., & Ferrarese, L. 2001, The Astrophysical Journal, 547, 140, doi: 10.1086/318372 M¨ uller-S´ anchez, F., Comerford, J. M., Nevin, R., et al. 2015, ApJ, 813, 103, doi: 10.1088/0004-637X/813/2/103
2001 doi
-
[50]
B., & Ingargiola, A
Newville, M., Stensitzki, T., Allen, D. B., & Ingargiola, A. 2014, LMFIT: Non-Linear Least-Square Minimization and Curve-Fitting for Python, 0.8.0, Zenodo, doi: 10.5281/zenodo.11813
2014 doi
-
[51]
D., Seth, A
Nguyen, D. D., Seth, A. C., Neumayer, N., et al. 2018, ApJ, 858, 118, doi: 10.3847/1538-4357/aabe28 —. 2019, ApJ, 872, 104, doi: 10.3847/1538-4357/aafe7a
2018 doi
-
[52]
2023, ApJL, 942, L17, doi: 10.3847/2041-8213/aca9d3
Onoue, M., Inayoshi, K., Ding, X., et al. 2023, ApJL, 942, L17, doi: 10.3847/2041-8213/aca9d3
2023 doi
-
[53]
2018, ApJL, 864, L6, doi: 10.3847/2041-8213/aad8b2
Pacucci, F., Loeb, A., Mezcua, M., & Mart ´ ın-Navarro, I. 2018, ApJL, 864, L6, doi: 10.3847/2041-8213/aad8b2
2018 doi
-
[54]
X., Hennawi, J
Prochaska, J. X., Hennawi, J. F., Westfall, K. B., et al. 2020a, Journal of Open Source Software, 5, 2308, doi: 10.21105/joss.02308
-
[55]
X., Hennawi, J., Cooke, R., et al
Prochaska, J. X., Hennawi, J., Cooke, R., et al. 2020b, pypeit/PypeIt: Release 1.0.0, v1.0.0, Zenodo, doi: 10.5281/zenodo.3743493
-
[56]
2001, A&A, 369, 1048, doi: 10.1051/0004-6361:20010163
Prugniel, P., & Soubiran, C. 2001, A&A, 369, 1048, doi: 10.1051/0004-6361:20010163
2001 doi
-
[57]
Reines, A. E. 2022, Nature Astronomy, 6, 26, doi: 10.1038/s41550-021-01556-0
2022 doi
-
[58]
E., Greene, J
Reines, A. E., Greene, J. E., & Geha, M. 2013, The Astrophysical Journal, 775, 116, doi: 10.1088/0004-637x/775/2/116
2013 doi
-
[59]
E., & Volonteri, M
Reines, A. E., & Volonteri, M. 2015, The Astrophysical Journal, 813, 82, doi: 10.1088/0004-637x/813/2/82
2015 doi
-
[60]
2018, MNRAS, 481, 3278, doi: 10.1093/mnras/sty2448
Ricarte, A., & Natarajan, P. 2018, MNRAS, 481, 3278, doi: 10.1093/mnras/sty2448
2018 doi
-
[61]
J., Shields, G
Rosario, D. J., Shields, G. A., Taylor, G. B., Salviander, S., & Smith, K. L. 2010, ApJ, 716, 131, doi: 10.1088/0004-637X/716/1/131
2010 doi
-
[62]
E., & Molina, M
Salehirad, S., Reines, A. E., & Molina, M. 2022, ApJ, 937, 7, doi: 10.3847/1538-4357/ac8876 —. 2025, ApJ, 979, 26, doi: 10.3847/1538-4357/ad9a57
2022 doi
-
[63]
L., Shapley, A
Sanders, R. L., Shapley, A. E., Kriek, M., et al. 2016, ApJ, 816, 23, doi: 10.3847/0004-637X/816/1/23
2016 doi
-
[65]
2010, A&A, 516, A87, doi: 10.1051/0004-6361/201014193
Schulze, A., & Wisotzki, L. 2010, A&A, 516, A87, doi: 10.1051/0004-6361/201014193
2010 doi
-
[66]
Schutte, Z., & Reines, A. E. 2022, Nature, 601, 329, doi: 10.1038/s41586-021-04215-6
2022 doi
-
[67]
E., & Strauss, M
Shen, Y., Liu, X., Greene, J. E., & Strauss, M. A. 2011, ApJ, 735, 48, doi: 10.1088/0004-637X/735/1/48
2011 doi
-
[68]
L., Shields, G
Smith, K. L., Shields, G. A., Salviander, S., Stevens, A. C., & Rosario, D. J. 2012, ApJ, 752, 63, doi: 10.1088/0004-637X/752/1/63
2012 doi
-
[69]
R., & Reines, A
Sturm, M. R., & Reines, A. E. 2024, ApJ, 971, 173, doi: 10.3847/1538-4357/ad55e6
2024 doi
-
[70]
N., Hopkins, A
Taylor, E. N., Hopkins, A. M., Baldry, I. K., et al. 2011, MNRAS, 418, 1587, doi: 10.1111/j.1365-2966.2011.19536.x
2011
-
[71]
E., Barth, A
Thornton, C. E., Barth, A. J., Ho, L. C., Rutledge, R. E., & Greene, J. E. 2008, ApJ, 686, 892, doi: 10.1086/591519
2008 doi
-
[73]
2008, MNRAS, 383, 1079, doi: 10.1111/j.1365-2966.2007.12589.x
Volonteri, M., Lodato, G., & Natarajan, P. 2008, MNRAS, 383, 1079, doi: 10.1111/j.1365-2966.2007.12589.x
2008
-
[75]
1999, ApJL, 519, L39, doi: 10.1086/312106
Wandel, A. 1999, ApJL, 519, L39, doi: 10.1086/312106
1999 doi
-
[76]
2013, ApJ, 772, 49, doi: 10.1088/0004-637X/772/1/49
Woo, J.-H., Schulze, A., Park, D., et al. 2013, ApJ, 772, 49, doi: 10.1088/0004-637X/772/1/49
2013 doi
-
[77]
A., & Blandford, R
Woo, J.-H., Treu, T., Malkan, M. A., & Blandford, R. D. 2006, ApJ, 645, 900, doi: 10.1086/504586
2006 doi
-
[78]
J., Greene, J
Xiao, T., Barth, A. J., Greene, J. E., et al. 2011, ApJ, 739, 28, doi: 10.1088/0004-637X/739/1/28
2011 doi
-
[79]
I., Papovich, C., et al
Yang, G., Caputi, K. I., Papovich, C., et al. 2023, ApJL, 950, L5, doi: 10.3847/2041-8213/acd639
2023 doi
-
[80]
L., & Greene, J
Zakamska, N. L., & Greene, J. E. 2014, MNRAS, 442, 784, doi: 10.1093/mnras/stu842
2014 doi
-
[81]
2024, ApJ, 960, 108, doi: 10.3847/1538-4357/ad029a
Zhang, X. 2024, ApJ, 960, 108, doi: 10.3847/1538-4357/ad029a
2024 doi
-
[82]
2009, Monthly Notices of the Royal Astronomical Society, 400, 1181–1198, doi: 10.1111/j.1365-2966.2009.15528.x
Zibetti, S., Charlot, S., & Rix, H.-W. 2009, Monthly Notices of the Royal Astronomical Society, 400, 1181–1198, doi: 10.1111/j.1365-2966.2009.15528.x
2009
Reviewed August 6, 2026 · model on record in the stance chip above.
Discussion (0). Sign in to comment.