REVIEW 2 major objections 5 minor 72 references
The Arizona Molecular ISM Survey with the SMT: The Diverse Carbon Monoxide Line Ratios and Spectral Line Energy Distributions of Star Forming Galaxies
T0 review · 2 major / 5 minor · reviewed 2026-08-06 · deepseek-v4-flash
Pith's one-line read Across 47 nearby star-forming galaxies, the CO(2–1)/CO(1–0) and CO(3–2)/CO(1–0) line ratios rise smoothly with star formation rate and its surface density, with a spread larger than simulations predict.
desk verdict Solid, useful extension of AMISS with new r31 prescriptions for gas mass work, but the treatment of the 11 CO(3–2) upper limits in the fits needs to be settled before I trust the low-end calibration. read the letter →
The pith
A machine-rendered reading of the paper's core claim, the machinery that carries it, and where it could break.
The reading
What carries the argument
The argument is carried by the three lowest CO line ratios $r_{21}$, $r_{31}$, and $r_{32}$, which the paper models as power laws in galaxy properties: $\log r_{jk} = m\log x + b + \epsilon_{(s)}$, with log-normal intrinsic scatter. These fits produce the prescriptions for estimating CO(1–0) luminosities from higher-J lines. For the physical interpretation, the paper uses a published grid of molecular cloud models in which each cloud has a log-normal H$_2$ density distribution characterized by mean density $n_0$ and width $\sigma_n$, a uniform kinetic temperature $T_k$, and a fixed CO column density per line width $N/dv$, with line emission computed in non-LTE. Binned median $r_{21}$–$r_{31}$ values are placed on model tracks to infer how $n_0$ and $T_k$ shift with $\Sigma_{\rm SFR}$.
What would settle it
A galaxy sample spanning the same $\Sigma_{\rm SFR}$ range whose integrated $r_{21}$ and $r_{31}$ values do not vary with $\Sigma_{\rm SFR}$ — for example, a mass-selected CO(3–2) survey of quiescent galaxies — would falsify the claimed correlations and the density-continuum interpretation built on them.
Extended reading notes
Core claim
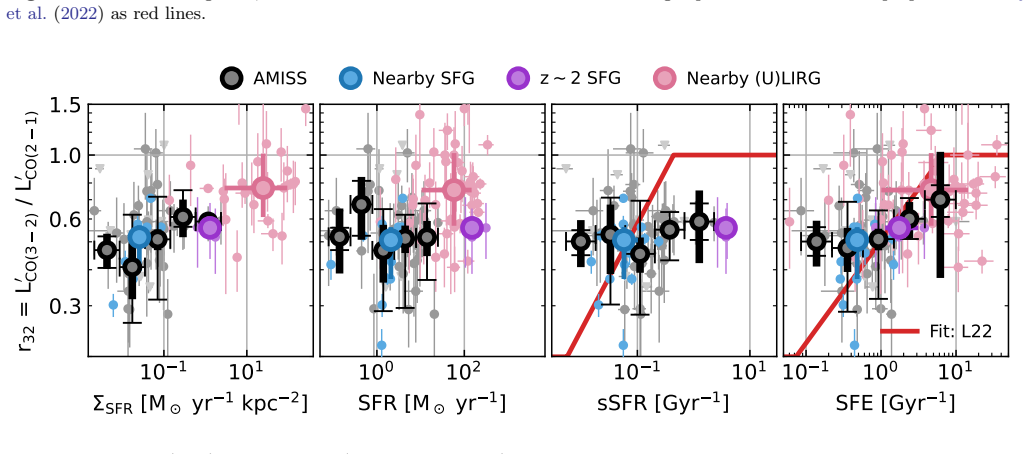
Across the three lowest rotational transitions of carbon monoxide, the spectral line energy distribution of a galaxy is not a fixed template. The central result is that the CO(2–1)/CO(1–0) ratio $r_{21}$ and the CO(3–2)/CO(1–0) ratio $r_{31}$ increase smoothly with SFR, $\Sigma_{\rm SFR}$, sSFR, and SFE, with slopes of roughly 0.1–0.2 in log–log space, while $r_{21}$ and $r_{31}$ are consistent with no trend with stellar mass. The observed dynamic range in $r_{31}$ spans about a factor of three and is larger than simulation-based SLED prescriptions predict, especially at low $\Sigma_{\rm SFR}$. When the galaxy-averaged ratios are compared with molecular cloud models, the sequence of binned medians follows tracks of increasing mean H$_2$ density, from below $10^2$ cm$^{-3}$ in the most quiescent systems to above $10^3$ cm$^{-3}$ in ULIRG-like starbursts, with degenerate combinations of density and temperature also allowed.
Load-bearing premise
The load-bearing premise is that each galaxy's integrated CO line ratios can be represented by a single molecular cloud model and that cloud conditions vary smoothly with $\Sigma_{\rm SFR}$; if instead a galaxy's emission is an unresolved mixture of very different cloud populations that happens to average out, the inferred density trend would not follow.
Editorial extensions
If this is right
- The provided prescriptions (Equations 6–9) let observers convert a single CO(2–1) or CO(3–2) luminosity into a CO(1–0) luminosity and molecular gas mass without assuming a constant line ratio, removing a known source of bias for diverse galaxy samples.
- Because the same power laws describe literature measurements from local main-sequence galaxies to $z \sim 2$ and submillimeter-selected galaxies, the relations appear to hold over four to five orders of magnitude in $\Sigma_{\rm SFR}$.
- The flatness of $r_{32}$ with SFR and its mild positive correlation with $\Sigma_{\rm SFR}$ means that area-normalized quantities capture the shape of the low-J CO SLED better than total SFR, consistent with a radiation-field-driven excitation picture.
- The inferred continuum of mean gas density connects low-SFR galaxies, whose molecular gas is warm and low-density and likely below the star-formation threshold, to starbursts, whose denser gas raises star formation efficiency.
Reading between the lines
- If the SFR-based prescriptions hold at high redshift, single-line CO(3–2) surveys could yield molecular gas masses for large samples where CO(1–0) is unavailable, making the Kennicutt–Schmidt slope testable without a constant-excitation correction.
- The absence of a stellar-mass trend at fixed SFR suggests that earlier reports of line-ratio variations with galaxy mass may be a proxy for the SFR axis; a mass-selected CO(3–2) survey of quiescent, low-SFR high-mass galaxies would test this directly.
- The continuum picture predicts that at fixed $\Sigma_{\rm SFR}$, galaxies with higher $r_{31}$ should have higher fractions of dense gas traced by molecules like HCN or CS; existing dense-gas surveys could check this prediction.
- The degeneracy between density and temperature found at fixed line ratios implies that low-J CO alone cannot uniquely fingerprint ISM conditions; adding mid-J CO, CO isotopologues, or dust measurements is a natural next test, as the paper acknowledges.
Editorial analysis
A structured set of objections, weighed in public.
Referee Report
Summary. The paper presents galaxy-scale CO(1-0), CO(2-1), and CO(3-2) observations for 47 nearby, predominantly star-forming galaxies from the Arizona Molecular ISM Survey with the SMT (AMISS), supplemented by literature data. It constructs low-J CO SLEDs and line ratios r21, r31, and r32, and fits power-law relations between these ratios and galaxy properties such as SFR, ΣSFR, sSFR, SFE, and stellar mass. The authors report that r21 and r31 correlate positively with star-formation-related quantities but not with stellar mass, while r32 is largely flat except for tentative trends with surface-density quantities. They provide empirical prescriptions (Equations 6-9) for estimating CO(1-0) luminosities and molecular gas masses from CO(2-1) or CO(3-2), validate these against a broad literature compilation including local and high-redshift galaxies, and compare the observed ratios with molecular cloud models to infer a continuum of increasing gas density with increasing ΣSFR.
Significance. The empirical scaling relations and prescriptions are potentially valuable: they quantify how low-J CO excitation varies across the galaxy population and provide practical tools for converting CO(3-2) or CO(2-1) luminosities to CO(1-0)-based gas masses. The out-of-sample literature comparison, including ULIRGs and high-redshift galaxies, is a notable strength, as is the explicit testing of sample-selection effects against the larger Paper II sample. The paper also makes its data public via Zenodo and includes validated aperture corrections for at least one galaxy. The physical interpretation is presented with appropriate caveats about model degeneracies. However, the treatment of the 11 CO(3-2) upper limits in the r31 and r32 regression fits is not described, and this directly affects the headline r31 prescriptions. Because the censored measurements are likely concentrated at low SFR and low ΣSFR, the fitted slopes and intercepts may be biased. This issue must be resolved before the quantitative prescriptions can be considered reliable.
major comments (2)
- [Section 5 / Conclusions / Abstract] The manuscript reports that 11 of 47 galaxies have only CO(3-2) upper limits (Section 2) and Figure 4 plots these as gray downward triangles, but Section 4 does not state how upper limits enter the power-law regressions. The MCMC procedure described as 'allowing for uncertainty in both x and y' (Section 4) is not a censored-data method, and Table 1 gives no indication that the r31 and r32 fits use a survival analysis or any other treatment of non-detections. If the 11 upper limits are excluded, the fits are performed on a CO(3-2)-detected subsample that is likely biased toward high excitation at a given SFR or ΣSFR. This would bias the r31 slopes and intercepts and, in turn, the prescriptions in Equations 7 and 9, leading to overpredicted r31 and underestimated CO(1-0) luminosity and molecular gas mass when using CO(3-2) at low SFR/ΣSFR. I request a censored-data treatment, or at minimum a sensitivity test that demonstrates the results are unchanged when the limits are incorporated (e.g., by assigning upper-limit likelihoods or by trimming and recomputing).
- [Section 5 / Conclusions / Abstract] The abstract and Section 6 state that 'gas conditions in star forming and starburst galaxies lie on a continuum with increasing gas density in more actively star forming systems,' but the model comparison in Section 5 explicitly shows a strong degeneracy between mean density n0 and temperature Tk: the observed r21-r31 trends can be reproduced by a factor-of-ten increase in density at fixed temperature or by a temperature rise from 10 K to 30 K at fixed n0 ~ 10^3 cm^-3. The paper also notes in Appendix C that other parameter choices favor 'unexpectedly low densities or high temperatures.' Given this acknowledged degeneracy, the specific claim that the data demonstrate increasing gas density is stronger than the model analysis supports. I recommend either softening the conclusion to 'increasing density and/or temperature' or adding an observational or modeling argument that breaks the n0-Tk degeneracy at least statistically.
minor comments (5)
- [Abstract] The sentence 'We find systematic trend of higher gas excitation...' is missing an article and should read 'We find a systematic trend...'.
- [Section 2] There is a duplicate article in 'we assume a a flat ΛCDM cosmology'; one 'a' should be removed.
- [Section 4.2] The sentence 'In absence of noise we expect r32 = r31/r32' contains a typo; the ratio should be r32 = r31/r21.
- [Equations 6-9] The piecewise definitions in Equations 6-9 are typeset ambiguously; for example, Equation 7 reads '0.0 3 .2 < log SFR' and Equation 8 reads '0.0 0 .04 < log ΣSFR', which should include the word 'for' and explicit minus signs (e.g., '0.0 for -0.04 < log ΣSFR').
- [Section 1] The text 'parameterizations of the the CO(3-2)/CO(1-0)' has a duplicated 'the'.
Circularity Check
No material circularity: the r31 correlations and prescriptions are fit to AMISS data and validated on independent literature; only the reuse of the Paper II r21 relation is a self-citation, and it is checked against the present sample and external data.
full rationale
The paper's central r31 and r32 results are direct fits to the AMISS line-luminosity ratios (Eq. 2), and the prescriptions in Eqs. 7 and 9 are simply the Table 1 power-law fits converted into piecewise forms; nothing is fitted and then relabeled as a prediction. The r21 prescriptions (Eqs. 6 and 8) are imported from Paper II (Keenan et al. 2025), a self-citation, but Paper II used a larger sample and the present paper re-derives r21 in Table 1 and shows agreement (Fig. 4); the literature comparison in Section 4.2 is out-of-sample, and the fit to binned literature plus AMISS data reproduces the fiducial parameters, providing independent support. The identity r32 = r31/r21 is definitional but used only as a consistency check for the median r32 trend, and the AMISS r32 values are measured, not derived from the prescriptions. The physical-condition interpretation in Section 5 explicitly acknowledges that individual galaxies can be fit by many models and that the density continuum is an assumption, which is model dependence rather than circularity. The most substantive concern is statistical: 11 CO(3-2) upper limits enter the Section 4 regressions with no described censored-data treatment, which could bias the r31 slopes and prescriptions; this is a robustness/correctness issue, not an input-output circularity.
Assumptions & free parameters
free parameters (11)
- Power law slope m21,SFR =
0.14 ± 0.03
- Power law intercept b21,SFR =
-0.21 ± 0.02
- Power law slope m31,SFR =
0.15 ± 0.04
- Power law intercept b31,SFR =
-0.49 ± 0.03
- Power law slope m21,SigmaSFR =
0.08 ± 0.02 (AMISS), 0.10 (Eq. 8 from Paper II)
- Power law intercept b21,SigmaSFR =
-0.02 ± 0.03 (AMISS), 0.00 (Eq. 8)
- Power law slope m31,SigmaSFR =
0.16 ± 0.04
- Power law intercept b31,SigmaSFR =
-0.21 ± 0.05
- Intrinsic scatter s =
0.04 to 0.14 dex
- Cloud model column density per line width N/dv =
10^16.5 cm^-2 (km/s)^-1
- Cloud density distribution width sigma_n =
0.3 dex
assumptions (6)
- standard math Flat ΛCDM cosmology with H0=70 and Ωm=0.3
- domain assumption Chabrier (2003) stellar initial mass function for SFRs
- domain assumption Milky Way-like CO-to-H2 conversion factor αCO = 4.3 M⊙ (K km/s pc^2)^-1
- domain assumption Molecular cloud models with log-normal density distributions and RADEX non-LTE radiative transfer represent the galaxy ISM
- domain assumption Galaxy-averaged line ratios can be compared to single-cloud model tracks
- domain assumption Aperture corrections based on optical size models recover missing flux
Cite this review
Pith. "Pith review of The Arizona Molecular ISM Survey with the SMT: The Diverse Carbon Monoxide Line Ratios and Spectral Line Energy Distributions of Star Forming Galaxies." pith.science (2026). https://pith.science/paper/OBAQOA2Y
@misc{pith2026250718823,
  author       = {Pith},
  title        = {Pith review of: The Arizona Molecular ISM Survey with the SMT: The Diverse Carbon Monoxide Line Ratios and Spectral Line Energy Distributions of Star Forming Galaxies},
  year         = {2026},
  howpublished = {\url{https://pith.science/paper/OBAQOA2Y}},
  note         = {Machine review of arXiv:2507.18823}
}
abstract
The carbon monoxide (CO) spectral line energy distributions (SLEDs) of galaxies contain a wealth of information about conditions in their cold interstellar gas. Here we use galaxy-scale observations of the three lowest energy CO lines to determine SLEDs and line ratios in a sample of 47 nearby, predominantly star forming galaxies. We find systematic trend of higher gas excitation with increasing star formation rate (SFR) and SFR surface density ($\Sigma_{\rm SFR}$), with the range of variations being even larger than predicted by simulations. Power law fits of the CO line ratios as a function of SFR and $\Sigma_{\rm SFR}$ provide a good description of the trends seen in our sample and also accurately predict values for a wide range of galaxy types compiled from the literature. Based on these fits, we provide prescriptions for estimating CO(1-0) luminosities and molecular gas masses using CO(3-2) or CO(2-1) in cases where CO(1-0) is not observed directly. We compare our observed SLEDs with molecular cloud models in order to examine how the physical properties of cold gas vary across the galaxy population. We find that gas conditions in star forming and starburst galaxies lie on a continuum with increasing gas density in more actively star forming systems.
Figures


Figures from the paper (9 more)




Reference graph
Works this paper leans on
-
[1]
, " * write output.state after.block = add.period write newline
ENTRY address archivePrefix author booktitle chapter doi edition editor eprint howpublished institution journal key month note number organization pages publisher school series title misctitle type volume year version url label extra.label sort.label short.list INTEGERS output.state before.all mid.sentence after.sentence after.block FUNCTION init.state.co...
-
[2]
write newline
" write newline "" before.all 'output.state := FUNCTION format.doi doi empty "" "doi:" doi * if FUNCTION format.url url empty "" new.block "" url * "" * if FUNCTION format.eprint eprint empty "" archivePrefix empty "" archivePrefix ":" * if eprint field.or.null * if FUNCTION format.pid eprint empty format.doi format.eprint if FUNCTION n.dashify 't := "" t...
-
[3]
-9F"f 9- +Nc6 Hs] 3 up VgB?YbT`C
thebibliography [1] 20pt to REFERENCES 6pt =0pt 10pt plus 3pt =0pt =0pt =1pt plus 1pt =0pt =0pt -12pt =13pt plus 1pt =20pt =13pt plus 1pt \@M =10000 =-1.0em =0pt =0pt 0pt =0pt =1.0em @enumiv\@empty 10000 10000 `\.\@m \@noitemerr \@latex@warning Empty `thebibliography' environment \@ifnextchar \@reference \@latexerr Missing key on reference command Each re...
2017
-
[4]
Predicting the resolved CO emission of $z=1-3$ star-forming galaxies
Anirudh , R., Kaasinen , M., Popping , G., et al. 2025, arXiv e-prints, arXiv:2506.13899
work page Pith review arXiv 2025
- [5]
-
[6]
D., Wolfire , M., & Leroy , A
Bolatto , A. D., Wolfire , M., & Leroy , A. K. 2013, , 51, 207
2013
-
[7]
Bolatto , A. D., Warren , S. R., Leroy , A. K., et al. 2015, , 809, 175
work page 2015
-
[8]
A., van der Werf , P., Weiss , A., et al
Boogaard , L. A., van der Werf , P., Weiss , A., et al. 2020, , 902, 109
2020
Show all 72 references
-
[9]
2015, , 575, A56
Bournaud , F., Daddi , E., Wei , A., et al. 2015, , 575, A56
2015
-
[10]
2003, , 586, L133
Chabrier , G. 2003, , 586, L133
2003
-
[11]
2010, , 713, 686
Daddi , E., Bournaud , F., Walter , F., et al. 2010, , 713, 686
2010
-
[12]
2015, , 577, A46
Daddi , E., Dannerbauer , H., Liu , D., et al. 2015, , 577, A46
2015
-
[13]
K., Leroy , A
den Brok , J., Oakes , E. K., Leroy , A. K., et al. 2025, arXiv e-prints, arXiv:2506.09125
2025 arXiv
-
[14]
S., Chatzigiannakis , D., Bigiel , F., et al
den Brok , J. S., Chatzigiannakis , D., Bigiel , F., et al. 2021, , 504, 3221
2021
-
[15]
S., Leroy , A
den Brok , J. S., Leroy , A. K., Usero , A., et al. 2023, , 526, 6347
2023
-
[16]
2025, , 538, 2445
Deng , Y., Li , Z., Li , Z., et al. 2025, , 538, 2445
2025
-
[17]
2013, , 774, 68
D \' az-Santos , T., Armus , L., Charmandaris , V., et al. 2013, , 774, 68
2013
-
[18]
2017, , 846, 32
---. 2017, , 846, 32
2017
-
[19]
Downes , D., & Solomon , P. M. 1998, , 507, 615
1998
-
[20]
J., Papadopoulos , P
Dunne , L., Maddox , S. J., Papadopoulos , P. P., Ivison , R. J., & Gomez , H. L. 2022, , 517, 962
2022
-
[21]
2022, , 935, 64
Egusa , F., Gao , Y., Morokuma-Matsui , K., Liu , G., & Maeda , F. 2022, , 935, 64
2022
-
[22]
B., Bolatto , A
Fisher , D. B., Bolatto , A. D., White , H., et al. 2019, , 870, 46
2019
-
[23]
2023, , 945, 128
Frias Castillo , M., Hodge , J., Rybak , M., et al. 2023, , 945, 128
2023
-
[24]
Gao , Y., & Solomon , P. M. 2004, , 606, 271
2004
-
[25]
C., Kim , C.-G., & Kim , J.-G
Gong , M., Ostriker , E. C., Kim , C.-G., & Kim , J.-G. 2020, , 903, 142
2020
-
[26]
R., Leonidaki , I., Xilouris , E
Greve , T. R., Leonidaki , I., Xilouris , E. M., et al. 2014, , 794, 142
2014
-
[27]
C., Weiss , A., Yun , M
Harrington , K. C., Weiss , A., Yun , M. S., et al. 2021, , 908, 95
2021
-
[28]
W., Bovy , J., & Lang , D
Hogg , D. W., Bovy , J., & Lang , D. 2010, arXiv e-prints, arXiv:1008.4686
2010 arXiv
-
[29]
2017, , 466, 4795
Janowiecki , S., Catinella , B., Cortese , L., et al. 2017, , 466, 4795
2017
-
[30]
R., & Conley , A
Kamenetzky , J., Rangwala , N., Glenn , J., Maloney , P. R., & Conley , A. 2014, , 795, 174
2014
-
[31]
2016, , 829, 93
---. 2016, , 829, 93
2016
-
[32]
P., Marrone , D
Keenan , R. P., Marrone , D. P., & Keating , G. K. 2025, , 979, 228
2025
-
[33]
P., Marrone , D
Keenan , R. P., Marrone , D. P., Keating , G. K., et al. 2024, , 975, 150
2024
-
[34]
Kennicutt , Robert C., J., & De Los Reyes , M. A. C. 2021, , 908, 61
2021
-
[35]
C., & Evans , N
Kennicutt , R. C., & Evans , N. J. 2012, , 50, 531
2012
-
[36]
2025, arXiv e-prints, arXiv:2505.08876
Koda , J., Egusa , F., Hirota , A., et al. 2025, arXiv e-prints, arXiv:2505.08876
2025 arXiv
-
[37]
2007, , 59, 55
Komugi , S., Kohno , K., Tosaki , T., et al. 2007, , 59, 55
2007
-
[38]
2025, , 980, 126
Komugi , S., Sawada , T., Koda , J., et al. 2025, , 980, 126
2025
-
[39]
2020, , 889, 103
Lamperti , I., Saintonge , A., Koss , M., et al. 2020, , 889, 103
2020
-
[40]
D., Fisher , D
Lenki \'c , L., Bolatto , A. D., Fisher , D. B., et al. 2023, , 945, 9
2023
-
[41]
K., Usero , A., Schruba , A., et al
Leroy , A. K., Usero , A., Schruba , A., et al. 2017, , 835, 217
2017
-
[42]
K., Schinnerer , E., Hughes , A., et al
Leroy , A. K., Schinnerer , E., Hughes , A., et al. 2021, , 257, 43
2021
-
[43]
K., Rosolowsky , E., Usero , A., et al
Leroy , A. K., Rosolowsky , E., Usero , A., et al. 2022, , 927, 149
2022
-
[44]
Li , Z., Li , Z., Smith , M. W. L., et al. 2020, , 492, 195
2020
-
[45]
2015, , 810, L14
Liu , D., Gao , Y., Isaak , K., et al. 2015, , 810, L14
2015
-
[46]
2021, , 909, 56
Liu , D., Daddi , E., Schinnerer , E., et al. 2021, , 909, 56
2021
-
[47]
2022, , 926, 96
Maeda , F., Egusa , F., Ohta , K., et al. 2022, , 926, 96
2022
-
[48]
2010, , 724, 1336
Mao , R.-Q., Schulz , A., Henkel , C., et al. 2010, , 724, 1336
2010
-
[49]
E., Kohno , K., Tosaki , T., et al
Miura , R. E., Kohno , K., Tosaki , T., et al. 2014, , 788, 167
2014
-
[50]
2023, , 673, A13
Montoya Arroyave , I., Cicone , C., Makroleivaditi , E., et al. 2023, , 673, A13
2023
-
[51]
2017, , 837, 137
Morokuma-Matsui , K., & Muraoka , K. 2017, , 837, 137
2017
-
[52]
E., Kulesa , C
Narayanan , D., Groppi , C. E., Kulesa , C. A., & Walker , C. K. 2005, , 630, 269
2005
-
[53]
Narayanan , D., & Krumholz , M. R. 2014, , 442, 1411
2014
-
[54]
P., van der Werf , P
Papadopoulos , P. P., van der Werf , P. P., Xilouris , E. M., et al. 2012, , 426, 2601
2012
-
[55]
H., Clark , P
Pe \ n aloza , C. H., Clark , P. C., Glover , S. C. O., & Klessen , R. S. 2018, , 475, 1508
2018
-
[56]
H., Clark , P
Pe \ n aloza , C. H., Clark , P. C., Glover , S. C. O., Shetty , R., & Klessen , R. S. 2017, , 465, 2277
2017
-
[57]
A., Boogaard , L
Riechers , D. A., Boogaard , L. A., Decarli , R., et al. 2020, , 896, L21
2020
-
[58]
2022, , 60, 319
Saintonge , A., & Catinella , B. 2022, , 60, 319
2022
-
[59]
J., et al
Saintonge , A., Catinella , B., Tacconi , L. J., et al. 2017, , 233, 22
2017
-
[60]
C., Janowiecki , S., et al
Salim , S., Lee , J. C., Janowiecki , S., et al. 2016, , 227, 2
2016
-
[61]
T., Daddi , E., B \'e thermin , M., et al
Sargent , M. T., Daddi , E., B \'e thermin , M., et al. 2014, , 793, 19
2014
-
[62]
2001, , 136, 189
Sawada , T., Hasegawa , T., Handa , T., et al. 2001, , 136, 189
2001
-
[63]
Schinnerer , E., & Leroy , A. K. 2024, arXiv e-prints, arXiv:2403.19843
2024 arXiv
-
[64]
E., Riechers , D
Sharon , C. E., Riechers , D. A., Hodge , J., et al. 2016, , 827, 18
2016
-
[65]
S., Steinhardt , C
Speagle , J. S., Steinhardt , C. L., Capak , P. L., & Silverman , J. D. 2014, , 214, 15
2014
-
[66]
K., Schinnerer , E., et al
Sun , J., Leroy , A. K., Schinnerer , E., et al. 2020, , 901, L8
2020
-
[67]
J., Swinbank , A
Taylor , D. J., Swinbank , A. M., Smail , I., et al. 2025, , 536, 1149
2025
-
[68]
2020, , 641, A155
Valentino , F., Daddi , E., Puglisi , A., et al. 2020, , 641, A155
2020
-
[69]
van der Tak , F. F. S., Black , J. H., Sch \"o ier , F. L., Jansen , D. J., & van Dishoeck , E. F. 2007, , 468, 627
2007
-
[70]
Wei , A., Walter , F., & Scoville , N. Z. 2005, , 438, 533
2005
-
[71]
2021, , 73, 257
Yajima , Y., Sorai , K., Miyamoto , Y., et al. 2021, , 73, 257
2021
-
[72]
R., Kuno , N., & Dunne , L
Yao , L., Seaquist , E. R., Kuno , N., & Dunne , L. 2003, , 588, 771
2003
Reviewed August 6, 2026 · model on record in the stance chip above.
Discussion (0). Sign in to comment.