REVIEW 4 major objections 6 minor 86 references
Multi-band optical variability of the blazar OP 313 in the outburst state during 2024-2025
T0 review · 4 major / 6 minor · reviewed 2026-08-06 · deepseek-v4-flash
Pith's one-line read OP 313, a flat-spectrum radio quasar in outburst from November 2024 to May 2025, showed a bluer-when-brighter optical trend on short-term timescales, contrary to the redder-when-brighter behavior typical of its class.
desk verdict Useful multi-band dataset and robust IDV detections, but the headline BWB claim needs phase-resolved CMD fits before I'd trust it. read the letter →
The pith
A machine-rendered reading of the paper's core claim, the machinery that carries it, and where it could break.
The reading
What carries the argument
The load-bearing object is the color-magnitude diagram (CMD): each of six optical color indices is plotted against the magnitude of the reference band and fitted by a line $CI = m_2 \, m + c_2$, with a positive slope at $\ge 3\sigma$ and a significant positive correlation taken as the operational definition of bluer-when-brighter. To check spectral behavior, the paper builds optical SEDs for 30 nights from extinction-corrected BVRI fluxes, fits them with the power law $F_\nu \propto \nu^{-\alpha_o}$, and examines how $\alpha_o$ changes with R-band magnitude. Intraday variability is assessed with the power-enhanced F-test and the nested ANOVA test, both using field stars as references, and variability timescales are extracted from z-transformed discrete correlation functions with Monte Carlo significance levels.
What would settle it
Observe OP 313 with truly simultaneous multi-band photometry during an outburst and rebuild the color-magnitude diagrams; if the positive CMD slopes and the spectral-hardening correlation vanish or reverse, the BWB claim is an artifact of sequential band sampling. A shorter check is already embedded in the data: the paper's one quasi-simultaneous V/R night should reproduce the BWB sense on intraday timescales if the trend is intrinsic.
Extended reading notes
Core claim
The paper's central claim is that OP 313, historically classified as a flat-spectrum radio quasar, follows a bluer-when-brighter (BWB) trend on short-term variability timescales: as the source gets brighter, its optical color indices decrease and its power-law spectrum $F_\nu \propto \nu^{-\alpha_o}$ hardens. The evidence is the set of color-magnitude diagrams fitted with straight lines; all six color indices yield positive slopes ($m_2 \ge 3\sigma_{m_2}$) and moderate-to-strong Pearson correlations with magnitude, and $\alpha_o$ correlates with R-band magnitude with slope $0.249 \pm 0.040$ and $r_p = 0.758$. Over the whole campaign the brightness range was about 2.70, 2.35, 2.27, and 2.18 magnitudes in B, V, R, and I, and the weighted mean optical spectral index is quoted as $1.471 \pm 0.004$ in the abstract. This BWB result is presented as supporting the changing-look blazar scenario for the source, in which an intrinsic FSRQ appears as a BL Lac object during high flux states.
Load-bearing premise
The BWB result assumes the source did not change brightness between the sequential B, V, R, and I exposures that form each color index; if OP 313 varied significantly during a multi-band sequence, the measured colors and CMD slopes would be distorted.
Editorial extensions
If this is right
- If the BWB trend is real, OP 313's optical synchrotron component becomes harder and more energetic as it brightens, consistent with fresh injections of high-energy electrons rather than a stable disk simply diluting the jet emission.
- If the 137.9-minute timescale is genuine, the emitting region is no larger than roughly $(1.93\text{--}3.35) \times 10^{15}$ cm for the Doppler factors quoted from earlier SED modeling of the source.
- The measured duty cycle of about 34% (54.85% when the short April 3 night is excluded) means that OP 313 is frequently variable within a night during its active phase.
- The spectral index increased over the campaign with a slope of $0.003 \pm 0.001$ per day, so the spectrum steepened as the outburst decayed; this is the time-domain counterpart of the BWB behavior.
Reading between the lines
- Because the BVRI colors come from sequential exposures rather than simultaneous ones, the BWB conclusion would be put on firmer ground by a campaign with simultaneous or rapidly cycled multiband photometry; the paper's own quasi-simultaneous V/R run is the natural seed for such a test.
- If the changing-look interpretation is right, one testable prediction is that the synchrotron peak frequency of OP 313 should shift upward in bright states and downward in faint states within a single outburst, not just between historical epochs.
- The BWB/RWB dichotomy among FSRQs may be a continuum set by the jet-to-disk contrast ratio; OP 313 in outburst would then be the extreme case where the jet completely outshines the disk, while fainter FSRQ states should still show redder-when-brighter behavior.
Editorial analysis
A structured set of objections, weighed in public.
Referee Report
Summary. The paper presents an extensive BVRI photometric campaign of the blazar OP 313 (B2 1308+326) from November 2024 to April 2025, using two ARIES telescopes and supplemented by ATel magnitudes. The authors identify intraday variability in five of ten R-band nights using the power-enhanced F-test and nested ANOVA, measure a total short-term amplitude of about 2.2-2.7 mag depending on band, derive a variability timescale from ACF analysis and convert it into an upper limit on the emission-region size using a literature Doppler factor, fit nightly optical SEDs with a power law, and report that the source is bluer when brighter (BWB) on short-term timescales, in contrast to the usual FSRQ behavior. The paper interprets the BWB trend as supporting the changing-look blazar scenario proposed in earlier work.
Significance. The dataset is valuable: it provides dense R-band monitoring over seven months, uses two well-established statistical tests for IDV with full reporting of F-values and p-values, and includes 10000-simulation ACF significance testing. The use of an independent Doppler factor from Pandey et al. (2024) in the emission-region size estimate is appropriate and avoids circularity. If the BWB result is correct, it is astrophysically interesting because OP 313 is an FSRQ and the behavior would support a changing-look scenario. However, the headline BWB claim is not yet secured: the color-magnitude analysis is vulnerable to degeneracy between a secular reddening trend and the V-shaped brightness evolution, and the outlier-removal step in the correlation analysis is not reproducible. These issues are fixable with additional analysis, so the paper merits major revision rather than rejection.
major comments (4)
- [§4.3 and Table 4] The BWB conclusion rests on CMD slopes and CI-versus-magnitude correlations computed over the full campaign, yet Table 4 also shows that all six color indices increase significantly with MJD (rs = 0.420-0.578, ps ≤ 0.019), i.e., the source reddens over time. Because the R-band light curve is V-shaped (Fig. 1; §4.1.1), with the bright maximum near MJD 60714.9, a single linear fit to color versus magnitude can absorb the reddening-with-time trend and the two brightness phases into a spurious positive slope. The authors should fit the CMDs separately to the brightening branch (before MJD 60714.9) and the fading branch, or include MJD as a covariate, and report the phase-resolved slopes. Without this, the claimed BWB trend is not established.
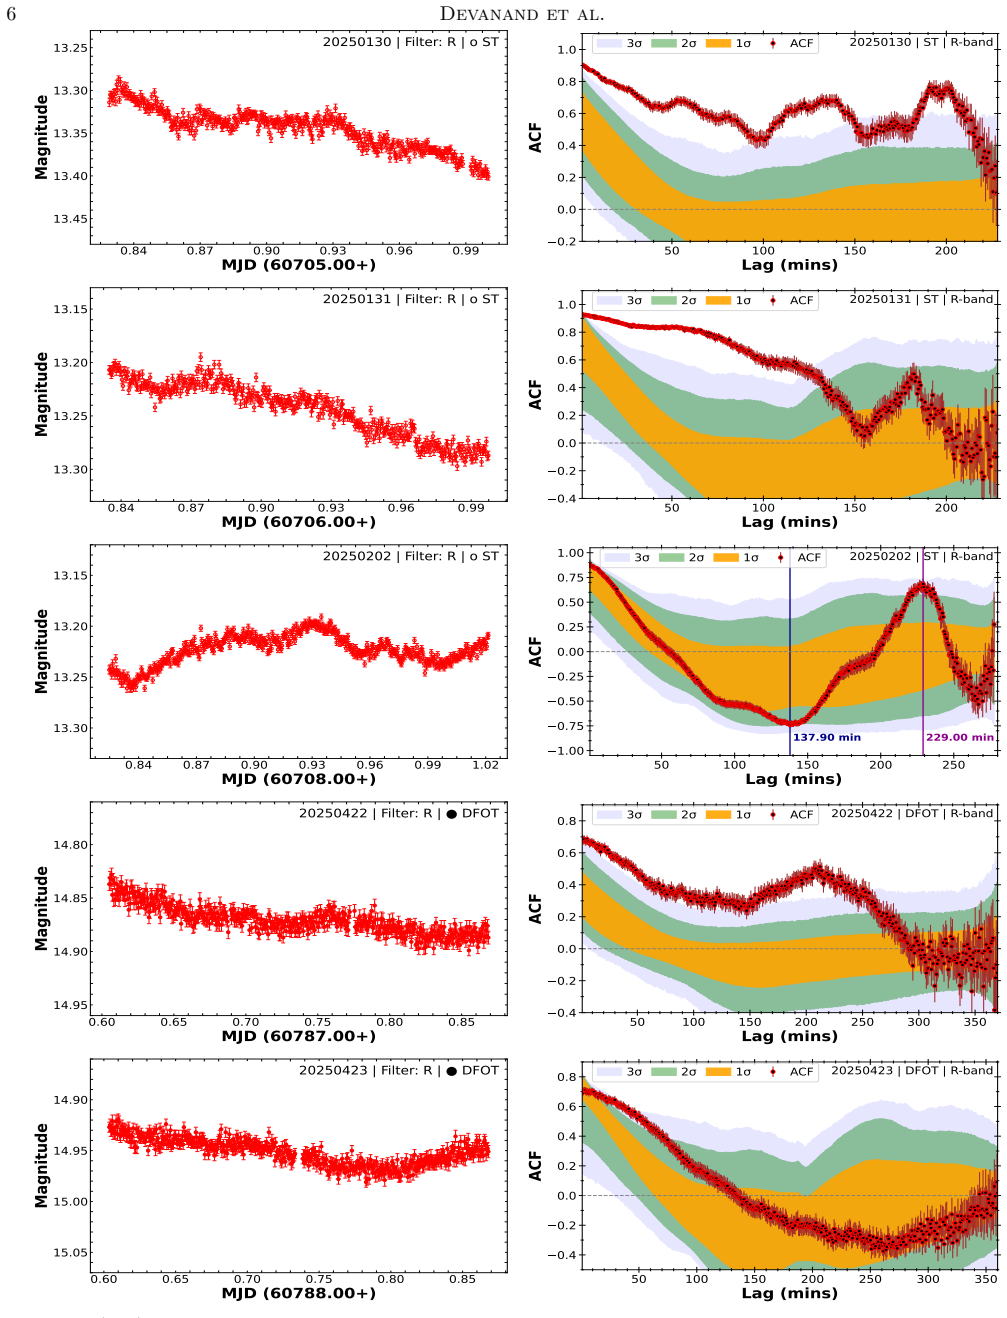
- [§4.1.2 and §5, Eq. (14)] The variability timescale of 137.90 min used to derive the emission-region size is attributed in the text to the night of Apr 02, 2025, but Table 2 classifies Apr 02 as non-variable in R (power-enhanced F-test: Fenh = 0.15, p = 1.00; nested ANOVA: F = 1.65, p = 0.085), and Figure 2 shows the significant ACF features on the 2025 Feb 02 panel instead. The authors should correct this attribution and re-derive the size upper limit from a night that passes both IDV tests, or explicitly justify why a formally non-variable segment can still yield a variability timescale.
- [§4.3] The statement 'we removed the outliers, which are far from being the best fit' is not reproducible. No objective criterion is given for defining an outlier (e.g., a sigma-clipping threshold, the number of points removed, or whether the removal was iterative), and the reported Pearson correlations and slopes in Table 4 depend on this step. The authors should specify the outlier-removal procedure or report the results without removal so that the correlation coefficients and slopes can be verified.
- [§2.1 and §4.3] Each nightly color index is formed from B, V, R, and I exposures taken sequentially rather than simultaneously, as acknowledged in §2.1 ('On most nights, we tried to attain at least one frame of the source in B, V, R, and I bands'). If the source varied between the first and last exposures of a sequence, the color indices and therefore the CMD slopes could be systematically distorted. The paper should report the typical time interval between the first and last band exposures on each night and test the robustness of the BWB slopes using only quasi-simultaneous ATel points or by modeling the time offsets.
minor comments (6)
- [Abstract and §4.2] The weighted-mean optical spectral index is given as 1.471 ± 0.004 in the abstract but as 1.467 ± 0.004 in §4.2; please reconcile the two values.
- [§2.1] There is a typo in the sentence about seeing: 'Telescope A has lower effective area compared to B, it generates nominally images with low FWHM sources, i.e., better seeing than A' should read 'better seeing than B'.
- [§4.1.2 and Figure 2] The text says the significant ACF dip is for 'Apr 02, 2025,' whereas the corresponding panel in Figure 2 is labeled 20250202; the date should be corrected consistently throughout the discussion.
- [Table 2] The notation '<< 0.001' for very small p-values is used only in some rows; for consistency, please replace it with a numerical upper limit (e.g., p < 10^-6) or define the notation prominently in the table note.
- [§3.4, Eq. (13)] The quantity Δt_i in Eq. (13) is not defined before first use; please define it explicitly as the observing duration and state that the redshift-corrected value is used.
- [Figure 1] The caption states that vertical offsets are applied but does not give their values; listing the offsets for each magnitude and color curve would improve readability.
Circularity Check
No significant circularity: the BWB trend is a directly measured correlation, not a fitted input disguised as a prediction.
full rationale
No circular step is present. The paper's central claim, that OP 313 shows a bluer-when-brighter (BWB) trend on short-term timescales, is a directly measured correlation between color indices and magnitudes (Table 4 and Fig. 4b) and between optical spectral index and R-band magnitude (Fig. 4a). These are descriptive fits to observed photometry, not predictions derived from the same parameters that define the claim. The BWB label is the standard empirical definition of a positive color-magnitude slope, so the interpretation does not smuggle the conclusion into the input. The emission-region size uses a Doppler factor taken from Pandey et al. 2024, an externally published value, and the agreement with Pandey et al. 2025 is used as corroboration rather than as the proof of the color trend. The non-simultaneity of the BVRI exposures and the possibility that a reddening-with-time trend combined with a V-shaped light curve distorts the CMD slope (Table 4 reports significantly positive CI-versus-MJD Spearman correlations) are legitimate data-analysis and interpretation risks, but they are correctness risks, not circularity: no equation or fitted parameter in the paper reduces to the target result by construction. The paper is an observational study whose main results are measured correlations, and it does not rely on a self-citation chain to force its conclusions.
Assumptions & free parameters
free parameters (2)
- Outlier rejection threshold in CMD fits =
not specified; 'outliers far from best fit' removed
- Cmd slope m2 for each color index =
e.g., B-V vs V: 0.057 ± 0.012; B-I vs I: 0.178 ± 0.029
assumptions (3)
- domain assumption The comparison stars used for differential photometry are non-variable.
- domain assumption The source redshift z = 0.9980 and Doppler factor range δ = 15.61-26.97 from Pandey et al. 2024 are correct.
- domain assumption The ACF dip at 137.9 min represents a genuine variability timescale.
Cite this review
Pith. "Pith review of Multi-band optical variability of the blazar OP 313 in the outburst state during 2024-2025." pith.science (2026). https://pith.science/paper/5UCGFZEI
@misc{pith2026250720223,
  author       = {Pith},
  title        = {Pith review of: Multi-band optical variability of the blazar OP 313 in the outburst state during 2024-2025},
  year         = {2026},
  howpublished = {\url{https://pith.science/paper/5UCGFZEI}},
  note         = {Machine review of arXiv:2507.20223}
}
abstract
We present the analysis results of flux and spectral variability of the blazar OP 313 across intra-night to short-term timescales using BVRI photometric data, gathered over 25 nights from Nov 2024 to May 2025, using two optical telescopes in ARIES, India. The source was in an outburst state during this period. We searched for intraday variations (IDV), using two powerful statistical tests: the Power Enhanced F-test and the Nested ANOVA test. The source displayed IDV in the R band for five of the ten nights, yielding a duty cycle of 34$\%$. During the entire monitoring of the source, it showed variations of over two mag in all B, V, R, and I data bands. We obtained a variability timescale for a variable light curve, giving us an upper limit for the size of the emission region. We generated optical SEDs of the blazar for these 25 nights, fitted a power law of form $(F_\nu \propto \nu^{-\alpha_{o}})$ and found the weighted mean spectral index to be 1.471$\pm$0.004. An analysis of the color-magnitude diagram shows that, contrary to the redder-when-brighter (RWB) trend typically observed in FSRQs, this source exhibits a bluer-when-brighter (BWB) trend on short-term variability (STV) timescales - a behavior more commonly associated with BL Lac object. We explore potential physical mechanisms responsible for the observed spectral variability.
Figures


Figures from the paper (1 more)

Reference graph
Works this paper leans on
-
[1]
A., Ackermann, M., Agudo, I., et al
Abdo, A. A., Ackermann, M., Agudo, I., et al. 2010, ApJ, 716, 30, doi: 10.1088/0004-637X/716/1/30
-
[2]
Agarwal, A., & Gupta, A. C. 2015, MNRAS, 450, 541, doi: 10.1093/mnras/stv625
-
[3]
Agarwal, A., Gupta, A. C., Bachev, R., et al. 2016, MNRAS, 455, 680, doi: 10.1093/mnras/stv2345
-
[4]
Alexander, T. 2013, arXiv e-prints, arXiv:1302.1508, doi: 10.48550/arXiv.1302.1508 Multi-band optical variability of OP 313 17
-
[5]
Angel, J. R. P., & Stockman, H. S. 1980, ARA&A, 18, 321, doi: 10.1146/annurev.aa.18.090180.001541
arXiv 1980
-
[6]
Bachev, R., Tripathi, T., Gupta, A. C., et al. 2023, MNRAS, 522, 3018, doi: 10.1093/mnras/stad1063
-
[7]
S., Castelli, F., & Plez, B
Bessell, M. S., Castelli, F., & Plez, B. 1998, A&A, 333, 231
1998
-
[8]
Blandford, R. D., & Rees, M. J. 1978, PhyS, 17, 265, doi: 10.1088/0031-8949/17/3/020 B¨ ottcher, M. 2007, Ap&SS, 309, 95, doi: 10.1007/s10509-007-9404-0 B¨ ottcher, M., Fultz, K., Aller, H. D., et al. 2009, ApJ, 694, 174, doi: 10.1088/0004-637X/694/1/174
Show all 86 references
-
[9]
J., Steffen, W., et al
Britzen, S., Qian, S. J., Steffen, W., et al. 2017, A&A, 602, A29, doi: 10.1051/0004-6361/201629999
2017 doi
-
[10]
K., & Wiita, P
Chakrabarti, S. K., & Wiita, P. J. 1993, ApJ, 411, 602, doi: 10.1086/172862 de Diego, J. A. 2010, AJ, 139, 1269, doi: 10.1088/0004-6256/139/3/1269 de Diego, J. A. 2014, AJ, 148, 93, doi: 10.1088/0004-6256/148/5/93 de Diego, J. A., Dultzin-Hacyan, D., Ram ´ ırez, A., & Ben ´ ıt...
1993 doi
-
[11]
C., Kurtanidze, S
Dhiman, V., Gupta, A. C., Kurtanidze, S. O., et al. 2023, MNRAS, 519, 2796, doi: 10.1093/mnras/stac3709
2023 doi
-
[12]
C., Bachev, R., et al
Dhiman, V., Gupta, A. C., Bachev, R., et al. 2024, MNRAS, 527, 1344, doi: 10.1093/mnras/stad3232
2024 doi
-
[13]
C., Raiteri, C
Dogra, K., Gupta, A. C., Raiteri, C. M., et al. 2025, ApJS, 276, 1, doi: 10.3847/1538-4365/ad8e3d
2025 doi
- [14]
-
[15]
M., & Papadakis, I
Emmanoulopoulos, D., McHardy, I. M., & Papadakis, I. E. 2013, MNRAS, 433, 907, doi: 10.1093/mnras/stt764
2013 doi
-
[16]
1998, PASP, 110, 105, doi: 10.1086/316127
Fiorucci, M., Tosti, G., & Rizzi, N. 1998, PASP, 110, 105, doi: 10.1086/316127
1998 doi
-
[18]
1996, AJ, 112, 1709, doi: 10.1086/118137
Foster, G. 1996, AJ, 112, 1709, doi: 10.1086/118137
1996 doi
-
[19]
Wardle, J. F. C. 1993, ApJ, 410, 39, doi: 10.1086/172722
1993 doi
-
[20]
C., & Wiita, P
Gaur, H., Gupta, A. C., & Wiita, P. J. 2012a, AJ, 143, 23, doi: 10.1088/0004-6256/143/1/23
-
[22]
C., Bachev, R., et al
Gaur, H., Gupta, A. C., Bachev, R., et al. 2015, MNRAS, 452, 4263, doi: 10.1093/mnras/stv1556
2015 doi
- [23]
-
[24]
Gopal-Krishna, Sagar, R., & Wiita, P. J. 1993, MNRAS, 262, 963, doi: 10.1093/mnras/262.4.963 Gopal-Krishna, & Wiita, P. J. 1992, A&A, 259, 109
1993 doi
-
[25]
F., Lee, C
Gu, M. F., Lee, C. U., Pak, S., Yim, H. S., & Fletcher, A. B. 2006, A&A, 450, 39, doi: 10.1051/0004-6361:20054271
2006 doi
-
[26]
C., Banerjee, D
Gupta, A. C., Banerjee, D. P. K., Ashok, N. M., & Joshi, U. C. 2004, A&A, 422, 505, doi: 10.1051/0004-6361:20040306
2004 doi
-
[27]
C., Agarwal, A., Bhagwan, J., et al
Gupta, A. C., Agarwal, A., Bhagwan, J., et al. 2016, MNRAS, 458, 1127, doi: 10.1093/mnras/stw377
2016 doi
-
[28]
C., Mangalam, A., Wiita, P
Gupta, A. C., Mangalam, A., Wiita, P. J., et al. 2017, MNRAS, 472, 788, doi: 10.1093/mnras/stx2072
2017 doi
-
[29]
C., Kushwaha, P., Valtonen, M
Gupta, A. C., Kushwaha, P., Valtonen, M. J., et al. 2023, ApJL, 957, L11, doi: 10.3847/2041-8213/acfd2e
2023 doi
- [30]
-
[31]
C., & Wild, V
Hewett, P. C., & Wild, V. 2010, MNRAS, 405, 2302, doi: 10.1111/j.1365-2966.2010.16648.x
2010
-
[32]
M., Zhao, G., Guo, H
Hu, S. M., Zhao, G., Guo, H. Y., Zhang, X., & Zheng, Y. G. 2006, MNRAS, 371, 1243, doi: 10.1111/j.1365-2966.2006.10721.x
2006
-
[33]
R., & Bregman, J
Hufnagel, B. R., & Bregman, J. N. 1992, ApJ, 386, 473, doi: 10.1086/171033
1992 doi
-
[34]
C., Urry, C
Isler, J. C., Urry, C. M., Coppi, P., et al. 2017, ApJ, 844, 107, doi: 10.3847/1538-4357/aa79fc
2017 doi
-
[35]
2022,, v1.0.0 Zenodo, doi: 10.5281/zenodo.7253034
Nikutta, R. 2022,, v1.0.0 Zenodo, doi: 10.5281/zenodo.7253034
2022 doi
-
[36]
C., Bangia, T., Jaiswar, M
Joshi, Y. C., Bangia, T., Jaiswar, M. K., et al. 2022, Journal of Astronomical Instrumentation, 11, 2240004, doi: 10.1142/S2251171722400049
2022 doi
-
[37]
2023, ApJ, 943, 135, doi: 10.3847/1538-4357/aca801
Kalita, N., Yuan, Y., Gu, M., et al. 2023, ApJ, 943, 135, doi: 10.3847/1538-4357/aca801
2023 doi
- [38]
-
[39]
C., & Wiita, P
Kishore, S., Gupta, A. C., & Wiita, P. J. 2023, ApJ, 943, 53, doi: 10.3847/1538-4357/aca809
2023 doi
-
[40]
Krishnan, V., & Wiita, P. J. 1990, MNRAS, 246, 597
1990
-
[41]
K., Paliya, V
Kshama, S. K., Paliya, V. S., & Stalin, C. S. 2017, MNRAS, 466, 2679, doi: 10.1093/mnras/stw3317
2017 doi
-
[42]
1992, A&A, 254, 29
Lesch, H., & Pohl, M. 1992, A&A, 254, 29
1992
-
[43]
Lomb, N. R. 1976, Ap&SS, 39, 447, doi: 10.1007/BF00648343 MAGIC Collaboration, Abe, H., Abe, S., et al. 2024, MNRAS, 529, 3894, doi: 10.1093/mnras/stae649 18 Devanand et al
1976 doi
- [44]
-
[45]
Smith, P. S. 1996, MNRAS, 281, 425, doi: 10.1093/mnras/281.2.425
1996 doi
- [46]
-
[47]
1998, MNRAS, 299, 47, doi: 10.1046/j.1365-8711.1998.01696.x
Massaro, E., Nesci, R., Maesano, M., Montagni, F., & D’Alessio, F. 1998, MNRAS, 299, 47, doi: 10.1046/j.1365-8711.1998.01696.x
1998
-
[48]
Mastichiadis, A., & Kirk, J. G. 2002, PASA, 19, 138, doi: 10.1071/AS01108
2002 doi
-
[49]
R., Carini, M
Miller, H. R., Carini, M. T., & Goodrich, B. D. 1989, Nature, 337, 627, doi: 10.1038/337627a0 M¨ ucke, A., Protheroe, R. J., Engel, R., Rachen, J. P., &
1989 doi
-
[50]
2003, Astroparticle Physics, 18, 593, doi: 10.1016/S0927-6505(02)00185-8
Stanev, T. 2003, Astroparticle Physics, 18, 593, doi: 10.1016/S0927-6505(02)00185-8
2003 doi
-
[51]
P., Gaur, H., Gupta, A
Noel, A. P., Gaur, H., Gupta, A. C., et al. 2022, ApJS, 262, 4, doi: 10.3847/1538-4365/ac7799
2022 doi
-
[52]
A., et al
Otero-Santos, J., Bonnoli, G., Acosta-Pulido, J. A., et al. 2025, The Astronomer’s Telegram, 16979, 1
2025
-
[53]
C., Damljanovic, G., et al
Pandey, A., Gupta, A. C., Damljanovic, G., et al. 2020, MNRAS, 496, 1430, doi: 10.1093/mnras/staa1598
2020 doi
-
[54]
C., & Wiita, P
Pandey, A., Gupta, A. C., & Wiita, P. J. 2017, ApJ, 841, 123, doi: 10.3847/1538-4357/aa705e
2017 doi
-
[55]
C., Wiita, P
Pandey, A., Gupta, A. C., Wiita, P. J., & Tiwari, S. N. 2019, ApJ, 871, 192, doi: 10.3847/1538-4357/aaf974
2019 doi
-
[56]
J., et al
Pandey, A., Kushwaha, P., Wiita, P. J., et al. 2024, A&A, 681, A116, doi: 10.1051/0004-6361/202347719
2024 doi
-
[57]
2025, ApJ, 978, 120, doi: 10.3847/1538-4357/ad9b7c
Pandey, A., Hu, C., Wang, J.-M., et al. 2025, ApJ, 978, 120, doi: 10.3847/1538-4357/ad9b7c
2025 doi
-
[58]
A., et al
Polednikova, J., Ederoclite, A., de Diego, J. A., et al. 2016, MNRAS, 460, 3950, doi: 10.1093/mnras/stw1252
2016 doi
-
[59]
H., & Fu, J
Poon, H., Fan, J. H., & Fu, J. N. 2009, ApJS, 185, 511, doi: 10.1088/0067-0049/185/2/511
2009 doi
-
[60]
M., Villata, M., Acosta-Pulido, J
Raiteri, C. M., Villata, M., Acosta-Pulido, J. A., et al. 2017, Nature, 552, 374, doi: 10.1038/nature24623
2017 doi
-
[61]
M., Villata, M., Carnerero, M
Raiteri, C. M., Villata, M., Carnerero, M. I., et al. 2023, MNRAS, 526, 4502, doi: 10.1093/mnras/stad3064
2023 doi
-
[62]
C., Joshi, U
Rani, B., Gupta, A. C., Joshi, U. C., Ganesh, S., & Wiita, P. J. 2011, MNRAS, 413, 2157, doi: 10.1111/j.1365-2966.2011.18288.x
2011
-
[63]
Rees, M. J. 1984, ARA&A, 22, 471, doi: 10.1146/annurev.aa.22.090184.002351
1984
-
[64]
E., Cellone, S
Romero, G. E., Cellone, S. A., & Combi, J. A. 1999, A&AS, 135, 477, doi: 10.1051/aas:1999184
1999 doi
-
[65]
Sagar, R., Gopal-Krishna, & Wiita, P. J. 1996, MNRAS, 281, 1267, doi: 10.1093/mnras/281.4.1267
1996 doi
-
[66]
Shishkina, E. V. 2025, The Astronomer’s Telegram, 17046, 1
2025
-
[67]
Scargle, J. D. 1982, ApJ, 263, 835, doi: 10.1086/160554
1982 doi
-
[68]
Singal, A. K. 2016, ApJ, 827, 66, doi: 10.3847/0004-637X/827/1/66
2016 doi
-
[69]
Schmidt, G. D. 1985, AJ, 90, 1184, doi: 10.1086/113824
1985 doi
-
[70]
2001, MNRAS, 325, 1559, doi: 10.1046/j.1365-8711.2001.04557.x
Spada, M., Ghisellini, G., Lazzati, D., & Celotti, A. 2001, MNRAS, 325, 1559, doi: 10.1046/j.1365-8711.2001.04557.x
2001
-
[71]
S., Gopal-Krishna, Sagar, R., & Wiita, P
Stalin, C. S., Gopal-Krishna, Sagar, R., & Wiita, P. J. 2004, MNRAS, 350, 175, doi: 10.1111/j.1365-2966.2004.07631.x
2004
-
[72]
Stetson, P. B. 1987, PASP, 99, 191, doi: 10.1086/131977
1987 doi
-
[73]
Stetson, P. B. 1992, in Astronomical Society of the Pacific Conference Series, Vol. 25, Astronomical Data Analysis Software and Systems I, ed. D. M. Worrall, C. Biemesderfer, & J. Barnes, 297
1992
-
[74]
1991, ApJ, 374, 431, doi: 10.1086/170133
Kuehr, H. 1991, ApJ, 374, 431, doi: 10.1086/170133
1991 doi
-
[75]
T., Morris, S
Stocke, J. T., Morris, S. L., Gioia, I. M., et al. 1991, ApJS, 76, 813, doi: 10.1086/191582
1991 doi
-
[76]
1986, in Society of Photo-Optical Instrumentation Engineers (SPIE) Conference Series, Vol
Tody, D. 1986, in Society of Photo-Optical Instrumentation Engineers (SPIE) Conference Series, Vol. 627, Instrumentation in astronomy VI, ed. D. L. Crawford, 733, doi: 10.1117/12.968154
1986 doi
-
[77]
1993, in Astronomical Society of the Pacific Conference Series, Vol
Tody, D. 1993, in Astronomical Society of the Pacific Conference Series, Vol. 52, Astronomical Data Analysis Software and Systems II, ed. R. J. Hanisch, R. J. V. Brissenden, & J. Barnes, 173
1993
-
[78]
C., Takey, A., et al
Tripathi, T., Gupta, A. C., Takey, A., et al. 2024, MNRAS, 527, 5220, doi: 10.1093/mnras/stad3574
2024 doi
- [79]
-
[80]
Villata, M., & Raiteri, C. M. 1999, A&A, 347, 30
1999
-
[81]
M., Balonek, T
Villata, M., Raiteri, C. M., Balonek, T. J., et al. 2006, A&A, 453, 817, doi: 10.1051/0004-6361:20064817
2006 doi
-
[82]
V., Spiridonova, O
Vlasyuk, V. V., Spiridonova, O. I., & Moskvitin, A. S. 2024, The Astronomer’s Telegram, 16963, 1
2024
-
[84]
J., & Witzel, A
Wagner, S. J., & Witzel, A. 1995b, ARA&A, 33, 163, doi: 10.1146/annurev.aa.33.090195.001115
- [85]
-
[86]
2015, A&A, 573, A69, doi: 10.1051/0004-6361/201423967
Wierzcholska, A., Ostrowski, M., Stawarz, L., Wagner, S., & Hauser, M. 2015, A&A, 573, A69, doi: 10.1051/0004-6361/201423967
2015 doi
-
[87]
J., Mangalam, A
Wiita, P. J., Mangalam, A. V., & Chakrabarti, S. K. 1992, in American Institute of Physics Conference Series, Vol. 254, Testing the AGN paradigm, ed. S. S. Holt, S. G. Neff, & C. M. Urry (AIP), 251–254, doi: 10.1063/1.42190
1992 doi
- [88]
-
[89]
Yadav, R. K. S., Jaiswal, A., Dattatrey, A. K., et al. 2022, Journal of Astronomical Instrumentation, 11, 2240006, doi: 10.1142/S2251171722400062
2022 doi
Reviewed August 6, 2026 · model on record in the stance chip above.
Discussion (0). Continue with ORCID to comment.