REVIEW 4 major objections 5 minor 54 references
On the interplay between plasma triangularity and micro-tearing turbulence
T0 review · 4 major / 5 minor · reviewed 2026-08-06 · deepseek-v4-flash
Pith's one-line read Negative triangularity makes micro-tearing modes stronger, and when those modes dominate, heat transport is several times worse than in positive triangularity.
desk verdict Multi-machine evidence that negative triangularity destabilizes micro-tearing modes via faster average magnetic drifts, but the overbroad regime-map claim needs a nonlinear caveat before it is fully convincing. read the letter →
The pith
A machine-rendered reading of the paper's core claim, the machinery that carries it, and where it could break.
The reading
What carries the argument
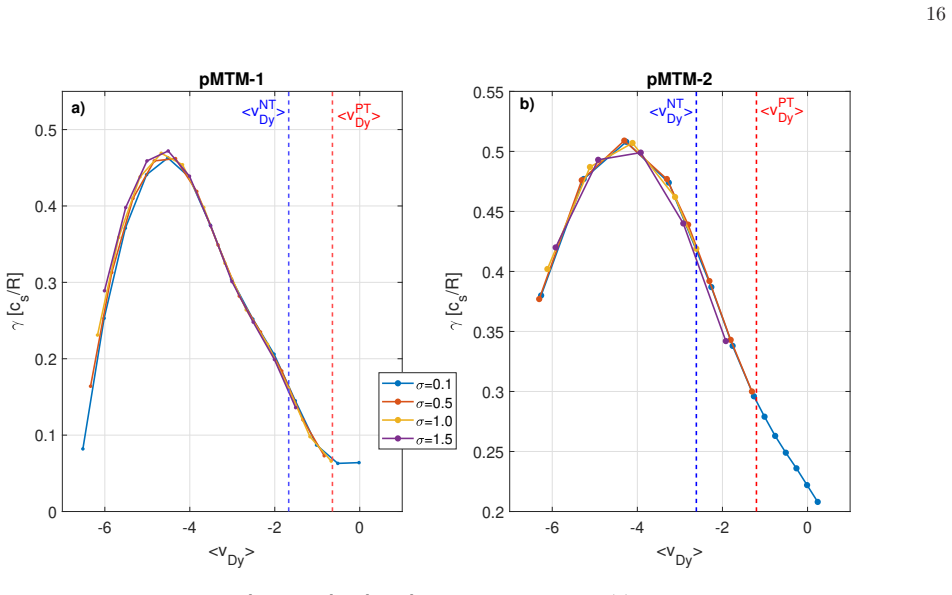
The load-bearing object is the micro-tearing mode (MTM), an electromagnetic micro-instability that creates thin current layers, shears the magnetic field, and forms gyroradius-scale magnetic islands whose overlap stochastizes field lines and lets electrons escape radially. The comparative argument runs through the poloidally averaged binormal magnetic drift velocity $\langle v_{Dy}\rangle = \int J v_{Dy}\,dz / \int J\,dz$, which is faster in NT than in PT; linear scans in which the drift profile is artificially rescaled or shifted show that MTM growth rates track $\langle v_{Dy}\rangle$ rather than the profile shape, and nonlinear simulations in which NT drifts are imposed on PT geometry recover the NT-level electromagnetic heat flux. Mode identity is established with the parity of the parallel vector potential $P(A_\parallel)$: $P(A_\parallel)<1$ and negative real frequency identify an MTM, separating it from ITG and TEM. A local analytic equilibrium parametrization is used to flip triangularity $\delta$ and its shear $s_\delta$ while holding all other profiles fixed, isolating geometry as the variable.
What would settle it
A concrete check is to run a well-resolved nonlinear flux-tube simulation at a parameter point where the linear maps predict NT MTM dominance but where no nonlinear run has been done — for example, NT SMART with $\beta$ between $0.3\%$ and $0.6\%$ and $\omega_{T_e}/\omega_{T_i}>1$ — and observe whether the saturated electromagnetic electron heat flux actually exceeds the electrostatic ion heat flux. A second, experimental falsifier would be to measure the electron temperature gradient and confinement in an NT spherical tokamak as $\beta$ is raised toward the predicted onset: if the temperature profile stiffens and confinement degrades relative to PT, the regime is real; if it does not, the linear-to-nonlinear mapping used for the onset boundaries is wrong.
Extended reading notes
Core claim
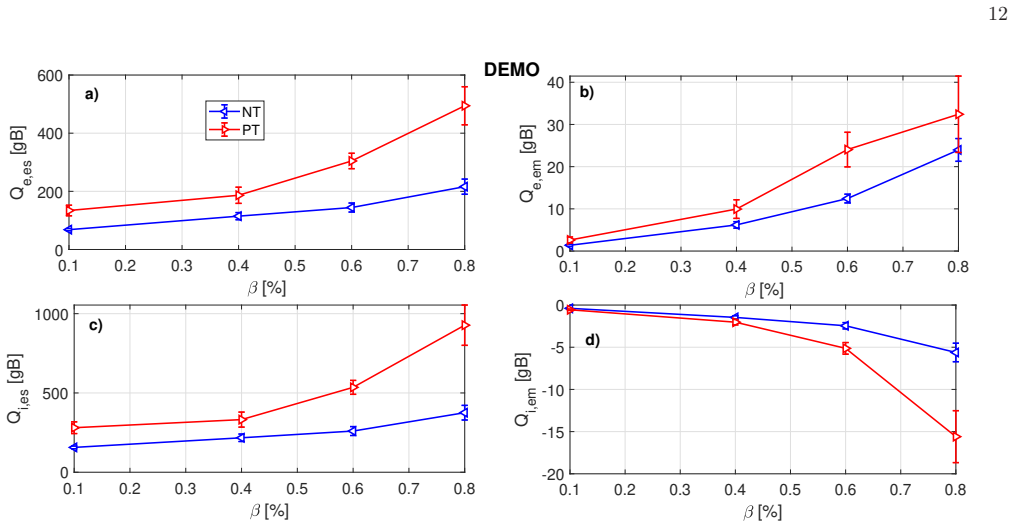
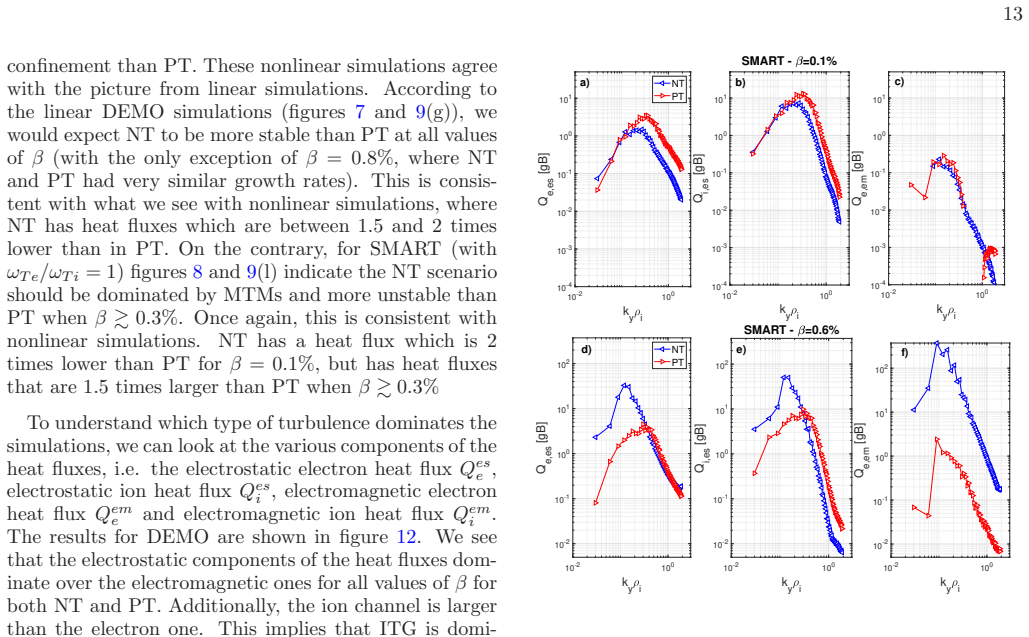
On the paper's own terms, the central discovery is that negative triangularity is more susceptible to micro-tearing modes than positive triangularity, and that when MTMs are present they make transport much worse in NT. The claim is supported by a coherent multi-machine picture: at sufficiently large plasma pressure $\beta$, magnetic shear $\hat{s}$, and electron-to-ion temperature gradient ratio $R/L_{T_e} / R/L_{T_i}$, every NT scenario in the study becomes MTM-dominated, while the corresponding PT scenario remains dominated by electrostatic ITG or TEM turbulence. The qualitative explanation is that the magnetic drifts are faster in NT geometry, measured through the poloidally averaged binormal magnetic drift velocity $\langle v_{Dy}\rangle$, and faster drifts make MTMs more unstable. Nonlinear simulations confirm the ordering in the spherical-tokamak case: NT SMART has heat fluxes about 1.5 times larger than PT once $\beta \gtrsim 0.3\%$, with a strong electromagnetic electron heat flux and strongly diffusing magnetic field lines. The paper also notes one place where linear extrapolation fails: for NT DEMO at $\beta \sim 0.6$–$0.8\%$, linear MTMs exist but nonlinear transport remains ITG-dominated.
Load-bearing premise
The load-bearing premise is that linear MTM dominance at a single wavenumber, $k_y\rho_i=0.2$, can be used to map out where turbulence will be MTM-dominated; the paper itself reports one nonlinear case (NT DEMO at $\beta\simeq0.6$–$0.8\%$) where this fails, so the regime boundaries inherit that uncertainty.
Editorial extensions
If this is right
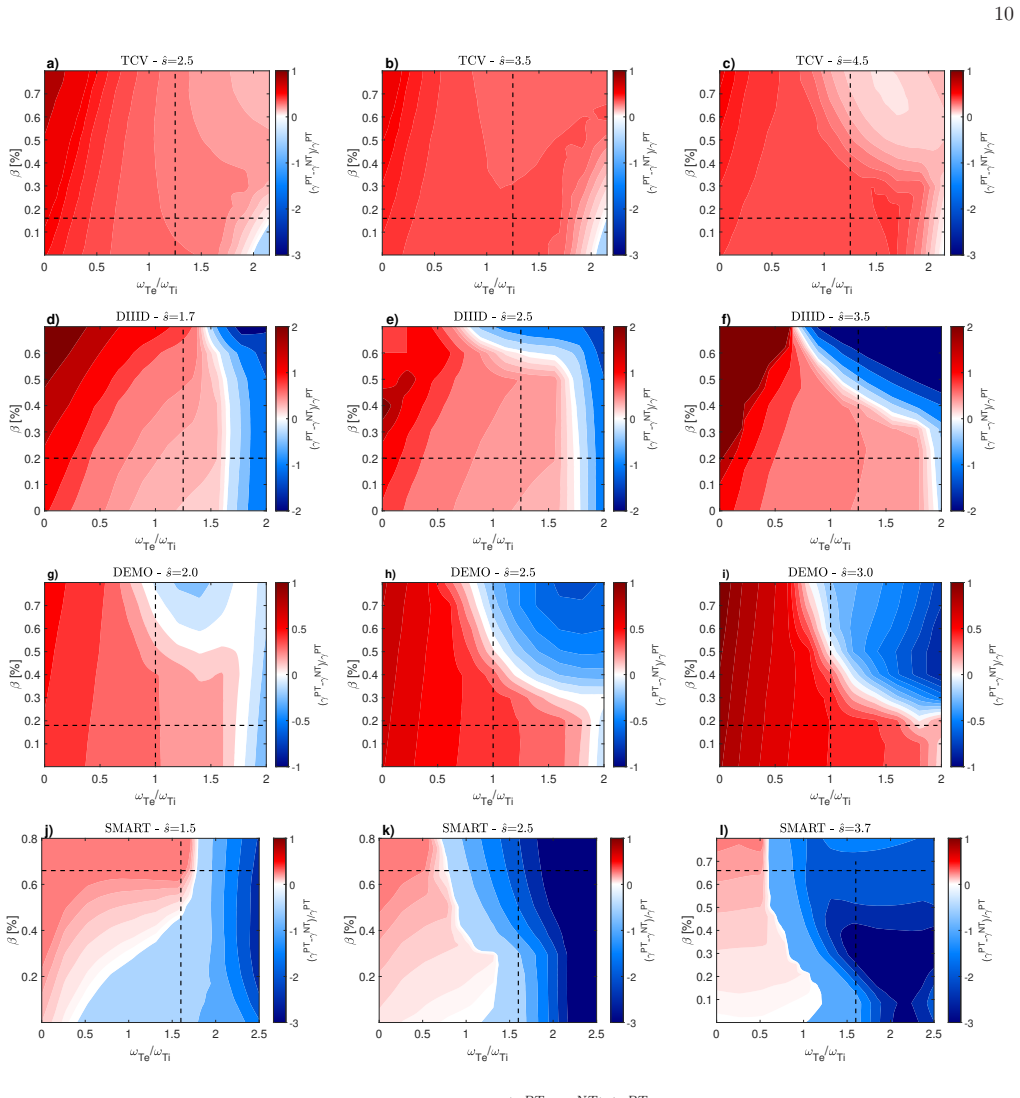
- Conventional-aspect-ratio tokamaks (TCV, DIII-D, DEMO at their nominal parameters) keep the NT transport benefit, because their local $\beta$ is too low to enter the MTM-dominated window identified here ($\hat{s} \gtrsim 2.5$, $\beta \gtrsim 0.3\%$, $R/L_{T_e}/R/L_{T_i}>1$).
- Spherical tokamaks such as SMART and MAST-U operate near that window, so NT shaping there can degrade rather than improve confinement; lowering magnetic shear (for instance by avoiding double-null configurations) or steepening the density gradient is predicted to suppress MTMs and restore the NT benefit.
- When MTMs dominate, the electron electromagnetic heat flux becomes the main loss channel and the average magnetic field-line diffusion coefficient rises by more than two orders of magnitude, so NT performance in that regime is set by magnetic stochasticity rather than by electrostatic turbulence.
- The same mechanism could help explain why NT plasmas resist H-mode pedestal formation: during pedestal buildup the conditions are exactly the high-$\beta$, high-shear, flat-density-gradient conditions that trigger MTMs, and the required sustaining heat flux is unrealistically high.
- If the paper's regime boundaries are correct, reactor design for NT must actively avoid the MTM window rather than assume the electrostatic NT benefit carries over unchanged.
Reading between the lines
- This reader's extension: if the mechanism is the poloidally averaged magnetic drift, then shaping changes beyond triangularity that raise $\langle v_{Dy}\rangle$ — stronger elongation, larger Shafranov shift, or particular current-density profiles — should also destabilize MTMs; this could be tested directly with the same drift-swapping simulations used here.
- This reader's extension: the DEMO discrepancy suggests that the regime maps, built at a single wavenumber $k_y\rho_i=0.2$, should be treated as necessary rather than sufficient for nonlinear MTM dominance; the boundaries could be sharpened by nonlinear checks at a few points where linear MTMs are marginal.
- This reader's extension: the proposed H-mode link implies a concrete experimental signature — in NT plasmas approaching pedestal conditions, electron temperature profiles should stiffen or flatten exactly where linear MTMs are predicted, and heating scans should show a confinement saturation that PT plasmas do not.
- This reader's extension: integrated modeling chains for NT power plants would need electromagnetic transport self-consistently, since linear stability alone can both overstate (DEMO) and understate (SMART) the MTM transport level.
Signed reviews
Editorial analysis
A structured set of objections, weighed in public.
Referee Report
Summary. This manuscript uses local flux-tube GENE simulations to compare negative- and positive-triangularity versions of five devices (TCV, DIII-D, MAST-U, SMART, and EU-DEMO). It claims that NT geometry is more susceptible to micro-tearing modes, that the destabilization is caused by faster poloidally averaged magnetic drifts in NT, and that at sufficiently large beta, magnetic shear, and electron-to-ion temperature gradient ratio, all NT scenarios enter an MTM-dominated regime with transport several times worse than in PT. The linear regime maps are built from single-wavenumber scans at kyρi = 0.2; the supporting nonlinear evidence consists of beta scans for DEMO and SMART plus two pure-MTM scenarios with magnetic-drift and FLR profile swaps. The paper notes that nonlinear MTM simulations are numerically challenging and that only a limited set of nonlinear runs was possible.
Significance. If the transport-level conclusion were established, it would matter directly for NT reactor design: NT spherical tokamaks could suffer MTM-driven confinement degradation at high beta, and NT pedestal formation might be limited by the same mechanism. The manuscript's genuine strengths are the multi-machine scope, the direct nonlinear SMART demonstration of MTM dominance with field-line stochasticity diagnostics, and a clean mechanistic test in which vDy and FLR profiles are swapped between NT and PT (Figs. 17-19). The drift-based mechanism is well supported by the simulations. However, the paper's central transport-level claim is currently supported mainly by single-wavenumber linear scans and is contradicted by the paper's own nonlinear DEMO results, so the conclusion as stated overreaches. The paper does not ship machine-checked proofs or code, but the direct gyrokinetic simulations and the explicit drift-swap experiments are reproducible in principle and represent a useful contribution to the MTM literature.
major comments (4)
- [Section V, Figs. 7 and 12] The paper's own nonlinear DEMO results contradict the inference from the linear regime maps. In Fig. 7 the kyρi = 0.2 mode in NT DEMO is identified as MTM for β ≳ 0.6%, but Fig. 12 shows that for the same β values the electrostatic electron and ion heat fluxes dominate, with Qe,em remaining small and Qi,es the largest channel. The text in Section V states that MTMs 'are not strong enough linearly to dominate nonlinear transport and remain weak.' Linear MTM dominance at a single wavenumber is therefore not sufficient for MTM-dominated transport, and the conclusion bullet that 'All NT scenarios entered an MTM dominated regime when β ≳ 0.3%, s_hat ≳ 2.5, ωTe/ωTi > 1' cannot be inferred from the linear maps alone. This is load-bearing for the abstract's claim that MTMs 'make transport much worse than in positive triangularity.'
- [Section V, 'linear ky scans ... (not shown here)'] The reconciliation of the linear and nonlinear DEMO results relies on unshown ky scans: the text says that linear ky scans of NT DEMO with β ≳ 0.6% (not shown here) show ITG modes at kyρi > 0.2. These scans are the only evidence that the kyρi = 0.2 MTM is unrepresentative of the full wavenumber spectrum, and they are used to explain why the nonlinear transport remains ITG-dominated. Since this point is central to limiting the regime maps, the scans should be presented in the paper or included as supplementary material; without them the reader cannot verify the reconciliation.
- [Section V, Figs. 11-13] The nonlinear confirmation is limited to DEMO and SMART at their reference shears and with externally imposed flow shear (γExB = 0.1 cs/R for SMART and 0.05 cs/R for DEMO), and for SMART with fixed ωTe/ωTi = 1. No nonlinear simulation is reported for TCV, DIII-D, or MAST-U in the high-β, high-s_hat corners where Figs. 5-6 and 9 predict MTM dominance in NT. The 'all NT scenarios' conclusion therefore extrapolates beyond the nonlinear evidence. To support the transport-level claim, the authors should either add nonlinear cases in at least one of the predicted MTM-dominated corners or restrict the conclusion to linear susceptibility and to the machines for which nonlinear runs are presented.
- [Section VI.A, Eq. (4)] The drift-mechanism test uses the parametrization vDy(z) = σ vDy^NT(z) + vD0, which varies the magnitude and offset of the NT drift profile but not its shape independently. The statement that the growth rate depends only on ⟨vDy⟩ and not on how the profile changes with poloidal angle is therefore established only within this one-parameter family of profiles. This is a caveat rather than a fatal flaw, because the nonlinear drift-swap experiment in Fig. 19 points in the same direction, but the linear text in Section VI.A.1 is somewhat stronger than the test actually demonstrates.
minor comments (5)
- [Section VI.A.1] The sentence 'this simplifies th way geometry enters' contains a typo; it should read 'the way geometry enters'.
- [Section VI.A.2] The phrase 'The the solid circles show no difference' contains a duplicated article; it should read 'The solid circles show no difference.'
- [Section III] The sentence 'The reminder of the paper is structured as follows' should say 'remainder of the paper.'
- [Section II, Fig. 1] The text referring to an MTM 'in figure 1(b)' appears to be a figure-reference error: panel 1(b) is the parallel vector potential for the ITG row, while the corresponding MTM quantity is in panel 1(e).
- [Section IV, Figs. 5-8] The mode-identity distinction in the frequency colormaps relies on color intensity alone (light blue for TEM, darker blue for MTM). An explicit mode-boundary overlay or hatching would make the MTM-dominated regions much easier to read and would reduce the risk of misclassification in regions with continuous color variation.
Circularity Check
No significant circularity: the MTM destabilization and the drift mechanism are established by direct, controlled GENE simulations, not by fitting or by a self-citation chain.
full rationale
The paper's central claims are supported by independent computational evidence presented within the paper itself. Linear and nonlinear flux-tube GENE simulations are run at fixed kinetic profiles with only triangularity (and its shear) flipped, so the NT/PT comparison is not fitting a parameter to a pre-chosen outcome. The regime maps in Figs. 5-9 are linear scans over beta, magnetic shear, and temperature-gradient ratio; they are reported as linear predictions and are then checked, where affordable, by nonlinear simulations in Section V. The mechanism claim is tested by controlled numerical experiments: Eq. (4) artificially modifies the poloidal profile of the magnetic drift, and Fig. 17 shows that the MTM growth rate depends only on the poloidally averaged drift, while Fig. 18 and Fig. 19 swap FLR effects and drift profiles between NT and PT. These experiments do not assume the conclusion; they isolate the geometric quantity that destabilizes MTMs. Self-citations to Ref. [20] are used for methodology (the drift-profile modification procedure) and for the prior ITG/TEM picture, but the MTM-specific result is not imported from Ref. [20]; it is derived here from the drift-swap and FLR-swap simulations. The DEMO nonlinear result in Section V, where ky_rho_i = 0.2 is linearly MTM but transport remains ITG-dominated, is a scope/correctness caveat about extrapolating single-wavenumber linear maps to nonlinear transport; it is not a circular step because the paper does not define MTM dominance by the same simulation that it then uses to infer the mechanism. No parameter is fitted to a targeted flux, no uniqueness theorem is invoked, and no known result is merely renamed.
Assumptions & free parameters
free parameters (2)
- External E x B flow shear rate gamma_ExB =
0.1 cs/R (SMART), 0.05 cs/R (DEMO)
- Electron-to-ion temperature gradient ratio omega_Te/omega_Ti in SMART nonlinear runs =
1.0 (fixed)
assumptions (6)
- domain assumption Gyrokinetic Vlasov-Maxwell equations as implemented in GENE give a quantitatively correct description of MTM turbulence.
- domain assumption Miller local equilibrium with parameters of Table II represents the experimental flux surfaces; flipping delta and s_delta while fixing all other parameters isolates the effect of triangularity.
- domain assumption Flux-tube approximation with constant gradients is valid at rho_tor = 0.75-0.85 for these devices.
- domain assumption The mode identification criteria in Table I correctly separate ITG, TEM, and MTM.
- domain assumption Adiabatic ions are sufficient for the pMTM-1 nonlinear isolation of MTM dynamics.
- ad hoc to paper Artificial modification of the magnetic drift profile via Eq. (4) tests the magnetic-drift mechanism without changing other physics.
Cite this review
Pith. "Pith review of On the interplay between plasma triangularity and micro-tearing turbulence." pith.science (2026). https://pith.science/paper/YOHMR6OC
@misc{pith2026250720244,
  author       = {Pith},
  title        = {Pith review of: On the interplay between plasma triangularity and micro-tearing turbulence},
  year         = {2026},
  howpublished = {\url{https://pith.science/paper/YOHMR6OC}},
  note         = {Machine review of arXiv:2507.20244}
}
abstract
In this work, we study the interplay between triangularity and micro-tearing turbulence using linear and nonlinear flux tube GENE simulations. We consider scenarios with negative and positive triangularity plasma shaping taken from existing tokamaks (TCV, DIII-D, MAST-U and SMART) and EU-DEMO. The study of all these tokamaks reveals a coherent picture. Negative triangularity geometry is more susceptible to micro-tearing modes (MTM), which, when present, make transport much worse than in positive triangularity. At sufficiently large $\beta$ (the ratio of plasma pressure over magnetic pressure), magnetic shear and ratio of electron to ion temperature gradient, all the scenarios with negative triangularity are dominated by MTM turbulence. In contrast, the corresponding scenarios with positive triangularity remain dominated by electrostatic turbulence and MTMs are subdominant or stable. We observe that conventional tokamaks usually operate in a parameter space far away from the onset of this MTM-dominated regime in negative triangularity, thus preserving the beneficial effect of negative triangularity on turbulent transport. In contrast, spherical tokamaks operate close to this regime and may ultimately exhibit worse transport at negative triangularity than positive triangularity. We find that lowering the magnetic shear in spherical tokamaks can preserve the beneficial effect of negative triangularity on electrostatic turbulence and prevent strong MTM transport. Finally, linear and nonlinear simulations reveal the reason for stronger MTMs: the magnetic drifts are faster in the negative triangularity geometry.
Figures


Figures from the paper (14 more)







Reference graph
Works this paper leans on
-
[25]
A. Marinoni, S. Brunner, Y. Camenen, S. Coda, J. P. Graves, X. Lapillonne, A. Pochelon, O. Sauter, and L. Villard, Plasma Physics and Controlled Fusion 51, 055016 (2009)
work page 2009
-
[1]
7<ρ tor < 0. 9, where the magnitude of triangularity is substantial and we expect it to have the largest impact on transport. Here ρtor = √ Φ/ Φ LCF S , where Φ is the toroidal magnetic flux. Using the base set of parameters shown in table II, we first performed linear binormal wavenumber ky scans to assess the dominant type of instabilities at the ion scal...
-
[2]
We imposed the FLR profile of the PT case in the NT case
Impact of FLR effects To investigate the role FLR effects play in MTM tur- bulence, we built a new case with the pMTM-2 scenario. We imposed the FLR profile of the PT case in the NT case. Figure 18 displays the results. Here, we plot the growth rates from the previous magnetic drift scan and we superimpose the results of the new NT simulations with the FLR e...
-
[3]
indicate that MTMs remain dominant in SMART even at a conventional as- pect ratio of A = 5 (remembering that A is the local aspect ratio of the flux surface being simulated). In addi- tion, NT remains more unstable than PT, suggesting that MTMs are in general stronger in NT geometry, indepen- dently of A. Thus, we cannot conclude that aspect ratio alone is...
-
[4]
M. Fontana, L. Porte, S. Coda, and O. S. and, Nuclear Fusion 58, 024002 (2017)
work page 2017
-
[5]
More information can be found in [ 20], where we used the same procedure for ITG modes
Impact of magnetic drifts To study the impact of magnetic drifts on the stability of MTMs, we modified GENE to artificially change the profile of vDy along the poloidal angle z according to vDy (z) = σv N T Dy (z) +vD0, (4) where vN T Dy is the original profile of the NT case, σ is a scalar that modifies how much the profile varies along the poloidal angle and ...
-
[6]
M. E. Austin, A. Marinoni, M. L. Walker, M. W. Brookman, J. S. deGrassie, A. W. Hyatt, G. R. McKee, C. C. Petty, T. L. Rhodes, S. P. Smith, C. Sung, K. E. Thome, and A. D. Turnbull, Phys. Rev. Lett. 122, 115001 (2019)
work page 2019
-
[7]
Paz-Soldan and the DIII-D Team, Plasma Physics and Controlled Fusion 63, 083001 (2021)
C. Paz-Soldan and the DIII-D Team, Plasma Physics and Controlled Fusion 63, 083001 (2021)
work page 2021
Show all 54 references
-
[8]
Weisen, J.-M
H. Weisen, J.-M. Moret, S. Franke, I. Furno, Y. Martin, M. Anton, R. Behn, M. Dutch, B. Duval, F. Hofmann, B. Joye, C. Nieswand, Z. Pietrzyk, and W. V. Toledo, Nuclear Fusion 37, 1741 (1997)
1997
-
[9]
Merle, O
A. Merle, O. Sauter, and S. Y. Medvedev, Plasma Physics and Controlled Fusion 59, 104001 (2017)
2017
-
[10]
A. O. Nelson, L. Schmitz, T. Cote, J. F. Parisi, S. Stew- art, C. Paz-Soldan, K. E. Thome, M. E. Austin, F. Scotti, J. L. Barr, A. Hyatt, N. Leuthold, A. Marinoni, T. Neiser, T. Osborne, N. Richner, A. S. Welander, W. P. Wehner, R. Wilcox, T. M. Wilks, J. Yang, and the DIII-D ...
2024
-
[11]
1 −QP T/Q N T
Here we display the normalized ratio of the total heat fluxes in PT over NT, i.e. 1 −QP T/Q N T. A value larger than zero means that NT has worse energy confine- ment than PT, while negative values mean NT has better 13 confinement than PT. These nonlinear simulations agree with ...
-
[12]
Additionally, the ion channel is larger than the electron one
We see that the electrostatic components of the heat fluxes dom- inate over the electromagnetic ones for all values of β for both NT and PT. Additionally, the ion channel is larger than the electron one. This implies that ITG is domi- nant. This appears to differ slightly from t...
-
[13]
Marinoni, M
A. Marinoni, M. E. Austin, A. W. Hyatt, M. L. Walker, J. Candy, C. Chrystal, C. J. Lasnier, G. R. McKee, T. Odstrˇ cil, C. C. Petty, M. Porko- lab, J. C. Rost, O. Sauter, S. P. Smith, G. M. Staebler, C. Sung, K. E. Thome, A. D. Turnbull, and L. Zeng, Physics of Plasmas 26, 042...
2019 doi
-
[14]
K. E. Thome, M. E. Austin, A. Hyatt, A. Marinoni, A. O. Nelson, C. Paz-Soldan, F. Scotti, W. Boyes, L. Casali, C. Chrystal, S. Ding, X. D. Du, D. El- don, D. Ernst, R. Hong, G. R. McKee, S. Mordijck, O. Sauter, L. Schmitz, J. L. Barr, M. G. Burke, S. Coda, T. B. Cote, M. E. Fe...
2024
-
[15]
S. Coda, A. Merle, O. Sauter, L. Porte, F. Bag- nato, J. Boedo, T. Bolzonella, O. F´ evrier, B. Labit, A. Marinoni, A. Pau, L. Pigatto, U. Sheikh, C. Tsui, M. Vallar, T. Vu, and T. T. Team, Plasma Physics and Controlled Fusion 64, 014004 (2021)
2021
-
[16]
Happel, T
T. Happel, T. P¨ utterich, D. Told, M. Dunne, R. Fischer, J. Hobirk, R. McDermott, U. Plank, and A. U. T. the, Nuclear Fusion 63, 016002 (2022)
2022
-
[17]
To conclude, we showed that MTMs are more unsta- ble for faster poloidally averaged magnetic drift velocities ⟨vDy⟩
Finally, we observe that NT has larger averaged drift velocity than PT, which can explain the much more unstable MTMs. To conclude, we showed that MTMs are more unsta- ble for faster poloidally averaged magnetic drift velocities ⟨vDy⟩. Because of this, NT geometries, which hav...
-
[18]
A. O. Nelson, L. Schmitz, C. Paz-Soldan, K. E. Thome, T. B. Cote, N. Leuthold, F. Scotti, M. E. Austin, A. Hyatt, and T. Osborne, Phys. Rev. Lett. 131, 195101 (2023)
2023
-
[19]
Balestri, P
A. Balestri, P. Mantica, A. Mariani, F. Bag- nato, T. Bolzonella, J. Ball, S. Coda, M. Dunne, M. Faitsch, P. Innocente, P. Muscente, O. Sauter, M. Vallar, E. Viezzer, the TCV Team, and the EUROfusion Tokamak Exploitation Team, Plasma Physics and Controlled Fusion 66, 065031 (2024)
2024
-
[20]
Aucone, P
L. Aucone, P. Mantica, T. Happel, J. Hobirk, T. P¨ utterich, B. Vanovac, C. F. B. Zimmermann, M. Bernert, T. Bolzonella, M. Cavedon, M. Dunne, R. Fischer, P. Innocente, A. Kappatou, R. M. McDer- mott, A. Mariani, P. Muscente, U. Plank, F. Sciortino, G. Tardini, t. E. WPTE Team...
2024
-
[21]
Mariani, L
A. Mariani, L. Aucone, A. Balestri, P. Mantica, G. Merlo, R. Ambrosino, F. Bagnato, L. Balbinot, J. Ball, T. Bolzonella, D. Brioschi, I. Casiraghi, A. Castaldo, S. Coda, L. Frassinetti, V. Fusco, T. Hap- pel, J. Hobirk, P. Innocente, R. McDermott, P. Mus- cente, T. P¨ utterich...
2024
-
[22]
Paz-Soldan, C
C. Paz-Soldan, C. Chrystal, P. Lunia, A. Nel- son, K. Thome, M. Austin, T. Cote, A. Hyatt, N. Leuthold, A. Marinoni, T. Osborne, M. Pharr, O. Sauter, F. Scotti, T. Wilks, and H. Wilson, Nuclear Fusion 64, 094002 (2024)
2024
-
[23]
Rutherford, H
The MANTA Collaboration, G. Rutherford, H. S. Wilson, A. Saltzman, D. Arnold, J. L. Ball, S. Ben- jamin, R. Bielajew, N. de Boucaud, M. Calvo-Carrera, R. Chandra, H. Choudhury, C. Cummings, L. Corsaro, N. DaSilva, R. Diab, A. R. Devitre, S. Ferry, S. J. Frank, C. J. Hansen, J....
2024
-
[24]
H. S. Wilson, A. O. Nelson, J. McClenaghan, P. Rodriguez-Fernandez, J. Parisi, and C. Paz-Soldan, Plasma Physics and Controlled Fusion 67, 015026 (2024)
2024
-
[26]
Merlo, M
G. Merlo, M. Fontana, S. Coda, D. Hatch, S. Janhunen, L. Porte, and F. Jenko, Physics of Plasmas 26, 102302 (2019) , https://doi.org/10.1063/1.5115390
2019 doi
-
[27]
Balestri, J
A. Balestri, J. Ball, S. Coda, D. J. Cruz- Zabala, M. Garcia-Munoz, and E. Viezzer, Plasma Physics and Controlled Fusion 66, 075012 (2024)
2024
-
[28]
G. D. Giannatale, A. Bottino, S. Brun- ner, M. Murugappan, and L. Villard, Plasma Physics and Controlled Fusion 66, 095003 (2024)
2024
-
[29]
A. C. D. Hoffmann, A. Balestri, and P. Ricci, Plasma Physics and Controlled Fusion 67, 015031 (2024)
2024
-
[30]
Merlo and F
G. Merlo and F. Jenko, Journal of Plasma Physics 89, 905890104 (2023)
2023
-
[31]
Merlo, M
G. Merlo, M. Dicorato, B. Allen, T. Dan- nert, K. Germaschewski, and F. Jenko, Physics of Plasmas 30, 102302 (2023) , https://pubs.aip.org/aip/pop/article-pdf/doi/10.1063/5.0167292/18156680/102302 1 5.0167292.pdf
2023 doi
-
[32]
M. J. Pueschel, P. Mulholland, O. Sauter, R. Coose- mans, J. Ball, M. Hamed, M. Vallar, and the TCV Team, Physics of Plasmas 32, 052302 (2025) , https://pubs.aip.org/aip/pop/article-pdf/doi/10.1063/5.0255557/20520339/052302 1 5.0255557.pdf
2025 doi
-
[33]
Guttenfelder, J
W. Guttenfelder, J. Candy, S. M. Kaye, W. M. Nevins, E. Wang, R. E. Bell, G. W. Hammett, B. P. LeBlanc, D. R. Mikkelsen, and H. Yuh, Phys. Rev. Lett. 106, 155004 (2011)
2011
-
[34]
Doerk, F
H. Doerk, F. Jenko, M. J. Pueschel, and D. R. Hatch, Phys. Rev. Lett. 106, 155003 (2011)
2011
-
[35]
Doerk, F
H. Doerk, F. Jenko, T. G¨ orler, D. Told, M. J. Pueschel, and D. R. Hatch, Physics of Plasmas 19, 055907 (2012) , https://pubs.aip.org/aip/pop/article-pdf/doi/10.1063/1.3694663/13988983/055907 1 online.pdf
2012 doi
-
[36]
Maeyama, T.-H
S. Maeyama, T.-H. Watanabe, and A. Ishizawa, Phys. Rev. Lett. 119, 195002 (2017)
2017
-
[37]
Hamed, M
M. Hamed, M. J. Pueschel, J. Citrin, M. Muraglia, X. Garbet, and Y. Came- nen, Physics of Plasmas 30, 042303 (2023) , https://pubs.aip.org/aip/pop/article-pdf/doi/10.1063/5.0104879/168
2023 doi
-
[38]
R. D. Hazeltine, D. Dobrott, and T. S. Wang, The Physics of Fluids 18, 1778 (1975) , https://pubs.aip.org/aip/pfl/article-pdf/18/12/1778/12677837/1778
1975
-
[39]
N. T. Gladd, J. F. Drake, C. L. Chang, and C. S. Liu, The Physics of Fluids 23, 1182 (1980) , https://pubs.aip.org/aip/pfl/article-pdf/23/6/1182/12463057/1182 1
1980
-
[40]
J. F. Drake and Y. C. Lee, The Physics of Fluids 20, 1341 (1977) , https://pubs.aip.org/aip/pfl/article-pdf/20/8/1341/12612734/1341 1
1977
-
[41]
P. J. Catto and M. Rosenbluth, The Physics of Fluids 24, 243 (1981)
1981
-
[42]
Garbet, F
X. Garbet, F. Mourgues, and A. Samain, Plasma Physics and Controlled Fusion 32, 131 (1990)
1990
-
[43]
D. J. Applegate, C. M. Roach, J. W. Connor, S. C. Cowley, W. Dorland, R. J. Hastie, and N. Joiner, Plasma Physics and Controlled Fusion 49, 1113 (2007)
2007
-
[44]
Hamed, M
M. Hamed, M. Muraglia, Y. Camenen, X. Garbet, and O. Agullo, Physics of Plasmas 26, 092506 (2019) , https://pubs.aip.org/aip/pop/article-pdf/doi/10.1063/1.5111701/148
2019 doi
-
[45]
R. L. Miller, M. S. Chu, J. M. Greene, Y. R. Lin- Liu, and R. E. Waltz, Physics of Plasmas 5, 973 (1998) , https://doi.org/10.1063/1.872666
1998 doi
-
[46]
Candy, Plasma Physics and Controlled Fusion 51, 105009 (2009)
J. Candy, Plasma Physics and Controlled Fusion 51, 105009 (2009)
2009
-
[47]
Parisi, W
J. Parisi, W. Guttenfelder, A. Nelson, R. Gaur, A. Kleiner, M. Lampert, G. Avdeeva, J. Berk- ery, C. Clauser, M. Curie, A. Diallo, W. Dor- land, S. Kaye, J. McClenaghan, and F. Parra, Nuclear Fusion 64, 054002 (2024)
2024
-
[48]
S. J. Doyle, A. Mancini, M. Agredano-Torres, J. L. Garcia-Sanchez, J. Segado-Fernandez, J. Ayllon-Guerola, M. Garcia-Munoz, E. Viezzer, J. Garcia-Lopez, Y. S. Hwang, and K. J. Chung, Plasma Research Express 3, 044001 (2021)
2021
-
[49]
Doyle, D
S. Doyle, D. Lopez-Aires, A. Mancini, M. Agredano- Torres, J. Garcia-Sanchez, J. Segado-Fernandez, J. Ayllon-Guerola, M. Garcia-Mu˜ noz, E. Viezzer, C. Soria-Hoyo, J. Garcia-Lopez, G. Cunningham, P. Buxton, M. Gryaznevich, Y. Hwang, and K. Chung, Fusion Engineering and Design ...
2021
-
[50]
Cruz-Zabala, M
D. Cruz-Zabala, M. Podest` a, F. Poli, S. Kaye, M. Garcia-Munoz, E. Viezzer, and J. Berkery, Nuclear Fusion 64, 126071 (2024)
2024
-
[51]
G. V. Pereverzev and P. N. Yushmanov, ASTRA Auto- mated System for TRansport Analysis (2002)
2002
-
[52]
G. M. Staebler, J. E. Kinsey, and R. E. Waltz, Physics of Plasmas 14, 055909 (2007) , https://doi.org/10.1063/1.2436852
2007 doi
-
[53]
Arakawa, Journal of Computational Physics 1, 119 (1966)
A. Arakawa, Journal of Computational Physics 1, 119 (1966)
1966
-
[54]
M. J. Pueschel, D. R. Hatch, T. G¨ orler, W. M. Nevins, F. Jenko, P. W. Terry, and D. Told, Physics of Plasmas 20, 102301 (2013) , https://pubs.aip.org/aip/pop/article-pdf/doi/10.1063/1.4823717/156
2013 doi
Reviewed August 6, 2026 · model on record in the stance chip above.
Discussion (0). Continue with ORCID to comment.