REVIEW 3 major objections 5 minor 86 references
Revisiting the Perseus Cluster I: Resolving the Si/S/Ar/Ca ratios by Stellar Convection
T0 review · 3 major / 5 minor · reviewed 2026-08-06 · deepseek-v4-flash
Pith's one-line read The paper argues that pairing a mixing length parameter of 2.2 with a semi-convection parameter of 0.03 in massive-star models brings core-collapse supernova yields of Si, S, Ar, and Ca into line with the Perseus Cluster's measured…
desk verdict Useful yield tables and a plausible mechanism, but the 'best fit' claim to Perseus is not actually demonstrated against the Hitomi data. read the letter →
The pith
A machine-rendered reading of the paper's core claim, the machinery that carries it, and where it could break.
The reading
What carries the argument
The load-bearing object is the pair of convection parameters $\alpha$ (mixing length, controlling convective mixing efficiency) and $\alpha_{\rm SC}$ (semi-convection diffusion). They act by rearranging the pre-collapse composition of the progenitor: a higher $\alpha$ produces a more extended, continuously growing Si core and more Ar and Ca in the Si shell, and in some cases merges convection zones in the Si and C+O layers; a higher $\alpha_{\rm SC}$ sharpens the O-Si boundary and reduces Si-group production. These pre-collapse differences are then converted into final yields by a 1D thermal-bomb explosion with a fixed $10^{51}$ erg energy and an imposed Fe-core mass cut, followed by a 495-isotope nucleosynthesis network that turns each fluid element's thermodynamic history into isotope yields.
What would settle it
A 3D neutrino-driven explosion of a 20 solar mass star that matches the Perseus Si/S/Ar/Ca ratios with no tuning of convection parameters, or a high-resolution X-ray measurement of another cluster where the (2.2, 0.03) yields predict the wrong Ar and Ca ratios, would count against the claim.
Extended reading notes
Core claim
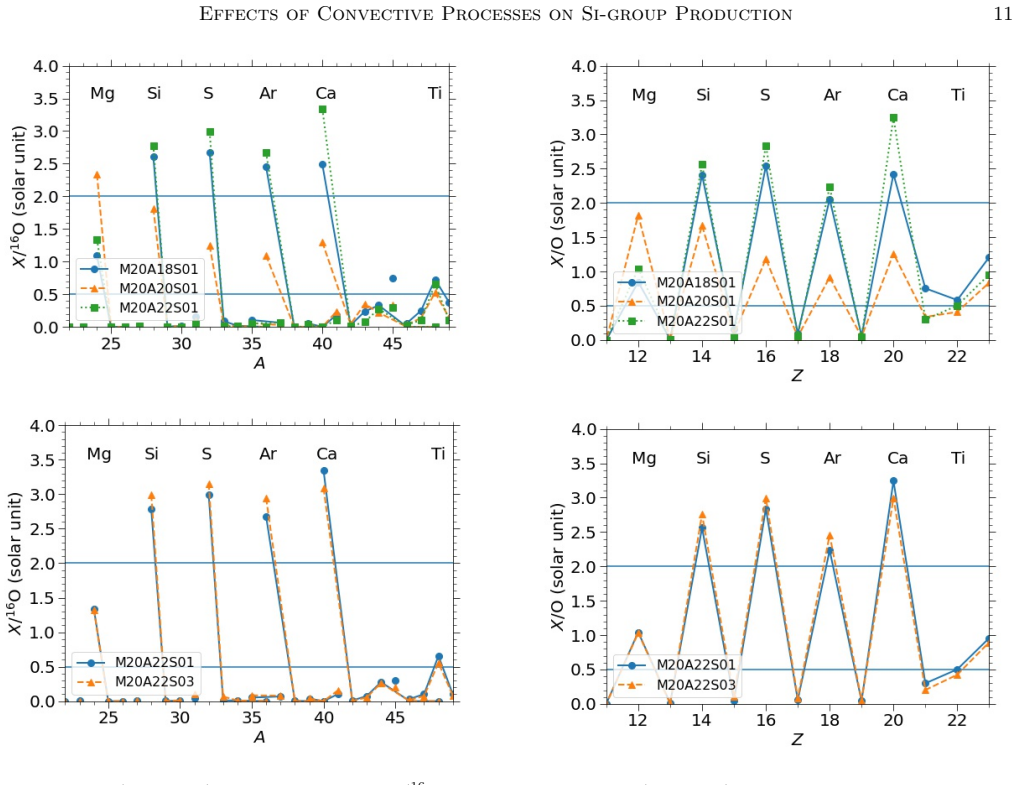
The paper's central discovery is that the ratio problem for Si, S, Ar, and Ca can be resolved by changing how convective mixing shapes the pre-collapse star, without touching nuclear reaction rates. A larger $\alpha$ burns more oxygen into silicon-group material and extends the Ar- and Ca-rich zones in the ejecta, while a larger $\alpha_{\rm SC}$ suppresses the overproduction of Si and S relative to Ar and Ca, making the four elements more uniform. With $\alpha = 2.2$ and $\alpha_{\rm SC} = 0.03$, the $20\,M_\odot$ model gives $[\mathrm{Si}/\mathrm{Fe}]$, $[\mathrm{S}/\mathrm{Fe}]$, $[\mathrm{Ar}/\mathrm{Fe}]$, and $[\mathrm{Ca}/\mathrm{Fe}]$ all near $0.6$, a pattern close to the near-solar ratios observed in Perseus, while the 15 and 25 solar mass models underproduce these elements and the 40 solar mass model lands close to solar.
Load-bearing premise
The argument relies on the 1D thermal-bomb explosion model, with its fixed $10^{51}$ erg energy and imposed Fe-core mass cut, faithfully reproducing the temperature and density history that determines explosive Si-group nucleosynthesis.
Editorial extensions
If this is right
- With the (2.2, 0.03) parameters, the 20 $M_\odot$ model produces Si, S, Ar, and Ca at nearly equal super-solar ratios, closely matching the Perseus pattern.
- The 15 and 25 $M_\odot$ models underproduce the Si-group elements, so the stellar initial mass function and the relative core-collapse supernova rate at each mass become important for fitting cluster abundances.
- The 40 $M_\odot$ model synthesizes Si-group elements close to solar, so more massive progenitors do not drive the Perseus signal.
- Slightly super-solar CCSN Si-group yields can compensate for the slightly sub-solar Si-group yields of standard Type Ia supernova models when both are combined.
- The same parameter pair can serve as a calibrated input for galactic and cluster chemical evolution calculations.
Reading between the lines
- If the explanation holds, it implies that abundance anomalies previously read as evidence of aspherical explosions or altered reaction rates could partly be a stellar-convection effect; applying the same parameters to other clusters would test this generality.
- The fitted pair may be partially degenerate with the explosion energy and mass cut; a grid that varies $E_{\rm expl}$ and $M_{\rm cut}$ at fixed $(\alpha,\alpha_{\rm SC})$ would show how much of the improvement is really due to convection.
- With high-resolution X-ray spectra from XRISM, the model's predictions for minor elements such as K, Sc, and Mn could distinguish this convection-driven solution from alternatives that tune the explosion itself.
- The models remove the hydrogen envelope after the main sequence, approximating binary evolution; recomputing with full envelopes would test whether single-star yields shift enough to weaken the Perseus fit.
Signed reviews
Editorial analysis
A structured set of objections, weighed in public.
Referee Report
Summary. The paper uses the MESA stellar evolution code to compute 15–40 solar-mass progenitor models with varied mixing-length parameter α and semi-convection parameter α_SC, then explodes them with a 1D thermal-bomb hydrodynamics code and post-processes the ejecta with a larger nucleosynthesis network. The central claim is that the parameter pair (α, α_SC) = (2.2, 0.03) makes the Si/S/Ar/Ca yields of a 20 solar-mass model 'closest to the Perseus Cluster' and is 'required to fit' the observed pattern, primarily by making the four element ratios more uniform and by raising Ar and Ca relative to Si and S. The paper also compares against literature CCSN models and discusses implications for future XRISM observations.
Significance. If the central claim were established, the paper would offer a concrete way to reduce the long-standing discrepancy between spherical CCSN yield models and the near-solar Si-group ratios in the Perseus ICM without changing nuclear reaction rates. The study is systematic within its parameter grid, and the authors make the configuration files available on Zenodo and tabulate the yields in Appendix A, which aids reproducibility. However, the significance is currently limited because the claimed match to Perseus is not demonstrated quantitatively: no observed abundance ratios or uncertainties from Hitomi are quoted, no figure overlays model predictions on the data, and Table 2 shows the favored model to be ~0.6 dex supersolar in [X/Fe]. The qualitative trend that higher α raises Ar and Ca while higher α_SC flattens the Si-group pattern is useful, but the paper's headline conclusion goes beyond what the presented comparison supports.
major comments (3)
- [Abstract, §5.3, §6.3, Table 2] The central claim that (α, α_SC) = (2.2, 0.03) yields the pattern 'closest to the Perseus Cluster' is not supported by any quantitative comparison to the observed Perseus abundances. The paper never quotes the Hitomi Collaboration (2017) measured ratios or their uncertainties, and no figure overlays the model yields on the observed cluster abundances. Table 2 shows that M20A22S03 has [Si/Fe]=0.61, [S/Fe]=0.64, [Ar/Fe]=0.56, and [Ca/Fe]=0.64, i.e., all four ratios are about 0.6 dex (a factor of ~4) above solar, while §1.2 of the paper itself states that the Perseus ICM is in 'strikingly good agreement with the Solar ratios.' The 15, 25, and 40 solar-mass models in the same table have [X/Fe] between about -0.28 and +0.14, much closer to the observed absolute level, yet they are dismissed because their patterns are less uniform. Thus the selection of M20A22S03 and of (2.2, 0.03) is a pattern-shape-only, post-hoc choice. I request a defined goodness-of-fit measure (e.g., a chi-square over Si, S, Ar, Ca using Hitomi uncertainties, with a CCSN+SN Ia mixture) or a reframing of the conclusion as 'produces a uniform Si-group pattern' rather than 'fits Perseus.'
- [§2, §4.1] The explosion model fixes the explosion energy at 10^51 erg and deposits it as a thermal bomb in the innermost 0.1 solar mass inside the Fe-core mass cut. The paper's conclusion that convective parameters alone resolve the Perseus Si/S/Ar/Ca mismatch rests on this fixed explosion prescription. Since the yields of Si-group elements and the Fe normalization are sensitive to the mass cut and explosion energy, the fitted (α, α_SC) values could be compensating for explosion-model error rather than representing real stellar convection. Please test the sensitivity of the [Si/Fe], [S/Fe], [Ar/Fe], and [Ca/Fe] pattern of M20A22S03 to at least a modest variation in the explosion energy and mass cut, or discuss quantitatively why the conclusion is robust to these choices.
- [§5.3, §6.2, Table 5] The Perseus ICM is an IMF-integrated enrichment from many CCSNe and SNe Ia, but the paper compares individual CCSN yields directly to the cluster and does not construct a mixture of progenitor masses and SN Ia contributions. The paper itself notes in §6.2 that SNe Ia contribute a representative fraction of Si-group elements. Without an IMF-weighted CCSN+SN Ia synthesis, the statements that the 20 solar-mass model is the 'main producer' of Si-group elements and that its pattern is 'closest to the Perseus Cluster' are not a test of cluster enrichment. A simple mixture using the tabulated Chandrasekhar and sub-Chandrasekhar yields in Appendix A would show whether the claimed improvement survives when the cluster context is included.
minor comments (5)
- [Table 1, §3] The model naming convention is inconsistent: M20A15S01 is listed with α=0.15, while §3 states α=0.1×YY and YY=15 should give α=1.5; similarly M20A20S03 is listed with α_SC=0.02 although the name implies α_SC=0.03. Please harmonize the table and the naming convention.
- [Figure 13, Figure 15, §5.3] The captions of Figures 13 and 15 list 'M20A22S01' in the plotted sequences, but the text and Table 2 describe the reference model as M20A22S03; please correct the captions.
- [§5.3] Bullet (2) of Section 5.3 refers to 'M40A220S03', which is a typo for M40A22S03.
- [§3, §5.2] The sentence 'We vary α between 1.5 to 2.2 and α_SC = 0.03 between 0.01 - 0.30' is garbled and should presumably read 'α_SC between 0.01 and 0.30.' In addition, §5.2 refers to 'M20A22S02', a model that does not appear in Table 1.
- [§6.1] The sentence 'The L20 model has the overall the closest elemental distribution' contains a grammatical error; it should be 'has overall the closest elemental distribution.'
Circularity Check
The conclusion that (alpha, alpha_SC)=(2.2,0.03) is 'required to fit' the Perseus Si/S/Ar/Ca pattern is a restatement of the parameter search used to select those values, with no independent quantitative comparison to the Hitomi data.
-
fitted input called prediction
[Abstract; Section 5.3 and Section 6.3 conclusions]
"We search for the value pair that can reduce the discrepancy in the models. We conclude that a mixing length parameter of 2.2 and semi-convection parameter of 0.03 are required to fit these criteria. ... it appears that the parameter set α=2.2 and α_SC=0.03 has chemical abundance patterns which are the closest to the Perseus Cluster."
The parameter pair is not derived from an independent first-principles constraint; it is the endpoint of the search described in the same sentences. The paper scans alpha and alpha_SC, judges models by how closely their Si/S/Ar/Ca pattern matches Perseus (in practice, by the uniformity of the four ratios, as in Table 2 and Section 5.2), and then reports the winning pair as 'required to fit these criteria.' No quantitative goodness-of-fit to the Hitomi abundances is defined, and no held-out comparison or CCSN+SN Ia mixture is constructed to test whether M20A22S03 actually predicts the Perseus pattern. The statement that (2.2, 0.03) 'may provide the abundance pattern that is closest' therefore restates the selection criterion rather than offering an out-of-sample prediction.
full rationale
The paper's stellar-evolution and explosive-nucleosynthesis pipeline (MESA plus thermal-bomb hydrodynamics plus the torch network) is a genuine calculation with internal physical content, and the trends in Si/O, Ar/O, and Ca/O with alpha and alpha_SC are computed rather than assumed. However, the central claim about Perseus is a parameter search presented as a fit: the paper explicitly seeks the (alpha, alpha_SC) pair that reduces the discrepancy with the Perseus pattern, then concludes that the selected pair is 'required' to fit and that M20A22S03 is 'closest' to Perseus. Because no quantitative distance to the Hitomi data and no independent validation (for example, testing the chosen pair on a different mass, metallicity, or observed quantity) is provided, the matching claim reduces to the selection criterion instead of constituting a prediction. The literature calibration of alpha approximately 1.786 for the Sun and approximately 2.1 for Betelgeuse offers external motivation that 2.2 is plausible, which prevents the exercise from being wholly vacuous, but it does not convert the fitted pair into a prediction. This is a partial circularity of the fitted-input-called-prediction type, specific to the Perseus conclusion; it is not a self-citation or uniqueness-import problem.
Assumptions & free parameters
free parameters (4)
- mixing_length_alpha =
2.2
- semi_convection_alpha_SC =
0.03
- explosion_energy =
1e51 erg
- inner_mass_cut =
Fe-core mass for each model (1.36-1.60 solar masses)
assumptions (5)
- domain assumption Mixing-length theory and the semi-convection prescription in MESA adequately represent convective mixing in the advanced burning phases of massive stars.
- domain assumption A 1D thermal-bomb explosion with fixed energy reproduces the explosive nucleosynthesis conditions for even-Z Si-group elements.
- domain assumption Removing the H-envelope after the main sequence does not materially change the advanced evolution of the C+O core.
- domain assumption A 21-isotope network is sufficient for the Si-group elements studied here.
- domain assumption The Perseus Si/S/Ar/Ca ratios can be interpreted with solar-metallicity CCSN yields plus Type Ia yields.
Cite this review
Pith. "Pith review of Revisiting the Perseus Cluster I: Resolving the Si/S/Ar/Ca ratios by Stellar Convection." pith.science (2026). https://pith.science/paper/D25OJECQ
@misc{pith2026250721032,
  author       = {Pith},
  title        = {Pith review of: Revisiting the Perseus Cluster I: Resolving the Si/S/Ar/Ca ratios by Stellar Convection},
  year         = {2026},
  howpublished = {\url{https://pith.science/paper/D25OJECQ}},
  note         = {Machine review of arXiv:2507.21032}
}
abstract
Chemical abundance measurements from stars in the Milky Way to the intragalactic medium in the Perseus Cluster have challenged the spherical explosion models. Models in the literature cannot closely match the observed element ratios, where Si, S are overproduced and Ar, Ca are underproduced. In this article, we explore the impact of the model parameters during the evolution of massive stars on the final explosive nucleosynthesis. We investigate the effects of a parametrized model of the convective process, including the mixing length parameter and the semi-convection parameter, on the production of Si-group elements. We search for the value pair that can reduce the discrepancy in the models. We conclude that a mixing length parameter of 2.2 and semi-convection parameter of 0.03 are required to fit these criteria. Using this updated value pair, we compute a sequence of massive star models from $M_{\rm ZAMS} = $ 15 -- 40 $M_{\odot}$. The high resolution data from future observations such as XRISM will provide further details on less constrained processes in stellar evolution and supernova explosion. Future comparison with supernova models of various progenitor metallicity will further shed light on the supernova population and their relative rates on cosmological scales.
Figures


Figures from the paper (11 more)




Reference graph
Works this paper leans on
-
[1]
Abolfathi, B., Aguado, D. S., Aguilar, G., et al. 2018, ApJS, 235, 42, doi: 10.3847/1538-4365/aa9e8a
-
[2]
1996, Supernovae and Nucleosynthesis: An Investigation of the History of Matter from the Big Bang to the Present18
Arnett, D. 1996, Supernovae and Nucleosynthesis: An Investigation of the History of Matter from the Big Bang to the Present18
1996
-
[3]
Asplund, M., Grevesse, N., Sauval, A. J., & Scott, P. 2009, ARA&A, 47, 481, doi: 10.1146/annurev.astro.46.060407.145222 B¨ ohm-Vitense, E. 1958, ZA, 46, 108
arXiv 2009
-
[4]
2018, MNRAS, 478, 4513, doi: 10.1093/mnras/sty1281
Buder, S., Asplund, M., Duong, L., et al. 2018, MNRAS, 478, 4513, doi: 10.1093/mnras/sty1281
-
[5]
Burbidge, E. M., Burbidge, G. R., Fowler, W. A., & Hoyle, F. 1957, Reviews of Modern Physics, 29, 547, doi: 10.1103/RevModPhys.29.547
-
[6]
2013, Reviews of Modern Physics, 85, 245, doi: 10.1103/RevModPhys.85.245
Burrows, A. 2013, Reviews of Modern Physics, 85, 245, doi: 10.1103/RevModPhys.85.245
-
[7]
Burrows, A., Vartanyan, D., Dolence, J. C., Skinner, M. A., & Radice, D. 2018, SSRv, 214, 33, doi: 10.1007/s11214-017-0450-9 de Plaa, J., Werner, N., Bleeker, J. A. M., et al. 2007, A&A, 465, 345, doi: 10.1051/0004-6361:20066382
-
[8]
2019, ApJ, 887, 53, doi: 10.3847/1538-4357/ab518b Fern´ andez, R
Justham, S. 2019, ApJ, 887, 53, doi: 10.3847/1538-4357/ab518b Fern´ andez, R. 2010, ApJ, 725, 1563, doi: 10.1088/0004-637X/725/2/1563 Fern´ andez, R., M¨ uller, B., Foglizzo, T., & Janka, H.-T. 2014, MNRAS, 440, 2763, doi: 10.1093/mnras/stu408
Show all 86 references
-
[9]
K., Hillebrandt, W., et al
Fink, M., R¨ opke, F. K., Hillebrandt, W., et al. 2010, A&A, 514, A53, doi: 10.1051/0004-6361/200913892
2010 doi
-
[10]
2002, A&A, 392, 353, doi: 10.1051/0004-6361:20020912
Foglizzo, T. 2002, A&A, 392, 353, doi: 10.1051/0004-6361:20020912
2002 doi
-
[11]
H., Johnson, J
Griffith, E., Weinberg, D. H., Johnson, J. A., et al. 2021, ApJ, 909, 77, doi: 10.3847/1538-4357/abd6be
2021 doi
-
[12]
R., Millman, K
Harris, C. R., Millman, K. J., van der Walt, S. J., et al. 2020, Nature, 585, 357, doi: 10.1038/s41586-020-2649-2
2020 doi
-
[13]
N., Kobayashi, C., Tominaga, N., & Nomoto, K
Hartwig, T., Ishigaki, M. N., Kobayashi, C., Tominaga, N., & Nomoto, K. 2023, ApJ, 946, 20, doi: 10.3847/1538-4357/acbcc6
2023 doi
-
[14]
1989, A&A, 210, L5
Hashimoto, M., Nomoto, K., & Shigeyama, T. 1989, A&A, 210, L5
1989
-
[15]
J., & Dessart, L
Hillier, D. J., & Dessart, L. 2019, A&A, 631, A8, doi: 10.1051/0004-6361/201935100 Hitomi Collaboration, Aharonian, F., Akamatsu, H., et al. 2017, Nature, 551, 478, doi: 10.1038/nature24301
2019 doi
-
[16]
A., Burbidge, G
Hoyle, F., Fowler, W. A., Burbidge, G. R., & Burbidge, E. M. 1956, Science, 124, 611, doi: 10.1126/science.124.3223.611
1956 doi
-
[17]
Hunter, J. D. 2007, Computing in Science & Engineering, 9, 90, doi: 10.1109/MCSE.2007.55
2007 doi
-
[18]
1999, ApJS, 125, 439, doi: 10.1086/313278
Iwamoto, K., Brachwitz, F., Nomoto, K., et al. 1999, ApJS, 125, 439, doi: 10.1086/313278
1999 doi
-
[19]
2012, Progress of Theoretical and Experimental Physics, 2012, 01A309, doi: 10.1093/ptep/pts067
Janka, H.-T., Hanke, F., H¨ udepohl, L., et al. 2012, Progress of Theoretical and Experimental Physics, 2012, 01A309, doi: 10.1093/ptep/pts067
2012 doi
-
[20]
2016, Annual Review of Nuclear and Particle Science, 66, 341, doi: 10.1146/annurev-nucl-102115-044747
Janka, H.-T., Melson, T., & Summa, A. 2016, Annual Review of Nuclear and Particle Science, 66, 341, doi: 10.1146/annurev-nucl-102115-044747
2016 doi
-
[21]
T., & Mueller, E
Janka, H. T., & Mueller, E. 1996, A&A, 306, 167
1996
-
[22]
C., Gupta, S
Jordan, G. C., Gupta, S. S., & Meyer, B. S. 2003, PhRvC, 68, 065801, doi: 10.1103/PhysRevC.68.065801
2003 doi
-
[23]
2020, ApJ, 902, 63, doi: 10.3847/1538-4357/abb8db
Joyce, M., Leung, S.-C., Moln´ ar, L., et al. 2020, ApJ, 902, 63, doi: 10.3847/1538-4357/abb8db
2020 doi
-
[24]
T., & M¨ uller, E
Kifonidis, K., Plewa, T., Janka, H. T., & M¨ uller, E. 2003, A&A, 408, 621, doi: 10.1051/0004-6361:20030863
2003 doi
-
[25]
I., & Lugaro, M
Kobayashi, C., Karakas, A. I., & Lugaro, M. 2020a, ApJ, 900, 179, doi: 10.3847/1538-4357/abae65
-
[26]
2020b, ApJ, 895, 138, doi: 10.3847/1538-4357/ab8e44
Kobayashi, C., Leung, S.-C., & Nomoto, K. 2020b, ApJ, 895, 138, doi: 10.3847/1538-4357/ab8e44
-
[27]
J., & Sugimoto, D
Langer, N., Fricke, K. J., & Sugimoto, D. 1983, A&A, 126, 207
1983
-
[28]
2021a, ApJ, 909, 152, doi: 10.3847/1538-4357/abc9c1
Leung, S.-C., Diehl, R., Nomoto, K., & Siegert, T. 2021a, ApJ, 909, 152, doi: 10.3847/1538-4357/abc9c1
-
[29]
2021b, ApJ, 915, 80, doi: 10.3847/1538-4357/abfcbe
Leung, S.-C., Fuller, J., & Nomoto, K. 2021b, ApJ, 915, 80, doi: 10.3847/1538-4357/abfcbe
- [30]
-
[31]
2023, ApJ, 948, 80, doi: 10.3847/1538-4357/acbdf5
Leung, S.-C., Nomoto, K., & Suzuki, T. 2023, ApJ, 948, 80, doi: 10.3847/1538-4357/acbdf5
2023 doi
-
[32]
2021c, ApJ, 923, 41, doi: 10.3847/1538-4357/ac2c63
Leung, S.-C., Wu, S., & Fuller, J. 2021c, ApJ, 923, 41, doi: 10.3847/1538-4357/ac2c63
-
[33]
2018, ApJS, 238, 16, doi: 10.3847/1538-4365/aada4a Liebend¨ orfer, M., Mezzacappa, A., Thielemann, F.-K., et al
Li, H., Tan, K., & Zhao, G. 2018, ApJS, 238, 16, doi: 10.3847/1538-4365/aada4a Liebend¨ orfer, M., Mezzacappa, A., Thielemann, F.-K., et al. 2001, PhRvD, 63, 103004, doi: 10.1103/PhysRevD.63.103004
2018 doi
-
[34]
2003, ApJ, 592, 404, doi: 10.1086/375703
Limongi, M., & Chieffi, A. 2003, ApJ, 592, 404, doi: 10.1086/375703
2003 doi
-
[35]
2013, ApJ, 764, 147, doi: 10.1088/0004-637X/764/2/147
Simionescu, A. 2013, ApJ, 764, 147, doi: 10.1088/0004-637X/764/2/147
2013 doi
-
[36]
2001, The chemical evolution of the Galaxy, Vol
Matteucci, F. 2001, The chemical evolution of the Galaxy, Vol. 253, doi: 10.1007/978-94-010-0967-6
2001 doi
-
[37]
2022, in Handbook of X-ray and Gamma-ray Astrophysics, 12, doi: 10.1007/978-981-16-4544-0 123-1
Mernier, F., & Biffi, V. 2022, in Handbook of X-ray and Gamma-ray Astrophysics, 12, doi: 10.1007/978-981-16-4544-0 123-1
2022 doi
-
[38]
2016, A&A, 595, A126, doi: 10.1051/0004-6361/201628765
Mernier, F., de Plaa, J., Pinto, C., et al. 2016, A&A, 595, A126, doi: 10.1051/0004-6361/201628765
2016 doi
-
[39]
S., et al
Mernier, F., de Plaa, J., Kaastra, J. S., et al. 2017, A&A, 603, A80, doi: 10.1051/0004-6361/201630075
2017 doi
-
[40]
2018, MNRAS, 480, L95, doi: 10.1093/mnrasl/sly134 19
Mernier, F., Werner, N., de Plaa, J., et al. 2018, MNRAS, 480, L95, doi: 10.1093/mnrasl/sly134 19
2018 doi
-
[41]
E., et al
Mezzacappa, A., Liebend¨ orfer, M., Messer, O. E., et al. 2001, PhRvL, 86, 1935, doi: 10.1103/PhysRevLett.86.1935
2001 doi
-
[42]
Moll, R., & Woosley, S. E. 2013, ApJ, 774, 137, doi: 10.1088/0004-637X/774/2/137
2013 doi
-
[43]
1988, PhR, 163, 13, doi: 10.1016/0370-1573(88)90032-4
Nomoto, K., & Hashimoto, M. 1988, PhR, 163, 13, doi: 10.1016/0370-1573(88)90032-4
1988 doi
-
[44]
2013, ARA&A, 51, 457, doi: 10.1146/annurev-astro-082812-140956
Nomoto, K., Kobayashi, C., & Tominaga, N. 2013, ARA&A, 51, 457, doi: 10.1146/annurev-astro-082812-140956
2013 doi
-
[45]
2017, in Handbook of Supernovae, ed
Nomoto, K., & Leung, S.-C. 2017, in Handbook of Supernovae, ed. A. W. Alsabti & P. Murdin, 1275, doi: 10.1007/978-3-319-21846-5 62 —. 2018, SSRv, 214, 67, doi: 10.1007/s11214-018-0499-0
2017 doi
-
[46]
1993, Nature, 364, 507, doi: 10.1038/364507a0
Nomoto, K., Suzuki, T., Shigeyama, T., et al. 1993, Nature, 364, 507, doi: 10.1038/364507a0
1993 doi
-
[47]
2006, NuPhA, 777, 424, doi: 10.1016/j.nuclphysa.2006.05.008
Maeda, K. 2006, NuPhA, 777, 424, doi: 10.1016/j.nuclphysa.2006.05.008
2006 doi
-
[48]
R., et al
Nomoto, K., Yamaoka, H., Pols, O. R., et al. 1994, Nature, 371, 227, doi: 10.1038/371227a0
1994 doi
-
[49]
2009, ApJ, 706, 1184, doi: 10.1088/0004-637X/706/2/1184
Tsuruta, S. 2009, ApJ, 706, 1184, doi: 10.1088/0004-637X/706/2/1184
2009 doi
-
[50]
2012, ApJL, 747, L10, doi: 10.1088/2041-8205/747/1/L10 pandas development team, T
Pakmor, R., Kromer, M., Taubenberger, S., et al. 2012, ApJL, 747, L10, doi: 10.1088/2041-8205/747/1/L10 pandas development team, T. 2020, pandas-dev/pandas: Pandas, latest, Zenodo, doi: 10.5281/zenodo.3509134
2012 doi
-
[51]
2011, ApJS, 192, 3, doi: 10.1088/0067-0049/192/1/3
Paxton, B., Bildsten, L., Dotter, A., et al. 2011, ApJS, 192, 3, doi: 10.1088/0067-0049/192/1/3
2011 doi
-
[52]
2013, ApJS, 208, 4, doi: 10.1088/0067-0049/208/1/4
Paxton, B., Cantiello, M., Arras, P., et al. 2013, ApJS, 208, 4, doi: 10.1088/0067-0049/208/1/4
2013 doi
-
[53]
2015, ApJS, 220, 15, doi: 10.1088/0067-0049/220/1/15
Paxton, B., Marchant, P., Schwab, J., et al. 2015, ApJS, 220, 15, doi: 10.1088/0067-0049/220/1/15
2015 doi
-
[54]
B., et al
Paxton, B., Schwab, J., Bauer, E. B., et al. 2018, ApJS, 234, 34, doi: 10.3847/1538-4365/aaa5a8
2018 doi
-
[55]
2019, ApJS, 243, 10, doi: 10.3847/1538-4365/ab2241
Paxton, B., Smolec, R., Schwab, J., et al. 2019, ApJS, 243, 10, doi: 10.3847/1538-4365/ab2241
2019 doi
-
[56]
E., et al
Roberti, L., Pignatari, M., Brinkman, H. E., et al. 2025, A&A, 698, A216, doi: 10.1051/0004-6361/202554461 R¨ opke, F. K. 2007, ApJ, 668, 1103, doi: 10.1086/520830
2025 doi
-
[57]
J., & Wang, C
Schootemeijer, A., Langer, N., Grin, N. J., & Wang, C. 2019, A&A, 625, A132, doi: 10.1051/0004-6361/201935046
2019 doi
-
[58]
R., Ciaraldi-Schoolmann, F., R¨ opke, F
Seitenzahl, I. R., Ciaraldi-Schoolmann, F., R¨ opke, F. K., et al. 2013, MNRAS, 429, 1156, doi: 10.1093/mnras/sts402
2013 doi
-
[59]
J., Blondin, S., Kasen, D., et al
Shen, K. J., Blondin, S., Kasen, D., et al. 2021, ApJL, 909, L18, doi: 10.3847/2041-8213/abe69b
2021 doi
-
[60]
J., Kasen, D., Miles, B
Shen, K. J., Kasen, D., Miles, B. J., & Townsley, D. M. 2018, ApJ, 854, 52, doi: 10.3847/1538-4357/aaa8de
2018 doi
-
[61]
Siegert, T., Diehl, R., Krause, M. G. H., & Greiner, J. 2015, A&A, 579, A124, doi: 10.1051/0004-6361/201525877 Silva Aguirre, V., Ballot, J., Serenelli, A. M., & Weiss, A. 2011, A&A, 529, A63, doi: 10.1051/0004-6361/201015847
2015 doi
-
[62]
2019, MNRAS, 483, 1701, doi: 10.1093/mnras/sty3220
Simionescu, A., Nakashima, S., Yamaguchi, H., et al. 2019, MNRAS, 483, 1701, doi: 10.1093/mnras/sty3220
2019 doi
-
[63]
G., Dupret, M
Sonoi, T., Ludwig, H. G., Dupret, M. A., et al. 2019, A&A, 621, A84, doi: 10.1051/0004-6361/201833495
2019 doi
-
[64]
2008, PASJ, 60, 1159, doi: 10.1093/pasj/60.5.1159
Suda, T., Katsuta, Y., Yamada, S., et al. 2008, PASJ, 60, 1159, doi: 10.1093/pasj/60.5.1159
2008 doi
-
[65]
Janka, H. T. 2016, ApJ, 821, 38, doi: 10.3847/0004-637X/821/1/38
2016 doi
-
[66]
2016, in Society of Photo-Optical Instrumentation Engineers (SPIE) Conference Series, Vol
Takahashi, T., Kokubun, M., Mitsuda, K., et al. 2016, in Society of Photo-Optical Instrumentation Engineers (SPIE) Conference Series, Vol. 9905, Space Telescopes and Instrumentation 2016: Ultraviolet to Gamma Ray, ed. J.-W. A. den Herder, T. Takahashi, & M. Bautz, 99050U, doi:...
2016 doi
-
[67]
2009, ApJL, 705, L62, doi: 10.1088/0004-637X/705/1/L62
Tamura, T., Maeda, Y., Mitsuda, K., et al. 2009, ApJL, 705, L62, doi: 10.1088/0004-637X/705/1/L62
2009 doi
-
[68]
2019, in Nuclei in the Cosmos XV, Vol
Thielemann, F.-K. 2019, in Nuclei in the Cosmos XV, Vol. 219, 125–134, doi: 10.1007/978-3-030-13876-9 21
2019 doi
-
[69]
K., & Arnett, W
Thielemann, F. K., & Arnett, W. D. 1985, ApJ, 295, 604, doi: 10.1086/163403
1985 doi
-
[70]
Timmes, F. X. 1999, ApJS, 124, 241, doi: 10.1086/313257
1999 doi
- [71]
- [72]
-
[73]
X., Woosley, S
Timmes, F. X., Woosley, S. E., & Weaver, T. A. 1995, ApJS, 98, 617, doi: 10.1086/192172
1995 doi
-
[74]
2009, ApJ, 690, 526, doi: 10.1088/0004-637X/690/1/526
Tominaga, N. 2009, ApJ, 690, 526, doi: 10.1088/0004-637X/690/1/526
2009 doi
-
[75]
2007, ApJ, 660, 516, doi: 10.1086/513063
Tominaga, N., Umeda, H., & Nomoto, K. 2007, ApJ, 660, 516, doi: 10.1086/513063
2007 doi
-
[76]
1995, MNRAS, 277, 945, doi: 10.1093/mnras/277.3.945
Tsujimoto, T., Nomoto, K., Yoshii, Y., et al. 1995, MNRAS, 277, 945, doi: 10.1093/mnras/277.3.945
1995 doi
-
[77]
2002, ApJ, 565, 385, doi: 10.1086/323946
Umeda, H., & Nomoto, K. 2002, ApJ, 565, 385, doi: 10.1086/323946
2002 doi
-
[78]
S., Basu, S., Ong J., M
Viani, L. S., Basu, S., Ong J., M. J., Bonaca, A., & Chaplin, W. J. 2018, ApJ, 858, 28, doi: 10.3847/1538-4357/aab7eb
2018 doi
-
[79]
A., & Woosley, S
Weaver, T. A., & Woosley, S. E. 1993, PhR, 227, 65, doi: 10.1016/0370-1573(93)90058-L
1993 doi
-
[80]
A., Zimmerman, G
Weaver, T. A., Zimmerman, G. B., & Woosley, S. E. 1978, ApJ, 225, 1021, doi: 10.1086/156569 20
1978 doi
-
[81]
C., & Harkness, R
Wheeler, J. C., & Harkness, R. P. 1990, Reports on Progress in Physics, 53, 1467, doi: 10.1088/0034-4885/53/12/001
1990 doi
-
[82]
Haxton, W. C. 1990, ApJ, 356, 272, doi: 10.1086/168839
1990 doi
-
[83]
E., & Heger, A
Woosley, S. E., & Heger, A. 2015, ApJ, 810, 34, doi: 10.1088/0004-637X/810/1/34
2015 doi
-
[84]
E., Heger, A., & Weaver, T
Woosley, S. E., Heger, A., & Weaver, T. A. 2002, Reviews of Modern Physics, 74, 1015, doi: 10.1103/RevModPhys.74.1015
2002 doi
- [85]
-
[86]
2023, Nature, 618, 712, doi: 10.1038/s41586-023-06028-1 21
Xing, Q.-F., Zhao, G., Liu, Z.-W., et al. 2023, Nature, 618, 712, doi: 10.1038/s41586-023-06028-1 21
2023 doi
Reviewed August 6, 2026 · model on record in the stance chip above.
Discussion (0). Continue with ORCID to comment.