REVIEW 4 major objections 6 minor 31 references
Lightcurves of stars in the Chamaeleon I Association
T0 review · 4 major / 6 minor · reviewed 2026-08-06 · deepseek-v4-flash
Pith's one-line read This paper presents the first optical variability study of the Chamaeleon I association, identifying 73 astrometric members and classifying 28 of them as variables, mostly T Tauri and Orion stars.
desk verdict Useful first optical variability survey of Cha I, but the published period-to-source mapping contradicts the figure captions, so the catalog needs a careful correction pass before any science can rely on it. read the letter →
The pith
A machine-rendered reading of the paper's core claim, the machinery that carries it, and where it could break.
The reading
What carries the argument
The argument is carried by the membership selection and the period-analysis pipeline. Membership rests on a hand-defined box in distance-proper-motion space (distance 170-210 pc and proper motion 20-25 mas/yr) combined with HDBSCAN density-based clustering at membership probability above 0.5, producing the 73-member list that ties the light curves to the association. Periods come from Lomb-Scargle, discrete Fourier transform, and ANOVA periodograms run in Peranso, with a false-alarm-probability threshold of $\log \mathrm{FAP} \ge -2$ and cross-checks against Astropy's Lomb-Scargle implementation. Spectral types are assigned automatically with MKCLASS using two standard libraries, with visual inspection used to settle disagreements between libraries.
What would settle it
Take the members that do not appear in the independent Gaia-ESO membership list and measure their lithium absorption at 6708 angstroms and H-alpha emission; if a substantial fraction, say more than 20 percent, show no youth indicators, then the membership list is contaminated and the assigned periods and variability types are not securely tied to Chamaeleon I.
Extended reading notes
Core claim
The paper's central claim is that optical light curves of Chamaeleon I members can be obtained and that their variability is classifiable. From 92 stars with astrometric data, 73 are identified as association members; 55 yield Gaia G-band light curves and 69 yield NEOWISE/AllWISE light curves. For 28 members the variability type is determined, mostly T Tauri and Orion variables, with amplitudes typically near 0.3 mag and periods averaging about 6.3 days, the longest near 96 days. Spectral classification assigns most members to cool M-type stars and flags a few possible chemically peculiar candidates, and the phase curves show the irregular, low-amplitude behavior expected of young, accreting, spot-dominated stars.
Load-bearing premise
The whole analysis leans on the astrometric membership list, which was drawn by hand in distance and proper-motion space and by density-based clustering, without quality cuts on the parallax data and without any independent youth indicators.
Editorial extensions
If this is right
- The catalog supplies periods, amplitudes, and spectral types for 28 variable members, giving future follow-up a target list of the clearest T Tauri and Orion variables.
- The typical 0.3 mag optical amplitudes establish a baseline for multi-epoch monitoring of this association and support the picture that the variability is driven by spots and accretion rather than large eclipses.
- The possible chemically peculiar stars among the members, if confirmed, would be unusual in a roughly 2 Myr population and would motivate high-resolution spectroscopic checks.
- The paper's distance estimate of about 190 pc, if correct, shifts the association relative to earlier 160-170 pc measurements and therefore changes derived luminosities and ages.
Reading between the lines
- A natural next test is to compare the members that do not appear in the independent Gaia-ESO membership list against lithium and H-alpha emission, which would show whether the astrometric-only membership is contaminated or incomplete.
- Multi-season Gaia and NEOWISE data could check whether the 96-day period and other long periods are stable; stable periods would favor rotational or disk modulation, while drifting periods would point to accretion-driven changes.
- If the chemically peculiar candidates survive higher-resolution classification, they would be an anomaly for a pre-main-sequence association and could indicate that some astrometric 'members' are field interlopers.
Editorial analysis
A structured set of objections, weighed in public.
Referee Report
Summary. The manuscript reports an optical variability study of stars in the Chamaeleon I association. Using Gaia DR3 astrometry, 73 of 92 observed targets are assigned membership via a hand-drawn distance–proper-motion box plus HDBSCAN clustering. The authors extract Gaia G-band and NEOWISE light curves, determine periods with Peranso (Lomb-Scargle, DFT, ANOVA) and validate with Astropy, cross-match to VSX for variability types, and classify spectra with MKCLASS. The main products are a member list, spectral types, periods, amplitudes, and variability types for 28–29 stars, mostly T Tauri and Orion variables.
Significance. If the catalog were internally consistent, this would be the first optical variability study of Chamaeleon I and would provide a useful resource for studying low-mass pre-main-sequence variability, with the strength of using archival Gaia and NEOWISE data and standard, reproducible tools. The paper also makes a falsifiable claim about the period distribution (average ~6.3 d). However, the current internal inconsistencies in the period–source mapping and the unvalidated membership selection mean the catalog cannot yet be used as published. The authors deserve credit for presenting the light curves and for checking against the Gaia DR3 variability catalogue.
major comments (4)
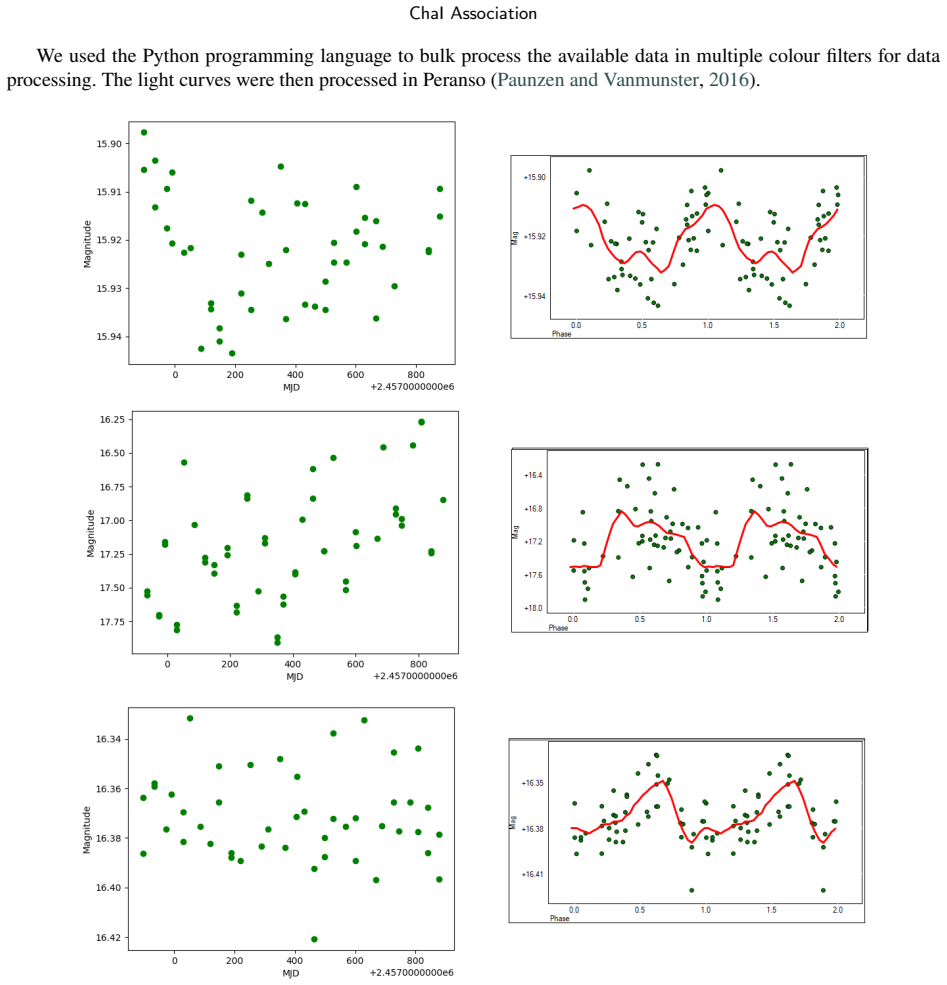
- [§5.1, Table 4, Figs. 8–12] The period-to-source mapping is internally inconsistent between Table 4 and the figure captions. For example, Fig. 8 left assigns P=5.1704 d to Gaia DR3 5201347064956072448, while Table 4 gives that source P=1.055 d and assigns P=5.1704 d to 5201350019893311744. Fig. 9 left shows 5201201139145692800 with P=1.1688 d, while Table 4 assigns P=1.1688 d to 5201303325008889856. Fig. 10 left shows 5201129705249611008 with P=4.8311 d, while Table 4 gives that source P=1.6145 d and assigns P=4.8311 d to 5201129292932746880. Fig. 12 left shows 5201181313576638208 as an EB with P=0.8509 d, while Table 4 gives this source EB P=1.6314 d and assigns P=0.8509 d to 5201378641555926784. Because the central deliverable is a period catalog, the mapping must be made unique and self-consistent; currently the published periods cannot be reproduced from the paper.
- [§4.1] The adopted significance criterion 'log FAP ≥ −2' appears to be inverted. A false-alarm probability FAP is a probability, so log10(FAP) ≥ −2 corresponds to FAP ≥ 0.01; this would accept periodogram peaks that are not significant at the 1% level. If the intended cutoff is FAP ≤ 0.01 (log10 FAP ≤ −2), please state this explicitly and apply it consistently, since this threshold controls which light curves are classified as periodic.
- [§2, Table 1] The membership selection, which underpins the association-specific claims, is not robustly validated. The initial box in distance–proper-motion space is chosen by eye (170–210 pc, 20–25 mas/yr), no cuts on parallax quality are applied, and the HDBSCAN probability threshold p>0.5 is adopted without a sensitivity test. The authors themselves report only ~63% overlap with the Gaia-ESO membership of Gutiérrez Albarrán et al. (2020) and a distance of ~190 pc versus 160–170 pc in earlier works. Please add a quantitative comparison with published membership lists and an assessment of how contamination/incompleteness affects the derived variability fractions and the claim that these are Cha I members.
- [Table 4] Table 4 contains duplicate and incomplete entries that make the variability-type catalog ambiguous. Sources 5201378641555926784, 5201153172951606784, 5201308101012353664, and 5201303325008889856 each appear twice, sometimes with different periods or variability flags, and several rows have P='-' while still being listed as variable types. Please restructure the table to one row per source, with a single period and type, and reconcile it with the figures.
minor comments (6)
- [Table 2] Table 2 lists several sources twice (e.g., 5201296727939072384, 5201343693404220800, 5224581944675548032); please remove duplicates or annotate them as repeated observations.
- [References] The Baluev (2008) reference in the bibliography has a garbled title ('The AstropMonthly Notices of the Royal Astronomical Societyhysical Journal'); please correct the journal and title.
- [§4.1, Acknowledgments] In §4.1, the sentence introducing ANOVA ('eclipsing variable stars of the (Knote et al., 2019) type') is missing words; also the CRediT statement in the acknowledgments appears to contain funding text rather than author contributions.
- [§4.1] The minimum period of 0.5 d imposed in the frequency search is mentioned only in passing; please state explicitly that periods shorter than 0.5 d cannot be detected, as this is a completeness limit of the catalog.
- [Fig. 3] Figure 3 caption is confusing: 'from top to bottom; Left: ... Right: ...' Please rephrase to clarify which panel corresponds to which source.
- [Abstract, §5.1] The abstract and §5.1 give different numbers for the stars with determined variability types (28 vs 29); please harmonize.
Circularity Check
No circular derivation; the catalog is observational, with only a minor non-load-bearing self-citation for the FAP threshold.
full rationale
The paper is an observational catalog, not a derivation of a prediction from fitted parameters. Membership is defined by an astrometric box plus HDBSCAN; although the box is chosen 'from looking at the distribution' (Sec. 2), it is an operational selection criterion, and the paper does not present the resulting membership or distance as a theoretically predicted quantity. Periods are extracted by Lomb-Scargle/ANOVA and cross-checked with Astropy and VSX; variability types are adopted from VSX, so no type is derived from a model fitted to the same data. The one self-citation, Paunzen et al. (2024), sets the FAP threshold log FAP >= -2; it is a statistical calibration from an external Kepler sample and does not determine any specific period, amplitude, or variability class, hence it is not load-bearing. The paper itself flags limitations such as astrometry-only membership, 63% overlap with Gutiérrez Albarrán et al. (2020), the 190 pc versus 160-170 pc distance discrepancy, and low-quality spectra; these are selection and correctness risks, not circularity. The figure/table period-ID mismatches noted by the skeptic are internal reproducibility defects, not circular reasoning. Therefore no circular step is identified; score 2 reflects only the minor self-citation.
Assumptions & free parameters
free parameters (4)
- Membership box boundaries in distance and proper motion =
d in [170, 210] pc; mu in [20, 25] mas/yr
- HDBSCAN membership probability threshold =
p > 0.5
- FAP threshold for periodicity =
log FAP >= -2
- Minimum period floor =
0.5 days
assumptions (5)
- domain assumption The box in distance-proper-motion space isolates Chamaeleon I members
- domain assumption MKCLASS libnor36 classifications are reliable for these low-S/N spectra
- domain assumption VSX variability types are usable as ground truth
- ad hoc to paper The FAP threshold from Paunzen et al. (2024) applies to this dataset
- domain assumption Gaia and NEOWISE time sampling is sufficient to recover the reported periods
Cite this review
Pith. "Pith review of Lightcurves of stars in the Chamaeleon I Association." pith.science (2026). https://pith.science/paper/KILP6YBS
@misc{pith2026250722023,
  author       = {Pith},
  title        = {Pith review of: Lightcurves of stars in the Chamaeleon I Association},
  year         = {2026},
  howpublished = {\url{https://pith.science/paper/KILP6YBS}},
  note         = {Machine review of arXiv:2507.22023}
}
read the original abstract
Star-forming regions are essential for studying very young stellar objects of various masses. They still contain a significant amount of dust and gas. We present a study of light curves of stars in the field of the Chamaeleon I association. We use automatic spectral classification with MKCLASS to identify the spectral types of the stars in the field with a light curve from the NEOWISE and Gaia surveys. The light curves are analysed using the software Peranso and astropy. We also used VSX to identify the variability type. Based on astrometry, we have identified 92 stars, 73 of which are members of the association. We received light curves for 55 stars from the Gaia survey and for 69 stars from the ALLWISE/NEOWISE survey. For 28 of them, it was possible to determine the types of variables, mostly T Tauri and Orion variables. The spectral types of the members are mostly cooler M-type stars, with one being a possible chemically peculiar (CP) star. The non-members associated with light curve measurements include spectral types A-G with one CP candidate.
Figures


Figures from the paper (9 more)


Reference graph
Works this paper leans on
-
[2]
URL: https://doi.org/10.21105%2Fjoss.00205, doi:10.21105/joss.00205. Paunzen, E., Binder, F., Cyniburk, A., Duffek, M.N., Haberhauer, F., Heinreichsberger, C., Kohlhofer, H., Kueß, L., Maitzen, H.M., Saalmann, T., Schanz, A.M., Schauer, S., Schmidt, K., Tokareva, A., Wizani, I.,
-
[9]
Astronomy & Astrophysics 595, A1
The Gaia mission. Astronomy & Astrophysics 595, A1. doi:10.1051/0004-6361/201629272, arXiv:1609.04153. GaiaCollaboration,Vallenari,A.,Brown,A.G.A.,Prusti,T.,deBruijne,J.H.J.,Arenou,F.,Babusiaux,C.,Biermann,M.,Creevey,O.L.,Ducourant, C., Evans, D.W., Eyer, L., Guerra, R., Hutton, A., Jordi, C., Klioner, S.A., Lammers, U.L., Lindegren, L., Luri, X., Mignard...
-
[17]
A plethora of new, magnetic chemically peculiar stars from LAMOST DR4
A plethora of new, magnetic chemically peculiar stars from LAMOST DR4. Astronomy & Astrophysics 640, A40. doi:10.1051/0004-6361/202037750, arXiv:2005.14444. Joshi, G.,
work page Pith review arXiv 2005
-
[18]
Knote, M.F., Kaitchuck, R.H., Berrington, R.C.,
A package for the automated classification of periodic variable stars URL:https://arxiv.org/abs/ 1512.01611, doi:10.48550/ARXIV.1512.01611. Knote, M.F., Kaitchuck, R.H., Berrington, R.C.,
-
[19]
Observations and preliminary modeling of the light curves of eclipsing binary systems nsvs 7322420 and nsvs 5726288. URL:https://arxiv.org/abs/1910.07627, doi:10.48550/ARXIV.1910.07627. Kubiak,K.,Mužić,K.,Sousa,I.,Almendros-Abad,V.,Köhler,R.,Scholz,A.,2021.Newlow-massmembersofChamaeleonIand 𝜀Cha.Astronomy & Astrophysics 650, A48. doi:10.1051/0004-6361/202...
work page Pith review arXiv doi:10.48550/arxiv.1910.07627 1910
-
[28]
Photometric variability of the pre-main sequence stars towards the Sh 2-190 region
Photometric VariabilityofthePre-main-sequenceStarstowardtheSh2-190Region.TheAstrophysicalJournal921,165.doi: 10.3847/1538-4357/ac1bbc, arXiv:2108.02107. Smith, G.A., Saunders, W., Bridges, T., Churilov, V., Lankshear, A., Dawson, J., Correll, D., Waller, L., Haynes, R., Frost, G.,
-
[29]
(Eds.), Ground-based Instrumentation for Astronomy, pp
AAOmega: a multipurpose fiber-fed spectrograph for the AAT, in: Moorwood, A.F.M., Iye, M. (Eds.), Ground-based Instrumentation for Astronomy, pp. 410–420. doi:10.1117/12.551013. K. Neumannova et al.:Preprint submitted to Elsevier Page 23 of 24 ChaI Association Watson,C.L.,Henden,A.A.,Price,A.,2006. TheInternationalVariableStarIndex(VSX). SocietyforAstrono...
-
[30]
McInnes, L., Healy, J., Astels, S.,
URL:http: //dx.doi.org/10.1088/0004-637X/792/1/30, doi:10.1088/0004-637x/792/1/30. McInnes, L., Healy, J., Astels, S.,
Show all 31 references
-
[31]
Astronomy & Astrophysics 633, A51
A compendium of distances to molecular clouds in the Star Formation Handbook. Astronomy & Astrophysics 633, A51. doi:10.1051/0004-6361/201936145, arXiv:2001.00591. Zwintz,K.,Fossati,L.,Ryabchikova,T.,Guenther,D.,Aerts,C.,Barnes,T.G.,Themeßl,N.,Lorenz,D.,Cameron,C.,Kuschnig,R.,...
2001 arXiv
-
[65]
Roccatagliata, V., Sacco, G.G., Franciosini, E., Randich, S.,
URL: https://dx.doi.org/10.1088/0004-637X/755/1/65, doi:10.1088/0004-637X/755/1/65. Roccatagliata, V., Sacco, G.G., Franciosini, E., Randich, S.,
-
[71]
Flaherty, K.M., DeMarchi, L., Muzerolle, J., Balog, Z., Herbst, W., Megeath, S.T., Furlan, E., Gutermuth, R.,
URL:http://dx.doi.org/10.3847/1538-3881/aacead, doi:10.3847/1538-3881/aacead. Flaherty, K.M., DeMarchi, L., Muzerolle, J., Balog, Z., Herbst, W., Megeath, S.T., Furlan, E., Gutermuth, R.,
-
[80]
doi:10.1088/0004-6256/147/4/80. Günther, H.M., Cody, A.M., Covey, K.R., Hillenbrand, L.A., Plavchan, P., Poppenhaeger, K., Rebull, L.M., Stauffer, J.R., Wolk, S.J., Allen, L., Bayo, A., Gutermuth, R.A., Hora, J.L., Meng, H.Y.A., Morales-Calderón, M., Parks, J.R., Song, I.,
-
[122]
doi:10.1088/0004-6256/148/6/122, arXiv:1408.3063. Gutiérrez Albarrán, M.L., Montes, D., Gómez Garrido, M., Tabernero, H.M., González Hernández, J.I., Marfil, E., Frasca, A., Lanzafame, A.C., Klutsch, A., Franciosini, E., Randich, S., Smiljanic, R., Korn, A.J., Gilmore, G., Alf...
- [147]
-
[167]
Bailer-Jones, C.A.L., Rybizki, J., Fouesneau, M., Demleitner, M., Andrae, R.,
doi:10.3847/1538-4357/ac7c74, arXiv:2206.14220. Bailer-Jones, C.A.L., Rybizki, J., Fouesneau, M., Demleitner, M., Andrae, R.,
-
[348]
doi:10.1086/301430, arXiv:astro-ph/0003307
The Astronomical Journal 120, 349–366. doi:10.1086/301430, arXiv:astro-ph/0003307. Horne, J.H., Baliunas, S.L.,
-
[757]
Hümmerich, S., Paunzen, E., Bernhard, K.,
doi:10.1086/164037. Hümmerich, S., Paunzen, E., Bernhard, K.,
-
[1974]
Annual Review of Astronomy and Astrophysics 12, 257–277
The chemically peculiar stars of the upper main sequence. Annual Review of Astronomy and Astrophysics 12, 257–277. doi:10.1146/annurev.aa.12.090174.001353. Rice, T.S., Wolk, S.J., Aspin, C.,
-
[2004]
The Astrophysical Journal 602, 816–842
A Census of the Chamaeleon I Star-forming Region. The Astrophysical Journal 602, 816–842. doi:10.1086/381146, arXiv:astro-ph/0402509. Luhman, K.L.,
-
[2007]
The Astrophysical Journals 173, 104–136
The Stellar Population of the Chamaeleon I Star-forming Region. The Astrophysical Journals 173, 104–136. doi:10.1086/ 520114, arXiv:0710.3037. Mainzer, A., Bauer, J., Cutri, R.M., Grav, T., Masiero, J., Beck, R., Clarkson, P., Conrow, T., Dailey, J., Eisenhardt, P., Fabinsky, ...
-
[2008]
The AstropMonthly Notices of the Royal Astronomical Societyhysical Journal 385, 1279–1285
Assessing the statistical significance of periodogram peaks. The AstropMonthly Notices of the Royal Astronomical Societyhysical Journal 385, 1279–1285. doi:10.1111/j.1365-2966.2008.12689.x, arXiv:0711.0330. Baraffe, I., Homeier, D., Allard, F., Chabrier, G.,
2008
-
[2014]
Science 345, 550–553
Echography of young stars reveals their evolution. Science 345, 550–553. doi:10.1126/science.1253645, arXiv:1407.4928. K. Neumannova et al.:Preprint submitted to Elsevier Page 24 of 24
-
[2015]
Astronomy & Astrophysics 577, A42
New evolutionary models for pre-main sequence and main sequence low-mass stars down to the hydrogen-burning limit. Astronomy & Astrophysics 577, A42. doi:10.1051/0004-6361/201425481, arXiv:1503.04107. Bhardwaj, A., Panwar, N., Herczeg, G.J., Chen, W.P., Singh, H.P.,
-
[2016]
TheAstrophysicalJournal833,104
Spitzer Observations of Long-termInfraredVariabilityamongYoungStellarObjectsinChamaeleonI. TheAstrophysicalJournal833,104. doi: 10.3847/1538-4357/ 833/1/104, arXiv:1609.09100. Gaia Collaboration, Prusti, T., de Bruijne, J.H.J., Brown, A.G.A., Vallenari, A., Babusiaux, C., Bail...
-
[2018]
Astronomy & Astrophysics 617, L4
The double population of Chamaeleon I detected by Gaia DR2. Astronomy & Astrophysics 617, L4. doi:10.1051/0004-6361/201833890, arXiv:1808.06931. Scargle,J.D.,1982. Studiesinastronomicaltimeseriesanalysis.II.Statisticalaspectsofspectralanalysisofunevenlyspaceddata. TheAstrophys...
1982 arXiv
-
[2019]
Astronomy & Astrophysics 627, A135
Variability of young stellar objects in the star-forming region Pelican Nebula. Astronomy & Astrophysics 627, A135. doi:10.1051/0004-6361/201935418, arXiv:1906.00256. Campello, R., Moulavi, D., Sander, J.,
1906 arXiv
-
[2020]
The Gaia-ESO Survey: Calibrating the lithium-age relation with open clusters and associations. I. Cluster age range and initial membership selections. Astronomy & Astrophysics 643, A71. doi:10.1051/0004-6361/202037620, arXiv:2009.00610. Herbst, W., Maley, J.A., Williams, E.C.,
-
[2021]
Reviews of Modern Physics 93, 015001
Probing the interior physics of stars through asteroseismology. Reviews of Modern Physics 93, 015001. doi:10.1103/ RevModPhys.93.015001, arXiv:1912.12300. Astropy Collaboration, Price-Whelan, A.M., Lim, P.L., Earl, N., Starkman, N., Bradley, L., Shupe, D.L., Patil, A.A., Corra...
1912 arXiv
-
[2022]
arXiv e-prints , arXiv:2208.00211doi:10.48550/arXiv.2208.00211, arXiv:2208.00211
Gaia Data Release 3: Summary of the content and survey properties. arXiv e-prints , arXiv:2208.00211doi:10.48550/arXiv.2208.00211, arXiv:2208.00211. Gaia Collaboration, Vallenari, A., Brown, A. G. A., Prusti, T., de Bruijne, J. H. J., Arenou, F., Babusiaux, C., Biermann, M., C...
-
[2023]
A&A 674, A1
Gaia data release 3 - summary of the content and survey properties. A&A 674, A1. URL:https://doi.org/10.1051/0004-6361/202243940, doi:10.1051/0004-6361/202243940. Gray,R.O.,Corbally,C.J.,2014. AnExpertComputerProgramforClassifyingStarsontheMKSpectralClassificationSystem. TheAs...
2014 doi
-
[2024]
Astronomy & Astrophysics 687, A208
Apparent non-variable stars from the Kepler mission. Astronomy & Astrophysics 687, A208. doi:10.1051/0004-6361/202244572, arXiv:2406.06174. Paunzen,E.,Vanmunster,T.,2016. Peranso-Lightcurveandperiodanalysissoftware. AstronomischeNachrichten337,239. doi: 10.1002/asna. 201512254...
2016 arXiv
Reviewed August 6, 2026 · model on record in the stance chip above.
Discussion (0). Sign in to comment.