On the impact of the turbulent grazing flow development on the acoustic response of an acoustic liner
Pith reviewed 2026-05-21 23:47 UTC · model grok-4.3
The pith
Turbulent boundary layer growth alters acoustic dissipation along an acoustic liner by weakening downstream orifice shear layers.
A machine-rendered reading of the paper's core claim, the machinery that carries it, and where it could break.
Core claim
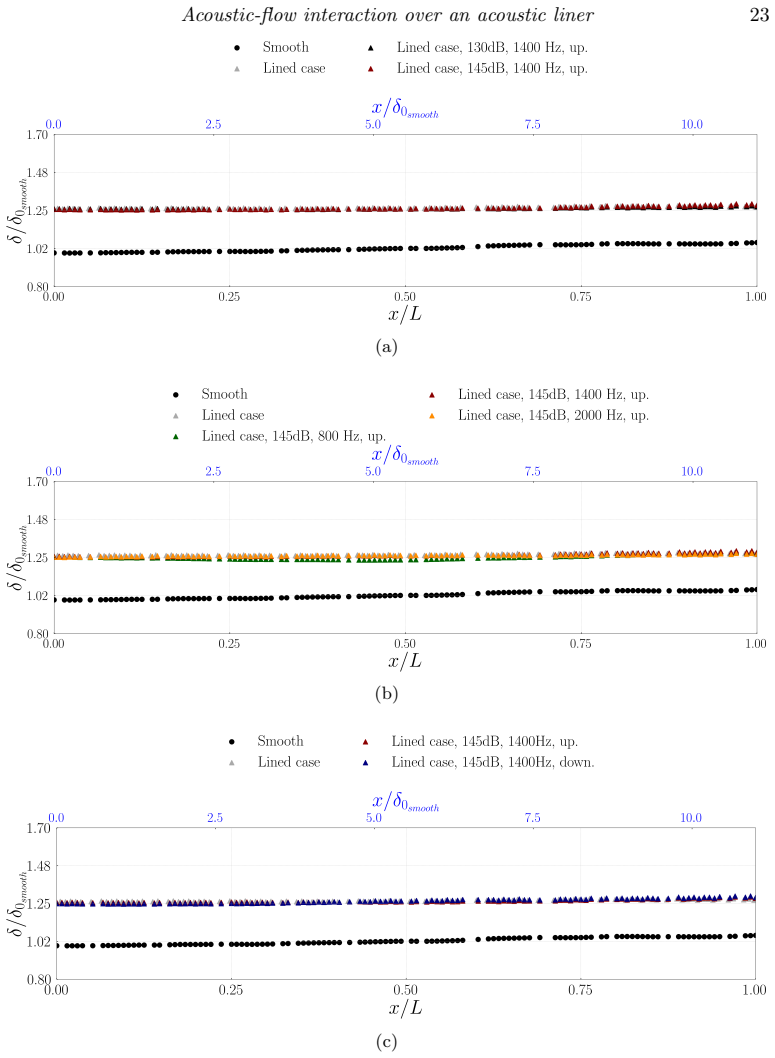
The boundary layer displacement thickness δ* grows along the streamwise direction over the liner, producing localized humps immediately downstream of each orifice. Orifices displace the grazing flow away from the face sheet, an effect strengthened by acoustic waves and dependent on propagation direction. The resulting increase in δ* weakens the shear layer at downstream positions, thereby modifying the acoustic-induced mass flow rate through the orifices and causing acoustic energy to be dissipated differently along the liner length.
What carries the argument
The streamwise growth of boundary-layer displacement thickness δ*, which progressively weakens orifice shear layers and modulates acoustic mass flow.
If this is right
- In-situ impedance shows strong spatial variations while averaged values remain similar for opposite wave directions.
- Mode-matching reveals clearer differences between upstream- and downstream-propagating waves.
- Acoustic energy dissipation varies along the liner because of changing near-wall flow features.
- Current impedance eduction methods omit the effect of spatially developing turbulent flow.
Where Pith is reading between the lines
- Liner performance in long ducts may vary with position because of cumulative boundary-layer growth.
- Accounting for flow development could improve accuracy when extrapolating short-sample impedance data to full-scale applications.
- Similar position-dependent effects may appear in other perforated surfaces exposed to grazing flow.
Load-bearing premise
The simulations faithfully reproduce the experimental boundary-layer development and orifice flows without significant numerical or modeling errors that would mask the reported spatial variations.
What would settle it
Experiments that measure constant δ* along the liner or uniform acoustic mass-flow rates through every orifice regardless of streamwise position would falsify the claim.
Figures


read the original abstract
The interaction between acoustic waves and turbulent grazing flow over an acoustic liner is investigated using Lattice-Boltzmann Very-Large-Eddy simulations. A single-degree-of-freedom liner with 11 streamwise-aligned cavities is studied in a grazing flow impedance tube. The conditions replicate reference experiments from the Federal University of Santa Catarina. The influence of grazing flow (with a centerline Mach of 0.32), acoustic wave amplitude, frequency, and propagation direction relative to the mean flow is analysed. Impedance is computed using both the in-situ and the mode-matching methods. The in-situ method reveals strong spatial variations; however, averaged values throughout the sample show minimal differences between upstream and downstream propagating waves, in contrast to the mode-matching method. Flow analyses reveal that the orifices displace the flow away from the face sheet, with this effect amplified by acoustic waves and dependent on the wave propagation direction. Consequently, the boundary layer displacement thickness (${\delta}$*) increases along the streamwise direction compared to a smooth wall and exhibits localised humps downstream of each orifice. The growth of ${\delta}$* alters the flow dynamics within the orifices by weakening the shear layer at downstream positions. This influences the acoustic-induced mass flow rate through the orifices, suggesting that acoustic energy is dissipated differently along the liner. The role of near-wall flow features highlights the need to consider a spatially evolving turbulent flow when studying the acoustic-flow interaction and measuring impedance. The spatial development of the turbulent flow may also partly explain the upstream-downstream impedance differences, as current eduction methods do not account for it.
Editorial analysis
A structured set of objections, weighed in public.
Referee Report
Summary. The paper investigates the interaction between acoustic waves and a developing turbulent grazing flow over a single-degree-of-freedom acoustic liner with 11 streamwise-aligned cavities using Lattice-Boltzmann Very-Large-Eddy Simulations (LBM-VLES). Replicating reference experiments at a centerline Mach number of 0.32, impedance is computed via both in-situ and mode-matching methods, revealing strong spatial variations in the former. Flow diagnostics show that orifices displace the flow, increasing boundary-layer displacement thickness δ* along the streamwise direction with localized humps, which in turn weakens downstream orifice shear layers, alters acoustic-induced mass flow rates, and produces spatially varying acoustic dissipation. The work concludes that spatially evolving turbulent flow must be accounted for in impedance measurements and may partly explain upstream-downstream differences.
Significance. If the LBM-VLES faithfully reproduces the experimental boundary-layer growth and near-orifice structures, the results would establish a concrete physical link between streamwise δ* evolution and spatially nonuniform dissipation, providing a mechanistic explanation for impedance asymmetries that current uniform-flow eduction methods cannot capture. The direct coupling of flow-field diagnostics to both in-situ and mode-matching impedance calculations is a notable strength.
major comments (1)
- [Flow analyses (abstract and §4)] The central claim that δ* growth weakens downstream orifice shear layers and thereby changes acoustic mass flow (abstract and flow-analyses section) is load-bearing for the reported spatial dissipation variations. No quantitative validation of simulated mean velocity profiles, turbulence intensity, or δ* evolution at multiple streamwise stations against the Santa Catarina reference experiments is presented; without such metrics it remains possible that numerical dissipation or sub-grid modeling in the LBM-VLES artificially produces the observed trends.
minor comments (1)
- [Abstract] The abstract states that in-situ impedance shows strong spatial variations yet averaged values exhibit minimal upstream-downstream differences, but supplies no quantitative error bars, grid-convergence data, or explicit validation metrics against the reference experiments.
Simulated Author's Rebuttal
We thank the referee for the constructive review and for recognizing the potential significance of linking boundary-layer evolution to spatially varying dissipation. We address the single major comment below and outline the changes planned for the revised manuscript.
read point-by-point responses
-
Referee: The central claim that δ* growth weakens downstream orifice shear layers and thereby changes acoustic mass flow (abstract and flow-analyses section) is load-bearing for the reported spatial dissipation variations. No quantitative validation of simulated mean velocity profiles, turbulence intensity, or δ* evolution at multiple streamwise stations against the Santa Catarina reference experiments is presented; without such metrics it remains possible that numerical dissipation or sub-grid modeling in the LBM-VLES artificially produces the observed trends.
Authors: We agree that quantitative validation of the simulated mean flow and turbulence quantities would strengthen in the reported δ* growth mechanism. The present manuscript replicates the experimental geometry, Mach number (0.32), and acoustic conditions but does not include side-by-side comparisons of velocity profiles, turbulence intensity, or δ* at multiple streamwise stations. In the revised version we will add these comparisons, using both the available experimental reference data and the expected turbulent boundary-layer scaling, together with a brief discussion of grid resolution and sub-grid modeling sensitivity. We note that the observed spatial trends in orifice mass flow and in-situ impedance remain consistent with the physical picture of orifice-induced displacement thickening, independent of the precise numerical values of δ*. revision: yes
Circularity Check
No significant circularity in derivation chain
full rationale
The paper reports results from Lattice-Boltzmann Very-Large-Eddy simulations of acoustic-flow interaction over a liner, with claims about streamwise δ* growth, orifice shear-layer weakening, and spatially varying acoustic mass flow derived directly from the simulated velocity fields and mass-flow diagnostics. No equations are presented that reduce these observations to quantities defined by the same fitted data or target acoustic results. Impedance values are computed via standard in-situ and mode-matching post-processing of the simulation outputs rather than by construction from the reported trends. The work replicates external experimental conditions but does not invoke self-citations as load-bearing uniqueness theorems or smuggle ansatzes; the derivation remains independent of the specific spatial dissipation differences it reports.
Axiom & Free-Parameter Ledger
Lean theorems connected to this paper
-
IndisputableMonolith/Cost/FunctionalEquation.leanwashburn_uniqueness_aczel unclear?
unclearRelation between the paper passage and the cited Recognition theorem.
The growth of δ* alters the flow dynamics within the orifices by weakening the shear layer at downstream positions. This influences the acoustic-induced mass flow rate through the orifices, suggesting that acoustic energy is dissipated differently along the liner.
-
IndisputableMonolith/Foundation/RealityFromDistinction.leanreality_from_one_distinction unclear?
unclearRelation between the paper passage and the cited Recognition theorem.
Impedance is computed using both the in-situ and the mode-matching methods.
What do these tags mean?
- matches
- The paper's claim is directly supported by a theorem in the formal canon.
- supports
- The theorem supports part of the paper's argument, but the paper may add assumptions or extra steps.
- extends
- The paper goes beyond the formal theorem; the theorem is a base layer rather than the whole result.
- uses
- The paper appears to rely on the theorem as machinery.
- contradicts
- The paper's claim conflicts with a theorem or certificate in the canon.
- unclear
- Pith found a possible connection, but the passage is too broad, indirect, or ambiguous to say the theorem truly supports the claim.
Forward citations
Cited by 1 Pith paper
-
Realistic sheared flow profile effects on acoustic impedance eduction in small 3D-ducts
Realistic sheared flow profiles in small 3D ducts can be approximated by uniform or 1D profiles for acoustic impedance eduction when the bulk Mach number is correctly accounted for.
discussion (0)
Sign in with ORCID, Apple, or X to comment. Anyone can read and Pith papers without signing in.