REVIEW 4 major objections 5 minor 1 cited by
Universal Patterns in the Blockchain: Analysis of EOAs and Smart Contracts in ERC20 Token Networks
T0 review · 4 major / 5 minor · reviewed 2026-08-05 · deepseek-v4-flash
Pith's one-line read This paper claims that human and automated Ethereum accounts leave statistically distinguishable, time-persistent scaling signatures in ERC20 token transfers: human activity is near-universal, contract activity is contextual and volatile.
desk verdict Useful empirical split between human- and contract-driven ERC20 activity, but the abstract overstates the stability of EOA power-law exponents; worth peer review with revisions. read the letter →
The pith
A machine-rendered reading of the paper's core claim, the machinery that carries it, and where it could break.
The reading
What carries the argument
The argument is carried by a four-way transaction classification (EOA-to-EOA, EOA-to-contract, contract-to-EOA, contract-to-contract) built from the dataset's sender-contract and receiver-contract flags, combined with two canonical scaling tools: the volume-partner relation $V \sim N^\alpha$ and temporal Taylor's law $\sigma^2 = a\mu^\beta$, with power-law distributions $p(x) \propto x^{-\gamma}$ fitted by maximum likelihood and validated by Kolmogorov-Smirnov distances and log-likelihood ratios against an exponential. The four-way classification is the load-bearing object; the contrast between stable human-side exponents and drifting contract-side exponents is the evidence.
What would settle it
Take a random sample of addresses the dataset flags as externally owned, check the Ethereum chain state at those times to see whether each address actually has code, then re-fit $\alpha$, $\gamma$, and $\beta$ after correcting mislabeled cases. If corrected EOA-EOA exponents become unstable or corrected contract-contract exponents become near-linear, the reported contrast is a labeling artifact.
Extended reading notes
Core claim
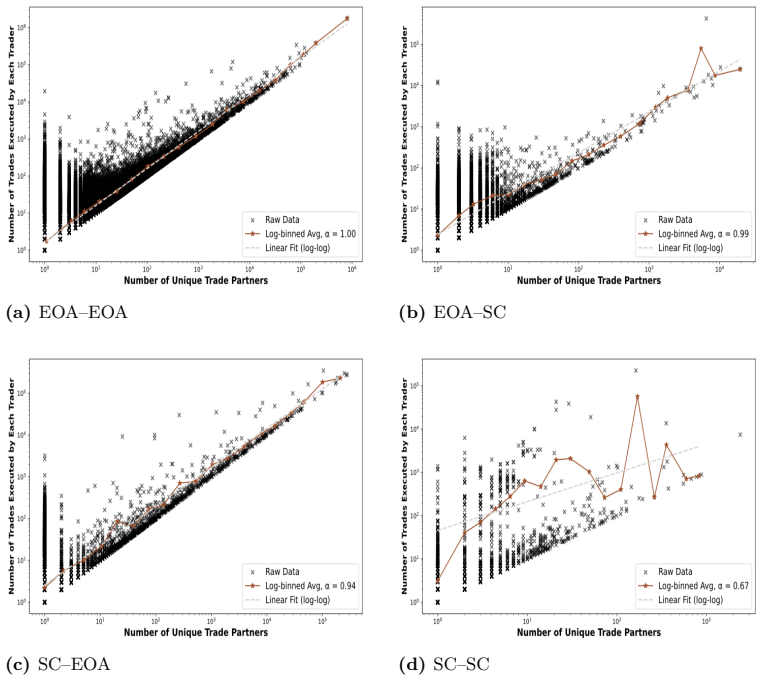
The central discovery is that ERC20 transaction statistics split cleanly along the EOA/smart-contract boundary. EOA-to-EOA and EOA-to-contract transactions show stable, near-universal exponents: volume grows nearly linearly with partner diversity, transaction counts follow power laws with $\gamma \approx 2.3$ whose thresholds are small and whose fits are good, and hourly variance obeys Taylor's law with $\beta \approx 2.3$ over every period. Smart-contract-to-contract transactions behave differently: volume growth is increasingly sublinear, power-law fits require very high thresholds and show larger errors and KS distances, and Taylor exponents wander, with the sender exponent dropping to $1
Load-bearing premise
The whole human-versus-algorithm contrast depends on the dataset's contract flags being correct; if addresses are mislabeled, the two statistical signatures blur together and the claimed universal split disappears.
Editorial extensions
If this is right
- EOA-to-EOA and EOA-to-contract activity can be modeled as approximately universal: $\alpha \approx 1$, $\gamma \approx 2.3$ and $\beta \approx 2.3$ hold across nine months including a major market crash.
- Contract-to-contract activity is not universal: its scaling exponents drift over time and its fits degrade, so decentralized-finance models need protocol-specific rather than one-size-fits-all assumptions.
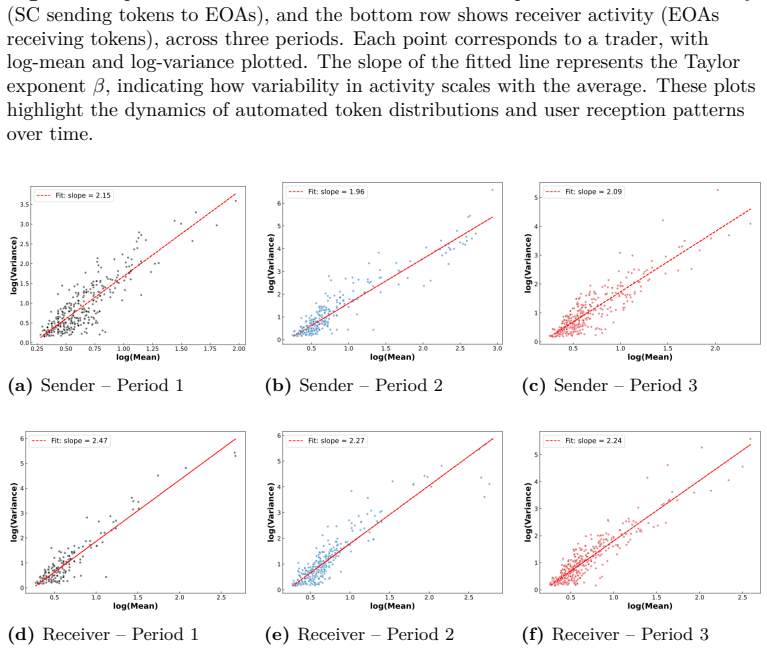
- The Taylor-exponent instability gap ($\Delta\beta = 0.51$ for contract-contract versus $0.17$ for EOA-EOA) provides a quantitative measure of how much more volatile automated flows are than human flows.
- Heavy-tailed contract activity ($\gamma < 2$) means a small set of contracts dominates outgoing or incoming volume, so tail-risk monitoring in ERC20 networks should concentrate on contract-to-contract channels.
Reading between the lines
- The paper never validates the contract flags it relies on; checking a sample of labeled addresses against on-chain bytecode would either confirm the human-versus-algorithm split or reveal it as a labeling artifact.
- The near-quadratic Taylor exponents ($\beta \approx 2.3$) may partly reflect generic overdispersion in zero-inflated hourly counts rather than a specific behavioral mechanism; a zero-inflated or negative-binomial null model would show how much of the scaling is informative.
- If the contrast replicates on other chains, the stable EOA fingerprint could serve as a baseline for anomaly detection in DeFi, flagging addresses whose scaling suddenly becomes contract-like as possible bots or wash traders.
- The EOA-to-contract channel behaves like the human channel rather than the contract channel, suggesting that when a human initiates an interaction, the statistical signature remains human-like even though the counterparty is automated.
Signed reviews
Editorial analysis
A structured set of objections, weighed in public.
Referee Report
Summary. The paper analyzes 44.86 million ERC20 token transfers on Ethereum (July 2017–March 2018), splits them into three three-month periods, and classifies each transfer into EOA–EOA, EOA–SC, SC–EOA, or SC–SC using the fromIsContract/toIsContract flags of the XBlock-ETH dataset. For each class and period it estimates three scaling quantities: the volume–partner exponent α, the power-law tail exponent γ with KS-selected xmin, and the temporal Taylor's law exponent β from hourly mean–variance regressions. The paper's central claim is that EOA-driven transactions show stable, near-universal scaling (γ ≈ 2.3, β ≈ 2.3), while SC-involved transactions, especially SC–SC, show sublinear scaling, unstable exponents, and larger Taylor-exponent fluctuations (ΔβSC–SC = 0.51). The authors interpret this as a statistical distinction between human-controlled and algorithmic behavior in decentralized finance.
Significance. If the quantitative claim were fully supported, the paper would provide a useful, interpretable signature separating human and automated agents in blockchain transaction networks, and it would connect ERC20 activity to scaling laws observed in other social and economic systems. The study has clear strengths: it uses a public dataset, it reports detailed per-period tables (Tables 2, 3, and 5), and it combines two complementary scaling frameworks, power-law analysis and Taylor's law. The qualitative contrast — EOA-side exponents are generally higher and more stable, SC–SC exponents are lower and more variable — is visible in the paper's own tables. However, the specific headline claim of time-persistent 'stable γ ≈ 2.3' is contradicted by Table 3, and the statistical validation of the power-law and Taylor-law fits is incomplete in ways that affect the load-bearing conclusions.
major comments (4)
- [Abstract; Table 3] The abstract's first pillar — 'stable power law exponents (γ ≈ 2.3)' for EOA-driven transactions — is not supported by the paper's own Table 3. The purest EOA-side role, EOA–EOA sender, has γ = 2.32, 2.26, 1.76 across periods, with xmin jumping to 105 in Period 3; EOA–SC receiver falls from 2.07 to 1.89. These values put EOA-side activity into the γ < 2 regime that the paper elsewhere associates with SC-driven activity. The text's explanation that the 2018 crypto crash caused this is a one-off post hoc qualification; it does not rescue an abstract claim of universal, time-persistent behavior. The authors should either restrict the stability claim to Periods 1–2, model the crash period explicitly, or provide a statistical test showing that γ = 1.76 is consistent with γ ≈ 2.3 once xmin and sample-size effects are accounted for.
- [Power Law Distribution; Table 3] The power-law validation is incomplete. The paper reports KS distances and LLR values but no bootstrap goodness-of-fit p-values of the type recommended by Clauset et al. (2009), and it gives no confidence intervals for γ or xmin. The KS acceptance thresholds stated in 'Determining Threshold and Model Evaluation' (D < 0.05 good, D > 0.1 bad) are ad hoc, and xmin is estimated from the same data used to evaluate the fit. Consequently, the reader cannot tell whether the Period 3 EOA–EOA sender value γ = 1.76 is a genuine regime shift or an artifact of threshold selection in a thin tail. Please report full Clauset-style p-values, confidence intervals on γ, and a sensitivity analysis over xmin choices.
- [Stationarity Test Results; Temporal TL Exponent] The >90% KPSS stationarity percentages in Table 4 are not persuasive for hourly count series that are likely zero-inflated. A trader with many zero-activity hours and occasional nonzero hours will pass KPSS almost trivially, and regressing log-variance on log-mean for such sparse series can produce apparent β ≈ 2–2.5 without reflecting a stable fluctuation law. The paper should report the distribution of nonzero hours per trader, the number of traders contributing to each TL fit, and the raw mean–variance scatter with point counts. Without this, the claim that EOA-driven transactions 'adhere to TL with β ≈ 2.3' is not independently grounded.
- [Section 1.1; Table 1] The entire four-way classification relies on the fromIsContract and toIsContract flags in the XBlock-ETH dataset, yet the paper never validates this labeling. Misclassified early contracts, proxy contracts, or multi-sig wallets labeled as EOAs could contaminate the exact buckets on which the human-versus-algorithm contrast depends. Please validate the flags against an independent source (e.g., code existence at the address, contract-creation block, or Etherscan labels) or at least quantify the expected error rate and discuss how it would affect the contrasts in Tables 2, 3, and 5.
minor comments (5)
- [Introduction / organization] The last paragraph of the introduction says 'Section 1.1 presents and discusses the results' and 'Section 1.1 offers concluding remarks,' but the Results and Conclusion sections are not numbered subsections of Section 1.1. Please fix the section cross-references.
- [Table 5 and text near Figure 9] The text says SC–SC sender β drops to 1.96 'during Period 2' and recovers to 2.09 in Period 3, which matches Table 5; but the surrounding sentence for EOA–SC says the sender decreases in Period 3 while receiver increases. Please make the period labels consistent and avoid a possible reading that the SC–SC sender drop occurs in Period 3.
- [Figure 8 caption] The caption says 'Consistent β values (∼ 2) for senders across three periods,' but Table 5 lists EOA–EOA sender β ≈ 2.35. Please write β ≈ 2.3 or 'near-quadratic' rather than '∼2' if the caption is meant to be precise.
- [References] Reference [57] cites 'Is Newey–West optimal among first-order kernels?' by Kolokotrones, Stock, and Walker, but the Newey–West automatic bandwidth estimator is due to Newey and West. Please verify the citation and cite the original Newey–West papers.
- [Typos] Several table captions begin with 'T able' (Tables 1–5). Please remove the stray space throughout.
Circularity Check
No significant circularity: all reported exponents are empirical fits to external XBlock-ETH data; self-citations are background only.
full rationale
The paper's derivation chain is data-to-measurement. Transaction categories are defined by the fromIsContract/toIsContract flags in the external XBlock-ETH dataset (Table 1, Section 1.1). The scaling exponent alpha is estimated by least-squares regression of log V on log N (Eq. 2); the power-law gamma is estimated by MLE with xmin chosen by KS minimization (Eq. 3, Section 1.1); and the Taylor exponent beta is estimated by regression of log variance on log mean of hourly counts (Eq. 10). None of these quantities is defined in terms of another, and none is fitted to a subset and then 'predicted' for a closely related quantity. The cross-table consistency (alpha, gamma, beta 'confirming' each other) is a within-sample descriptive comparison, not a derivation or an out-of-sample prediction. Self-citations (e.g., Mukhia et al. 2024, Chakraborty et al. 2022/2025, Hens et al. 2019, Saha et al. 2020) are used as background/methodology references and are not load-bearing: no uniqueness theorem, ansatz, or central premise is imported from them. The caveats raised by the reader (unvalidated EOA/SC flags; zero-inflated hourly series making KPSS near-trivial; Period-3 gamma values in Table 3 contradicting the 'stable gamma=2.3' headline) are data-quality, statistical-validity, and internal-consistency concerns, not circularity. Accordingly, no circular step can be quoted, and the score is 0.
Assumptions & free parameters
free parameters (5)
- KS fit-quality thresholds =
D below 0.05 'close fit', D above 0.1 'substantial deviation'
- Log-bin count for volume-partner scaling =
20 bins
- TL time window =
1 hour
- xmin (power-law lower threshold) =
e.g., 825 for SC-SC sender Period 3; 4 to 625 elsewhere
- Period boundaries =
three 3-month windows (Jul-Sep 2017, Oct-Dec 2017, Jan-Mar 2018)
assumptions (5)
- domain assumption fromIsContract/toIsContract flags in XBlock-ETH correctly identify EOAs and smart contracts
- domain assumption Hourly transaction-count series that pass KPSS (p above 0.05) are suitable for Taylor's law fitting
- ad hoc to paper Power-law model with KS-selected xmin, evaluated by in-sample KS distance and LLR versus exponential, is sufficient evidence of power-law behavior
- domain assumption The period July 2017 to March 2018 is representative for inferring universal scaling in ERC20 networks
- standard math MLE and KS methodology (Clauset et al.) is a valid estimation framework
Cite this review
Pith. "Pith review of Universal Patterns in the Blockchain: Analysis of EOAs and Smart Contracts in ERC20 Token Networks." pith.science (2026). https://pith.science/paper/BNCUMWI6
@misc{pith2026250804671,
  author       = {Pith},
  title        = {Pith review of: Universal Patterns in the Blockchain: Analysis of EOAs and Smart Contracts in ERC20 Token Networks},
  year         = {2026},
  howpublished = {\url{https://pith.science/paper/BNCUMWI6}},
  note         = {Machine review of arXiv:2508.04671}
}
abstract
Scaling laws offer a powerful lens to understand complex transactional behaviors in decentralized systems. This study reveals distinctive statistical signatures in the transactional dynamics of ERC20 tokens on the Ethereum blockchain by examining over 44 million token transfers between July 2017 and March 2018 (9-month period). Transactions are categorized into four types: EOA--EOA, EOA--SC, SC-EOA, and SC-SC based on whether the interacting addresses are Externally Owned Accounts (EOAs) or Smart Contracts (SCs), and analyzed across three equal periods (each of 3 months). To identify universal statistical patterns, we investigate the presence of two canonical scaling laws: power law distributions and temporal Taylor's law (TL). EOA-driven transactions exhibit consistent statistical behavior, including a near-linear relationship between trade volume and unique partners with stable power law exponents ($\gamma \approx 2.3$), and adherence to TL with scaling coefficients ($\beta \approx 2.3$). In contrast, interactions involving SCs, especially SC-SC, exhibit sublinear scaling, unstable power-law exponents, and significantly fluctuating Taylor coefficients (variation in $\beta$ to be $\Delta\beta = 0.51$). Moreover, SC-driven activity displays heavier-tailed distributions ($\gamma < 2$), indicating bursty and algorithm-driven activity. These findings reveal the characteristic differences between human-controlled and automated transaction behaviors in blockchain ecosystems. By uncovering universal scaling behaviors through the integration of complex systems theory and blockchain data analytics, this work provides a principled framework for understanding the underlying mechanisms of decentralized financial systems.
Figures


Figures from the paper (8 more)


Forward citations
Cited by 1 Pith paper
-
Scaling laws of Stablecoin Transactions: Evidence from USDT and USDC on the Ethereum blockchain
USDT and USDC transfer-value distributions are heavy-tailed with fitted power-law exponents around 1.4 to 1.8, and smart-contract-to-smart-contract transfers show consistently larger exponents than transfers involving...
Reference graph
Works this paper leans on
-
[1]
Bitcoin: A peer-to-peer electronic cash system
Satoshi Nakamoto. “Bitcoin: A peer-to-peer electronic cash system”. In: (2008)
work page 2008
-
[2]
Dynamic connectedness and integration in cryptocurrency mar- kets
Qiang Ji et al. “Dynamic connectedness and integration in cryptocurrency mar- kets”. In: International Review of Financial Analysis 63 (2019), pp. 257–272
work page 2019
-
[3]
Persistence in the cryptocurrency market
Guglielmo Maria Caporale, Luis Gil-Alana, and Alex Plastun. “Persistence in the cryptocurrency market”. In: Research in International Business and Finance 46 (2018), pp. 141–148
work page 2018
-
[4]
Cryptocurrency market structure: connecting emotions and eco- nomics
Tomaso Aste. “Cryptocurrency market structure: connecting emotions and eco- nomics”. In: Digital Finance 1.1 (2019), pp. 5–21
work page 2019
-
[5]
Complex network analysis of cryptocurrency market dur- ing crashes
Kundan Mukhia et al. “Complex network analysis of cryptocurrency market dur- ing crashes”. In: Physica A: Statistical Mechanics and its Applications 653 (2024), p. 130095
work page 2024
-
[6]
CoinMarketCap. https://coinmarketcap.com/. Accessed: April 28, 2025
work page 2025
-
[7]
An empirical study of volatility in cryptocurrency market
Hemendra Gupta and Rashmi Chaudhary. “An empirical study of volatility in cryptocurrency market”. In: Journal of Risk and Financial Management 15.11 (2022), p. 513
work page 2022
-
[8]
Detecting and quantifying wash trading on decentralized cryptocurrency exchanges
Friedhelm Victor and Andrea Marie Weintraud. “Detecting and quantifying wash trading on decentralized cryptocurrency exchanges”. In: Proceedings of the Web Conference 2021. 2021, pp. 23–32
work page 2021
Show all 62 references
-
[9]
Blockchain challenges and opportunities: A survey
Zibin Zheng et al. “Blockchain challenges and opportunities: A survey”. In: Inter- national journal of web and grid services 14.4 (2018), pp. 352–375
2018
-
[10]
An overview of blockchain technology: Architecture, consensus, and future trends
Zibin Zheng et al. “An overview of blockchain technology: Architecture, consensus, and future trends”. In: 2017 IEEE international congress on big data (BigData congress). Ieee. 2017, pp. 557–564
2017
-
[11]
Cryptocurrency Market Overview
Binance. Cryptocurrency Market Overview. Accessed: April 2025. 2025. url: https: //www.binance.com
2025
-
[12]
Traveling the token world: A graph analysis of ethereum erc20 token ecosystem
Weili Chen et al. “Traveling the token world: A graph analysis of ethereum erc20 token ecosystem”. In: Proceedings of The Web Conference 2020 . 2020, pp. 1411– 1421
2020
-
[13]
Measuring ethereum-based erc20 token networks
Friedhelm Victor and Bianca Katharina Lüders. “Measuring ethereum-based erc20 token networks”. In: Financial Cryptography and Data Security: 23rd Interna- tional Conference, FC 2019, Frigate Bay, St. Kitts and Nevis, February 18–22, 2019, Revised Selected Papers 23 . Springer....
2019
-
[14]
A next-generation smart contract and decentralized appli- cation platform
Vitalik Buterin et al. “A next-generation smart contract and decentralized appli- cation platform”. In: white paper 3.37 (2014), pp. 2–1
2014
-
[15]
The idea of smart contracts
Nick Szabo. “The idea of smart contracts”. In: Nick Szabos papers and concise tutorials 6.1 (1997), p. 199
1997
-
[16]
Smart contracts
Merit Kolvart, Margus Poola, and Addi Rull. “Smart contracts”. In: The Future of Law and etechnologies (2016), pp. 133–147
2016
-
[17]
Impact of Black Swan Events on Ethereum blockchain ERC20 token transaction networks
Moturi Pradeep et al. “Impact of Black Swan Events on Ethereum blockchain ERC20 token transaction networks”. In: Physica A: Statistical Mechanics and its Applications 654 (2024), p. 130129. August 6, 2025 22/25
2024
-
[18]
Modeling innovation in the cryptocurrency ecosystem
Giordano De Marzo, Francesco Pandolfelli, and Vito DP Servedio. “Modeling innovation in the cryptocurrency ecosystem”. In: Scientific Reports 12.1 (2022), p. 12942
2022
-
[19]
Network analysis of erc20 tokens trading on ethereum blockchain
Shahar Somin, Goren Gordon, and Yaniv Altshuler. “Network analysis of erc20 tokens trading on ethereum blockchain”. In: Unifying Themes in Complex Systems IX: Proceedings of the Ninth International Conference on Complex Systems 9 . Springer. 2018, pp. 439–450
2018
-
[20]
Classification of cryptocurrency coins and tokens by the dynamics of their market capitalizations
Ke Wu, Spencer Wheatley, and Didier Sornette. “Classification of cryptocurrency coins and tokens by the dynamics of their market capitalizations”. In: Royal So- ciety open science 5.9 (2018), p. 180381
2018
-
[21]
Searching for heavy-tailed probability distributions for modeling real-world complex networks
Tanujit Chakraborty et al. “Searching for heavy-tailed probability distributions for modeling real-world complex networks”. In: IEEE Access 10 (2022), pp. 115092– 115107
2022
-
[22]
A Compounded Burr Probability Distribution for Fitting Heavy-Tailed Data with Applications to Biological Networks
Tanujit Chakraborty et al. “A Compounded Burr Probability Distribution for Fitting Heavy-Tailed Data with Applications to Biological Networks”. In: Chaos (2025)
2025
-
[23]
Aggregation, Variance and the Mean
L. R. Taylor. “Aggregation, Variance and the Mean”. In: Nature 189.4766 (1961), pp. 732–735. doi: 10 . 1038 / 189732a0. url: https : / / doi . org / 10 . 1038 / 189732a0
1961
-
[24]
Fluctuation scaling in complex systems: Taylor’s law and beyond
Zoltán Eisler, Imre Bartos, and János Kertész. “Fluctuation scaling in complex systems: Taylor’s law and beyond”. In: Advances in Physics 57.1 (2008), pp. 89– 142
2008
-
[25]
Taylors law of temporal fluctua- tion scaling in stock illiquidity
Qing Cai, Hai-Chuan Xu, and Wei-Xing Zhou. “Taylors law of temporal fluctua- tion scaling in stock illiquidity”. In: Fluctuation and Noise Letters 15.04 (2016), p. 1650029
2016
-
[26]
Xblock-eth: Extracting and exploring blockchain data from ethereum
Peilin Zheng et al. “Xblock-eth: Extracting and exploring blockchain data from ethereum”. In: IEEE Open Journal of the Computer Society 1 (2020), pp. 95–106
2020
-
[27]
http://xblock.pro/xblock-eth.html
XBlock-ETH Dataset Website . http://xblock.pro/xblock-eth.html
-
[28]
https://en.wikipedia.org/wiki/Unix_time
Unix time . https://en.wikipedia.org/wiki/Unix_time
-
[29]
Growth, innovation, scaling, and the pace of life in cities
Luís MA Bettencourt et al. “Growth, innovation, scaling, and the pace of life in cities”. In: Proceedings of the national academy of sciences 104.17 (2007), pp. 7301–7306
2007
-
[30]
The origins of scaling in cities
Luís MA Bettencourt. “The origins of scaling in cities”. In: science 340.6139 (2013), pp. 1438–1441
2013
-
[31]
The scaling of human interactions with city size
Markus Schläpfer et al. “The scaling of human interactions with city size”. In: Journal of the Royal Society Interface 11.98 (2014), p. 20130789
2014
-
[32]
Spatiotemporal signal propagation in complex net- works
Chittaranjan Hens et al. “Spatiotemporal signal propagation in complex net- works”. In: Nature Physics 15.4 (2019), pp. 403–412
2019
-
[33]
Power-law distri- butions in empirical data
Aaron Clauset, Cosma Rohilla Shalizi, and Mark EJ Newman. “Power-law distri- butions in empirical data”. In: SIAM review 51.4 (2009), pp. 661–703
2009
-
[34]
A brief history of generative models for power law and lognormal distributions
Michael Mitzenmacher. “A brief history of generative models for power law and lognormal distributions”. In: Internet mathematics 1.2 (2004), pp. 226–251
2004
-
[35]
Emergence of scaling in random net- works
Albert-László Barabási and Réka Albert. “Emergence of scaling in random net- works”. In: science 286.5439 (1999), pp. 509–512
1999
-
[36]
Power laws, Pareto distributions and Zipf’s law
Mark EJ Newman. “Power laws, Pareto distributions and Zipf’s law”. In: Con- temporary physics 46.5 (2005), pp. 323–351. August 6, 2025 23/25
2005
-
[37]
The powerful law of the power law and other myths in network biology
Gipsi Lima-Mendez and Jacques Van Helden. “The powerful law of the power law and other myths in network biology”. In: Molecular BioSystems 5.12 (2009), pp. 1482–1493
2009
-
[38]
Infection spreading and recovery in a square lattice
Suman Saha et al. “Infection spreading and recovery in a square lattice”. In: Physical Review E 102.5 (2020), p. 052307
2020
-
[39]
Prediction and asymptotics
Ole E Barndorff-Nielsen and David R Cox. “Prediction and asymptotics”. In: (1996)
1996
-
[40]
All of statistics: a concise course in statistical inference
Larry Wasserman. All of statistics: a concise course in statistical inference . Springer Science & Business Media, 2013
2013
-
[41]
Problems with fitting to the power-law distribution
Michel L Goldstein, Steven A Morris, and Gary G Yen. “Problems with fitting to the power-law distribution”. In: The European Physical Journal B-Condensed Matter and Complex Systems 41 (2004), pp. 255–258
2004
-
[42]
Kolmogorov–smirnov test: Overview
Vance W Berger and YanYan Zhou. “Kolmogorov–smirnov test: Overview”. In: Wiley statsref: Statistics reference online (2014)
2014
-
[43]
On the frequency of severe terrorist events
Aaron Clauset, Maxwell Young, and Kristian Skrede Gleditsch. “On the frequency of severe terrorist events”. In: Journal of Conflict Resolution 51.1 (2007), pp. 58– 87
2007
-
[44]
The Kolmogorov-Smirnov test for goodness of fit
Frank J Massey Jr. “The Kolmogorov-Smirnov test for goodness of fit”. In: Journal of the American statistical Association 46.253 (1951), pp. 68–78
1951
-
[45]
Using likelihood to test for Lévy flight search patterns and for general power-law distributions in nature
Andrew M Edwards. “Using likelihood to test for Lévy flight search patterns and for general power-law distributions in nature”. In: Journal of Animal Ecology 77.6 (2008), pp. 1212–1222
2008
-
[46]
Statistical analyses support power law distributions found in neuronal avalanches
Andreas Klaus, Shan Yu, and Dietmar Plenz. “Statistical analyses support power law distributions found in neuronal avalanches”. In: PloS one 6.5 (2011), e19779
2011
-
[47]
Response surface estimates of the KPSS stationarity test
Peter S Sephton. “Response surface estimates of the KPSS stationarity test”. In: Economics Letters 47.3-4 (1995), pp. 255–261
1995
-
[48]
Generalizations of the KPSS-test for stationarity
Bart Hobijn, Philip Hans Franses, and Marius Ooms. “Generalizations of the KPSS-test for stationarity”. In: Statistica Neerlandica 58.4 (2004), pp. 483–502
2004
-
[49]
Lag order and critical values of the augmented Dickey–Fuller test
Yin-Wong Cheung and Kon S Lai. “Lag order and critical values of the augmented Dickey–Fuller test”. In: Journal of Business & Economic Statistics 13.3 (1995), pp. 277–280
1995
-
[50]
Distribution of the estimators for au- toregressive time series with a unit root
David A Dickey and Wayne A Fuller. “Distribution of the estimators for au- toregressive time series with a unit root”. In: Journal of the American statistical association 74.366a (1979), pp. 427–431
1979
-
[51]
Testing for a unit root in time series re- gression
Peter CB Phillips and Pierre Perron. “Testing for a unit root in time series re- gression”. In: biometrika 75.2 (1988), pp. 335–346
1988
-
[52]
Further evidence on the great crash, the oil-price shock, and the unit-root hypothesis
Eric Zivot and Donald W K Andrews. “Further evidence on the great crash, the oil-price shock, and the unit-root hypothesis”. In: Journal of business & economic statistics 20.1 (2002), pp. 25–44
2002
-
[53]
Testing the null hypothesis of stationarity against the alternative of a unit root: How sure are we that economic time series have a unit root?
Denis Kwiatkowski et al. “Testing the null hypothesis of stationarity against the alternative of a unit root: How sure are we that economic time series have a unit root?” In: Journal of econometrics 54.1-3 (1992), pp. 159–178
1992
-
[54]
The KPSS stationarity test as a unit root test
Yongcheol Shin and Peter Schmidt. “The KPSS stationarity test as a unit root test”. In: Economics Letters 38.4 (1992), pp. 387–392
1992
-
[55]
Consistency of the KPSS unit root test against fractionally integrated alternative
Hyung S Lee and Christine Amsler. “Consistency of the KPSS unit root test against fractionally integrated alternative”. In: Economics letters 55.2 (1997), pp. 151–160. August 6, 2025 24/25
1997
-
[56]
Stationarity tests for financial time series
Ricardo Gimeno, Benjamn Manchado, and Román Mnguez. “Stationarity tests for financial time series”. In: Physica A: Statistical Mechanics and its Applications 269.1 (1999), pp. 72–78
1999
-
[57]
Is Newey– West optimal among first-order kernels?
Thomas Kolokotrones, James H Stock, and Christopher D Walker. “Is Newey– West optimal among first-order kernels?” In: Journal of Econometrics 240.2 (2024), p. 105399
2024
-
[58]
Random sampling of skewed distributions implies Taylors power law of fluctuation scaling
Joel E Cohen and Meng Xu. “Random sampling of skewed distributions implies Taylors power law of fluctuation scaling”. In: Proceedings of the National Academy of Sciences 112.25 (2015), pp. 7749–7754
2015
-
[59]
Modeling distances between humans using Taylors law and geometric probability
Joel E Cohen and Daniel Courgeau. “Modeling distances between humans using Taylors law and geometric probability”. In: Mathematical Population Studies 24.4 (2017), pp. 197–218
2017
-
[60]
Heavy-tailed dis- tributions, correlations, kurtosis and Taylors law of fluctuation scaling
Joel E Cohen, Richard A Davis, and Gennady Samorodnitsky. “Heavy-tailed dis- tributions, correlations, kurtosis and Taylors law of fluctuation scaling”. In: Pro- ceedings of the Royal Society A 476.2244 (2020), p. 20200610
2020
-
[61]
Origins of Taylors power law for fluctuation scaling in complex systems
Agata Fronczak and Piotr Fronczak. “Origins of Taylors power law for fluctuation scaling in complex systems”. In: Physical Review EStatistical, Nonlinear, and Soft Matter Physics 81.6 (2010), p. 066112
2010
-
[62]
The great crypto crash in September 2018: why did the cryp- tocurrency market collapse?
Viktor Manahov. “The great crypto crash in September 2018: why did the cryp- tocurrency market collapse?” In: Annals of Operations Research 332.1 (2024), pp. 579–616. August 6, 2025 25/25
2018
Reviewed August 5, 2026 · model on record in the stance chip above.
Discussion (0). Continue with ORCID to comment.