Finding Core Balanced Modules in Statistically Validated Stock Networks
Pith reviewed 2026-05-19 01:05 UTC · model grok-4.3
The pith
Statistically validated stock networks contain large balanced modules that grow during crises.
A machine-rendered reading of the paper's core claim, the machinery that carries it, and where it could break.
Core claim
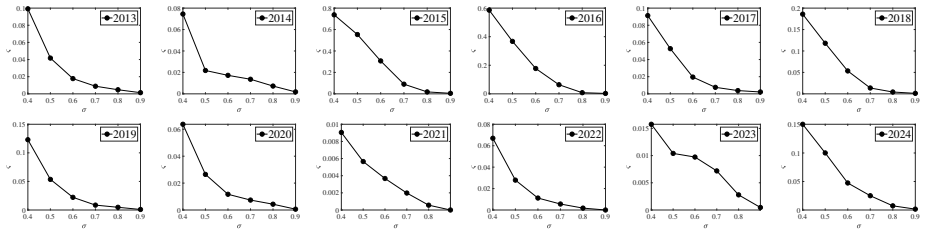
The largest strong correlation balanced module (LSCBM) is the maximum-size group of stocks with structural balance, meaning positive products of edge signs for every triplet, and strong pairwise correlations. In a random signed graph model, LSCBMs are shown to exist asymptotically with specific size scaling and multiplicity. An efficient heuristic algorithm called MaxBalanceCore detects them by exploiting sparsity. In empirical Chinese stock market data from 2013 to 2024, LSCBMs identify core subsystems that reorganize with economic shifts, with their size surging during high-stress periods such as the 2015 crash and contracting in stable times, while rotating across sectors.
What carries the argument
The LSCBM, which is the largest set of stocks satisfying the structural balance condition (positive edge-sign products for all triplets) and having strong pairwise correlations.
If this is right
- LSCBM size increases during market crises, signaling concentrated stable relationships under stress.
- The module's composition changes yearly, shifting between dominant sectors like Industrials and Financials.
- The detection algorithm scales efficiently to networks with thousands of nodes.
- Negative edges within the module enable potential hedging strategies due to the balance property.
Where Pith is reading between the lines
- If LSCBM size reliably tracks stress, it could serve as a real-time market health indicator beyond traditional volatility measures.
- The approach might extend to other signed networks in social or biological systems where balance indicates stability.
- Portfolio managers could use LSCBM membership to select assets with built-in hedging pairs.
Load-bearing premise
That groups with all triplet edge-sign products positive form stable relationships useful for hedging via the negative edges inside them.
What would settle it
A dataset from a calm market period showing LSCBM sizes comparable to or larger than those during documented crises like 2015 would challenge the link between size surges and high-stress periods.
Figures


read the original abstract
Traditional threshold-based stock networks suffer from subjective parameter selection and inherent limitations: they constrain relationships to binary representations, failing to capture both correlation strength and negative dependencies. To address this, we introduce statistically validated correlation networks that retain only statistically significant correlations via a rigorous t-test of Pearson coefficients. We then propose a novel structure termed the largest strong correlation balanced module (LSCBM), defined as the maximum-size group of stocks with structural balance (i.e., positive edge-sign products for all triplets) and strong pairwise correlations. This balance condition ensures stable relationships, thus facilitating potential hedging opportunities through negative edges. Theoretically, within a random signed graph model, we establish LSCBM's asymptotic existence, size scaling, and multiplicity under various parameter regimes. To detect LSCBM efficiently, we develop MaxBalanceCore, a heuristic algorithm that leverages network sparsity. Simulations validate its efficiency, demonstrating scalability to networks of up to 10,000 nodes within tens of seconds. Empirical analysis demonstrates that LSCBM identifies core market subsystems that dynamically reorganize in response to economic shifts and crises. In the Chinese stock market (2013-2024), LSCBM's size surges during high-stress periods (e.g., the 2015 crash) and contracts during stable or fragmented regimes, while its composition rotates annually across dominant sectors (e.g., Industrials and Financials).
Editorial analysis
A structured set of objections, weighed in public.
Referee Report
Summary. The manuscript proposes statistically validated stock networks using t-tests to select significant correlations, avoiding subjective thresholds. It defines the Largest Strong Correlation Balanced Module (LSCBM) as the largest set of stocks with strong positive/negative correlations that satisfy structural balance, meaning all triplets have positive edge-sign products. In a random signed graph model, asymptotic existence, size scaling, and multiplicity of LSCBM are established. The MaxBalanceCore heuristic algorithm is introduced for efficient detection, with simulations showing scalability to 10,000 nodes. Empirical analysis on the Chinese stock market from 2013 to 2024 reveals that LSCBM sizes surge during crises such as the 2015 crash and exhibit annual sector rotations among dominant sectors like Industrials and Financials.
Significance. Should the theoretical results be rigorously derived and the empirical patterns proven robust to controls for edge density, this approach could advance the identification of dynamically stable market cores useful for hedging strategies and systemic risk monitoring. The blend of theoretical analysis in signed graphs, algorithmic innovation, and longitudinal empirical evidence positions the work as a potentially valuable contribution to financial network science.
major comments (2)
- [Abstract and theoretical section] Abstract and theoretical section: The claims of asymptotic existence, size scaling, and multiplicity of LSCBM under various parameter regimes in the random signed graph model are stated without any derivation details, proofs, equations, or exact parameter specifications. This absence is load-bearing for the central theoretical contribution and prevents verification of the results.
- [Empirical analysis section] Empirical analysis section: The reported size surges in LSCBM during high-stress periods (e.g., 2015 crash) and sector rotations are not supported by an ablation that holds the t-test statistical validation fixed while randomizing signs or replacing the balance constraint with a density or positive-only condition. This leaves open whether the dynamics reflect the structural balance property or simply increased edge density from volatility.
minor comments (3)
- [Methods section] Methods section: Exact values and justification for the t-test significance level and strong correlation threshold are not provided, nor is a sensitivity analysis shown despite these being free parameters that affect LSCBM detection.
- [Figures in empirical section] Figures in empirical section: Time-series plots of LSCBM sizes lack error bars or confidence intervals, hindering assessment of the statistical robustness of the reported surges.
- [Algorithm section] Algorithm section: The MaxBalanceCore heuristic lacks pseudocode, formal complexity bounds, or reproducibility details beyond the high-level description of leveraging sparsity.
Simulated Author's Rebuttal
We thank the referee for the constructive and detailed feedback, which helps clarify the presentation of our theoretical contributions and strengthens the empirical robustness. We address each major comment below and commit to revisions that directly respond to the concerns raised.
read point-by-point responses
-
Referee: [Abstract and theoretical section] Abstract and theoretical section: The claims of asymptotic existence, size scaling, and multiplicity of LSCBM under various parameter regimes in the random signed graph model are stated without any derivation details, proofs, equations, or exact parameter specifications. This absence is load-bearing for the central theoretical contribution and prevents verification of the results.
Authors: We acknowledge that the current manuscript states the asymptotic results on existence, size scaling, and multiplicity without including the full derivations, key equations, or precise parameter regimes in the main text. This limits immediate verifiability. In the revised version, we will expand the theoretical section to include the model definition, the relevant equations for the random signed graph, the parameter regimes (e.g., edge probability and sign bias ranges), and a high-level proof sketch for each claim. Complete rigorous proofs will be moved to a dedicated appendix to keep the main text accessible while enabling verification. revision: yes
-
Referee: [Empirical analysis section] Empirical analysis section: The reported size surges in LSCBM during high-stress periods (e.g., 2015 crash) and sector rotations are not supported by an ablation that holds the t-test statistical validation fixed while randomizing signs or replacing the balance constraint with a density or positive-only condition. This leaves open whether the dynamics reflect the structural balance property or simply increased edge density from volatility.
Authors: We agree that additional controls are needed to isolate the role of structural balance. The observed surges and sector rotations are currently shown for the LSCBM definition that enforces both statistical validation and balance. In the revision, we will add ablations that (i) keep the t-test validated edges fixed but randomize their signs and (ii) replace the balance constraint with a maximum-density or positive-only module of comparable size. These will be reported alongside the original results to demonstrate that the crisis-related enlargement and rotations are specifically tied to the balance property rather than density or volatility alone. revision: yes
Circularity Check
No significant circularity in derivation chain
full rationale
The paper defines LSCBM via the structural balance condition on statistically validated signed edges, then derives asymptotic existence, size scaling, and multiplicity results inside an explicit random signed graph model whose parameters are stated independently of the Chinese-market data. The MaxBalanceCore heuristic is introduced and benchmarked on simulated sparse networks up to 10k nodes. Empirical size surges and sector rotations are reported as observations on 2013-2024 data rather than as model predictions fitted to those same observations. No equation reduces the claimed properties to a tautological renaming of the input definition, no fitted parameter is relabeled as a prediction, and no load-bearing premise rests solely on a self-citation whose content is itself unverified. The random-graph analysis supplies independent mathematical grounding for the existence claims.
Axiom & Free-Parameter Ledger
free parameters (2)
- t-test significance level
- strong correlation threshold
axioms (2)
- domain assumption Structural balance (positive sign product on every triplet) implies stable relationships suitable for hedging
- domain assumption The random signed graph model accurately captures the statistical properties of validated stock correlation networks
invented entities (2)
-
LSCBM (largest strong correlation balanced module)
no independent evidence
-
MaxBalanceCore algorithm
no independent evidence
Lean theorems connected to this paper
-
IndisputableMonolith/Cost/FunctionalEquation.leanwashburn_uniqueness_aczel unclear?
unclearRelation between the paper passage and the cited Recognition theorem.
A subnetwork S is a strong-correlation balanced module (SCBM) if: (1) |C̃i,j|≥σ and (2) C̃i,j×C̃i,k×C̃j,k >0 for every triplet (positive edge-sign products).
-
IndisputableMonolith/Foundation/RealityFromDistinction.leanreality_from_one_distinction unclear?
unclearRelation between the paper passage and the cited Recognition theorem.
Random signed graph G(N,α,β) with positive/negative edge probabilities; LSCBM size scaling E[|S∗|]∼log N/λ(α,β).
What do these tags mean?
- matches
- The paper's claim is directly supported by a theorem in the formal canon.
- supports
- The theorem supports part of the paper's argument, but the paper may add assumptions or extra steps.
- extends
- The paper goes beyond the formal theorem; the theorem is a base layer rather than the whole result.
- uses
- The paper appears to rely on the theorem as machinery.
- contradicts
- The paper's claim conflicts with a theorem or certificate in the canon.
- unclear
- Pith found a possible connection, but the passage is too broad, indirect, or ambiguous to say the theorem truly supports the claim.
Reference graph
Works this paper leans on
-
[1]
Syste mic Risk and Stability in Financial Networks
Acemoglu, D., Ozdaglar, A., Tahbaz-Salehi, A., 2015. Syste mic Risk and Stability in Financial Networks. American Econ omic Review 105, 564–608
work page 2015
-
[2]
Statistical mechanics of complex networks
Albert, R., Barab´ asi, A.L., 2002. Statistical mechanics of complex networks. Reviews of Modern Physics 74, 47
work page 2002
-
[3]
Dyna mic co-movements of stock market returns, implied volatili ty and policy uncertainty
Antonakakis, N., Chatziantoniou, I., Filis, G., 2013. Dyna mic co-movements of stock market returns, implied volatili ty and policy uncertainty. Economics Letters 120, 87–92
work page 2013
-
[4]
Economi c policy uncertainty and stock markets: Long-run evidence f rom the US
Arouri, M., Estay, C., Rault, C., Roubaud, D., 2016. Economi c policy uncertainty and stock markets: Long-run evidence f rom the US. Finance Research Letters 18, 136–141
work page 2016
-
[5]
Why does the stock market fl uctuate? Quarterly Journal of Economics 108, 291–311
Barsky, R.B., De Long, J.B., 1993. Why does the stock market fl uctuate? Quarterly Journal of Economics 108, 291–311
work page 1993
-
[6]
Complex networks: Structure and dynamics
Boccaletti, S., Latora, V ., Moreno, Y ., Chavez, M., Hwang, D .U., 2006. Complex networks: Structure and dynamics. Physi cs Reports 424, 175–308
work page 2006
-
[7]
Mining market data: A network approach
Boginski, V ., Butenko, S., Pardalos, P .M., 2006. Mining market data: A network approach. Computers & Operations Resear ch 33, 3171–3184. Bollob´ as, B., Bollob´ as, B., 1998. Random graphs. Springer
work page 2006
-
[8]
The impact of the Ukraine–Russia war on world stock market returns
Boungou, W., Y ati´ e, A., 2022. The impact of the Ukraine–Russia war on world stock market returns. Economics Letters 215 , 110516. 57
work page 2022
-
[9]
Structure information le arning for neutral links in signed network embedding
Cai, S., Shan, W., Zhang, M., 2022. Structure information le arning for neutral links in signed network embedding. Infor mation Processing & Management 59, 102917
work page 2022
-
[10]
Structural balance: a gen eralization of heider’s theory
Cartwright, D., Harary, F., 1956. Structural balance: a gen eralization of heider’s theory. Psychological Review 63, 2 77
work page 1956
-
[11]
Economic forces and t he stock market
Chen, N.F., Roll, R., Ross, S.A., 1986. Economic forces and t he stock market. Journal of Business , 383–403
work page 1986
-
[12]
Chen, W., Hou, X., Jiang, M., Jiang, C., 2022. Identifying sy stemically important financial institutions in complex net work: A case study of Chinese stock market. Emerging Markets Review 50, 100836
work page 2022
-
[13]
Convexified modularity maximi zation for degree-corrected stochastic block models
Chen, Y ., Li, X., Xu, J., 2018. Convexified modularity maximi zation for degree-corrected stochastic block models. Anna ls of Statistics 46, 1573 – 1602
work page 2018
-
[14]
A network perspective of the stock market
Chi, K.T., Liu, J., Lau, F.C., 2010. A network perspective of the stock market. Journal of Empirical Finance 17, 659–667. De Bondt, W.F., Thaler, R., 1985. Does the stock market overr eact? Journal of finance 40, 793–805
work page 2010
-
[15]
Dorogovtsev, S.N., Mendes, J.F., 2002. Evolution of networ ks. Advances in Physics 51, 1079–1187
work page 2002
-
[16]
E ffect of violation of normality on the t test of the correlation coefficient
Edgell, S.E., Noon, S.M., 1984. E ffect of violation of normality on the t test of the correlation coefficient. Psychological Bulletin 95, 576
work page 1984
-
[17]
Stock market volat ility and macroeconomic fundamentals
Engle, R.F., Ghysels, E., Sohn, B., 2013. Stock market volat ility and macroeconomic fundamentals. Review of Economics and Statistics 95, 776–797
work page 2013
-
[18]
E ffects of common factors on stock correlation networks and por tfolio diversification
Eom, C., Park, J.W., 2017. E ffects of common factors on stock correlation networks and por tfolio diversification. International Review of Financial Analysis 49, 1–11
work page 2017
-
[19]
Computing glo bal structural balance in large-scale signed social networks
Facchetti, G., Iacono, G., Altafini, C., 2011. Computing glo bal structural balance in large-scale signed social networks. Proceedings of the National Academy of Sciences 108, 20953–20958
work page 2011
-
[20]
The behavior of stock-market prices
Fama, E.F., 1965. The behavior of stock-market prices. Jour nal of Business 38, 34–105
work page 1965
-
[21]
Dividends, earnings, and stock prices
Gordon, M.J., 1959. Dividends, earnings, and stock prices. Review of Economics and Statistics 41, 99–105
work page 1959
-
[22]
Stock price crash ri sk: review of the empirical literature
Habib, A., Hasan, M.M., Jiang, H., 2018. Stock price crash ri sk: review of the empirical literature. Accounting & Financ e 58, 211–251
work page 2018
-
[23]
On the notion of balance of a signed graph
Harary, F., 1953. On the notion of balance of a signed graph. M ichigan Mathematical Journal 2, 143–146
work page 1953
-
[24]
He, C., Wen, Z., Huang, K., Ji, X., 2022. Sudden shock and stoc k market network structure characteristics: A comparison o f past crisis events. Technological Forecasting and Social Change 180, 121732
work page 2022
-
[25]
Stock network stability in times of c risis
Heiberger, R.H., 2014. Stock network stability in times of c risis. Physica A: Statistical Mechanics and its Applicatio ns 393, 376–381
work page 2014
-
[26]
Predicting economic growth with sto ck networks
Heiberger, R.H., 2018. Predicting economic growth with sto ck networks. Physica A: Statistical Mechanics and its Appli cations 489, 102–111
work page 2018
-
[27]
Attitudes and cognitive organization
Heider, F., 1946. Attitudes and cognitive organization. Jo urnal of Psychology 21, 107–112
work page 1946
-
[28]
A network analysis of the Chinese stock market
Huang, W.Q., Zhuang, X.T., Y ao, S., 2009. A network analysis of the Chinese stock market. Physica A: Statistical Mechani cs and its Applications 388, 2956–2964
work page 2009
-
[29]
Applications of deep learning in stock mark et prediction: recent progress
Jiang, W., 2021. Applications of deep learning in stock mark et prediction: recent progress. Expert Systems with Applic ations 184, 115537
work page 2021
-
[30]
Fast community detection by SCORE
Jin, J., 2015. Fast community detection by SCORE. Annals of S tatistics 43, 57 – 89. Kwapie´ n, J., Dro˙ zd˙ z, S., 2012. Physical approach to complex systems. Physics Reports 515, 115–226
work page 2015
-
[31]
Undirected and Directed Network Analysis of the Chinese Stock Market
Li, B., Y ang, Y ., 2022. Undirected and Directed Network Analysis of the Chinese Stock Market. Computational Economics 6 0, 1155–1173
work page 2022
-
[32]
Analysis of the impact of Sino-US trade friction on China’s stock market bas ed on complex networks
Li, Y ., Zhuang, X., Wang, J., Zhang, W., 2020. Analysis of the impact of Sino-US trade friction on China’s stock market bas ed on complex networks. North American Journal of Economics and Finance 5 2, 101185
work page 2020
-
[33]
Liu, J.B., Zheng, Y .Q., Lee, C.C., 2024. Statistical analys is of the regional air quality index of Y angtze River Delta ba sed on complex network theory. Applied Energy 357, 122529. 58 L ¨ u, L., Chen, D., Ren, X.L., Zhang, Q.M., Zhang, Y .C., Zhou, T., 2016. Vital nodes identification in complex networks. Ph ysics Reports 650, 1–63
work page 2024
-
[34]
A memetic al gorithm for computing and transforming structural balance in signed networks
Ma, L., Gong, M., Du, H., Shen, B., Jiao, L., 2015. A memetic al gorithm for computing and transforming structural balance in signed networks. Knowledge-Based Systems 85, 196–209
work page 2015
-
[35]
Topology of the South Africa n stock market network across the 2008 financial crisis
Majapa, M., Gossel, S.J., 2016. Topology of the South Africa n stock market network across the 2008 financial crisis. Phys ica A: Statistical Mechanics and its Applications 445, 35–47
work page 2016
-
[36]
Hierarchical structure in financial m arkets
Mantegna, R.N., 1999. Hierarchical structure in financial m arkets. European Physical Journal B 11, 193–197
work page 1999
-
[37]
Introduction to correlation networks: Interdisciplinar y approaches beyond threshold- ing
Masuda, N., Boyd, Z.M., Garlaschelli, D., Mucha, P .J., 2025. Introduction to correlation networks: Interdisciplinar y approaches beyond threshold- ing. Physics Reports 1136, 1–39
work page 2025
-
[38]
Memon, B.A., Y ao, H., 2019. Structural Change and Dynamics of Pakistan Stock Market During Crisis: A Complex Network Per spective. Entropy 21, 248
work page 2019
-
[39]
Complex networks analysis in Iran stock market: The ap plication of centrality
Moghadam, H.E., Mohammadi, T., Kashani, M.F., Shakeri, A., 2019. Complex networks analysis in Iran stock market: The ap plication of centrality. Physica A: Statistical Mechanics and its Appli cations 531, 121800
work page 2019
-
[40]
The structure and function of complex ne tworks
Newman, M.E., 2003. The structure and function of complex ne tworks. SIAM Review 45, 167–256
work page 2003
-
[41]
Newman, M.E.J., 2004. Analysis of weighted networks. Phys. Rev. E 70, 056131
work page 2004
-
[42]
E ffects of global financial crisis on network structure in a loca l stock market
Nobi, A., Maeng, S.E., Ha, G.G., Lee, J.W., 2014. E ffects of global financial crisis on network structure in a loca l stock market. Physica A: Statistical Mechanics and its Applications 407, 135–143
work page 2014
-
[43]
Test for significance of Pea rson’s correlation coe fficient
Obilor, E.I., Amadi, E.C., 2018. Test for significance of Pea rson’s correlation coe fficient. International Journal of Innovative Mathematics, Statistics & Energy Policies 6, 11–23
work page 2018
-
[44]
Paramati, S.R., Mo, D., Gupta, R., 2017. The e ffects of stock market growth and renewable energy use on CO2 em issions: evidence from G20 countries. Energy Economics 66, 360–371
work page 2017
-
[45]
Infl uence analysis in social networks: A survey
Peng, S., Zhou, Y ., Cao, L., Y u, S., Niu, J., Jia, W., 2018. Infl uence analysis in social networks: A survey. Journal of Netw ork and Computer Applications 106, 17–32
work page 2018
-
[46]
Regularized spectral clustering un der the degree-corrected stochastic blockmodel
Qin, T., Rohe, K., 2013. Regularized spectral clustering un der the degree-corrected stochastic blockmodel. Advances in Neural Information Processing Systems 26
work page 2013
-
[47]
Community detection by spectral methods in m ulti-layer networks
Qing, H., 2025. Community detection by spectral methods in m ulti-layer networks. Applied Soft Computing 171, 112769
work page 2025
-
[48]
Regularized spectral clustering u nder the mixed membership stochastic block model
Qing, H., Wang, J., 2023. Regularized spectral clustering u nder the mixed membership stochastic block model. Neurocom puting 550, 126490
work page 2023
-
[49]
Identification of th e most influential stocks in financial networks
Qu, J., Liu, Y ., Tang, M., Guan, S., 2022. Identification of th e most influential stocks in financial networks. Chaos, Solit ons & Fractals 158, 111939
work page 2022
-
[50]
Spectral clustering and the high-dimensional stochastic blockmodel
Rohe, K., Chatterjee, S., Y u, B., 2011. Spectral clustering and the high-dimensional stochastic blockmodel. Annals of Statistics 39, 1878 – 1915
work page 2011
-
[51]
Covid-19 pan demic and spillover e ffects in stock markets: A financial network approach
Samitas, A., Kampouris, E., Polyzos, S., 2022. Covid-19 pan demic and spillover e ffects in stock markets: A financial network approach. Interna - tional Review of Financial Analysis 80, 102005
work page 2022
-
[52]
Economic Networks: Th e New Challenges
Schweitzer, F., Fagiolo, G., Sornette, D., V ega-Redondo, F ., V espignani, A., White, D.R., 2009. Economic Networks: Th e New Challenges. Science 325, 422–425
work page 2009
-
[53]
Stock market analy sis: A review and taxonomy of prediction techniques
Shah, D., Isah, H., Zulkernine, F., 2019. Stock market analy sis: A review and taxonomy of prediction techniques. Intern ational Journal of Financial Studies 7, 26
work page 2019
-
[54]
Evolutionary prisoner’s dilemma game on signed networks based on str uctural balance theory
Song, S., Feng, Y ., Xu, W., Li, H.J., Wang, Z., 2022. Evolutionary prisoner’s dilemma game on signed networks based on str uctural balance theory
work page 2022
-
[55]
Social network analysis: An overview
Tabassum, S., Pereira, F.S., Fernandes, S., Gama, J., 2018. Social network analysis: An overview. Wiley Interdiscipli nary Reviews: Data Mining 59 and Knowledge Discovery 8, e1256. V enturini, A., 2022. Climate change, risk factors and stock returns: A review of the literature. International Review o f Financial Analysis 79, 101934. Vidal-Tom´ as, D., 202...
work page 2018
-
[56]
Wang, G.J., Xie, C., Stanley, H.E., 2018. Correlation Struc ture and Evolution of World Stock Markets: Evidence from Pea rson and Partial Correlation-Based Networks. Computational Economics 51, 607–635
work page 2018
-
[57]
Opti mizing dynamical changes of structural balance in signed ne twork based on memetic algorithm
Wang, S., Gong, M., Du, H., Ma, L., Miao, Q., Du, W., 2016. Opti mizing dynamical changes of structural balance in signed ne twork based on memetic algorithm. Social Networks 44, 64–73
work page 2016
-
[58]
Comparison betwee n global financial crisis and local stock disaster on top of Ch inese stock network
Xia, L., Y ou, D., Jiang, X., Guo, Q., 2018. Comparison betwee n global financial crisis and local stock disaster on top of Ch inese stock network. Physica A: Statistical Mechanics and its Applications 490, 222–230
work page 2018
-
[59]
Community detection and clu stering characteristics analysis of the stock market
Xing, J., Li, B., Y ang, Y ., 2023. Community detection and clu stering characteristics analysis of the stock market. Mana gerial and Decision Economics 44, 3893–3906. Y an, Y ., Y ang, Y ., 2023. Community detection for New Y ork stock market by SCORE-CCD. Computational Statistics 38, 1255– 1282. Y ang, M.Y ., Wu, Z.G., Wu, X., 2022. An empirical study o...
work page 2023
-
[60]
The stability of chinese stock n etwork and its mechanism
Zhang, W., Zhuang, X., 2019. The stability of chinese stock n etwork and its mechanism. Physica A: Statistical Mechanics and its Applications 515, 748–761
work page 2019
-
[61]
Social balance in signed networks
Zheng, X., Zeng, D., Wang, F.Y ., 2015. Social balance in signed networks. Information Systems Frontiers 17, 1077–1095
work page 2015
-
[62]
Dynamic analysis and commu nity recognition of stock price based on a complex network pe rspective
Zhou, Y ., Chen, Z., Liu, Z., 2023. Dynamic analysis and commu nity recognition of stock price based on a complex network pe rspective. Expert Systems with Applications 213, 118944. 60
work page 2023
discussion (0)
Sign in with ORCID, Apple, or X to comment. Anyone can read and Pith papers without signing in.