REVIEW 4 major objections 5 minor 50 references
Exploring Micro Accidents and Driver Responses in Automated Driving: Insights from Real-world Videos
T0 review · 4 major / 5 minor · reviewed 2026-08-05 · deepseek-v4-flash
Pith's one-line read This paper claims that micro accidents—abnormal but non-fatal driving events such as sharp braking, unstable lane keeping, and wrong-route lane changes—are a distinct class of automated-driving incidents that precede more severe crashes, an
desk verdict A useful micro-accident taxonomy and a real perception-gap finding, but the Level 3 framing is broken and needs re-scoping or rejection. read the letter →
The pith
A machine-rendered reading of the paper's core claim, the machinery that carries it, and where it could break.
The reading
What carries the argument
The analytical core is the four-way micro-accident taxonomy used as the dependent variable; an XGBoost classifier with SHAP explainability, which ranks which environmental and agent variables push each accident type; and a 0.4-second truncation of videos used as a perception probe, timed to the UN ALKS standard for perception-plus-judgment time. The taxonomy gives the outcome classes, SHAP gives the variable ranking, and the truncation operationalizes "recognizing risk before it happens."
What would settle it
Audit the 277 videos by decoding the vehicle model and its automation level from the central control screen; if a majority are SAE Level 2 systems, the Level 3 framing collapses. A second falsifier: rerun the crowdsourcing with pre-accident windows of 0.2, 0.4, 1, and 2 seconds; if detection at 0.4 seconds is much higher than one-third, the headline finding is an artifact of the truncation length.
Extended reading notes
Core claim
The central claim is that micro accidents in Level 3 automated driving can be characterized by four categories—unstable lane keeping, risky lane changes, emergent braking/obstacle handling, and traffic-rule violations—and that their occurrence is driven by a compact set of observable variables, above all the vehicle's action context, road type, and computer-vision errors. The paper further claims that human monitors are poor at foreseeing them: in crowdsourced evaluations of clips truncated 0.4 s before the event, fewer than one-third of participants predicted any emergency, and riskiness ratings tracked perceived danger more than probability. The authors take this as evidence that driver-ag
Load-bearing premise
The results stand on the assumption that the collected videos actually show SAE Level 3 automation, verified only by checking the brand of the vehicle; if the systems are Level 2 driver-assistance, the paper's claims about Level 3 automated driving do not follow.
Editorial extensions
If this is right
- Warning design should convey the probability of an event, not only its severity, because participants' risk estimates are dominated by dangerousness rather than likelihood.
- Rural roads and complex intersections should be flagged as high-risk zones where computer-vision errors and lane-change failures concentrate.
- Because drivers rely on the system's own often-silent assessment, agents that are struggling should actively signal uncertainty instead of waiting for post-event reminders.
- The 0.4-second window implies that takeover requests timed near this threshold may be too late for a meaningful fraction of drivers.
Reading between the lines
- A direct way to test the perception claim beyond the video medium is to run the same pre-accident clips in a driving simulator with eye tracking and a forced takeover response; if detection rates rise sharply when the scene is more immersive, the "two-thirds miss" rate may overstate real-world failure.
- If the Level 3 verification is unreliable, the dataset may actually be mostly Level 2 driver-assist; the perception findings would then apply to assisted driving rather than conditional autonomy, changing the design implications.
- The 0.4-second cutoff is conservative in one direction—it gives viewers only the minimal perception-plus-judgment window—so the measured miss rate is an upper bound on how quickly drivers can react; varying the cutoff would map the time course of risk recognition.
Signed reviews
Editorial analysis
A structured set of objections, weighed in public.
Referee Report
Summary. The paper introduces the notion of 'micro accidents'—non-fatal abnormal driving events such as abrupt deceleration, unstable lane keeping, and wrong lane changes—and studies them in supposedly SAE Level 3 automated driving. The authors collected 277 user-uploaded first-person videos, annotated environmental and agent-related variables, trained an XGBoost classifier to distinguish four micro-accident types, and used SHAP to rank feature contributions. They then ran an Amazon Mechanical Turk study in which participants viewed 40 of the videos, either ending 0.4 s before the micro accident or including the full event, and rated risk, probability, dangerousness, and responsibility. The main reported findings are that rural roads and complex intersections are particularly challenging, that computer-vision errors are associated with obstacle-related events, and that roughly two-thirds of participants did not anticipate an emergent event from the pre-accident clips. The paper concludes with design implications for warning strategies and driver knowledge support.
Significance. If the claims were well supported, the paper would address a genuinely understudied phenomenon—the 'subhealth' state between normal driving and severe crashes—and would provide a useful corpus of naturalistic abnormal driving events. The methodological triangulation of video annotation, tree-based ML with SHAP, and a perception experiment is a reasonable way to combine descriptive and subjective data. The authors also give useful transparency about search procedures, annotation kappa, hyperparameters, and acknowledged upload-bias limitations. However, the significance is conditional on three load-bearing assumptions: that the videos actually depict SAE Level 3 operation, that the ML features are causally or temporally interpretable, and that the crowdsourcing responses measure the actual drivers' risk recognition. All three are currently problematic, and the first and third are central to the paper's title, highlights, and design recommendations.
major comments (4)
- [§3.2] The inclusion criterion for 'confirm the SAE level 3 of automated driving' is said to be 'verified through checking the brand of vehicles.' This is not a valid verification of automation level. Under SAE J3016, Level 3 requires the ADS to perform the entire DDT within its ODD, with the driver as a fallback who need not monitor continuously; the paper's own gloss—'the automated system drives and the driver only monitors'—matches Level 2, not Level 3. The Introduction and Abstract cite Tesla, Xiaopeng, and Uber as Level 3 examples, yet Tesla's Autopilot/FSD and Uber's test vehicles are Level 2 or research prototypes, not certified Level 3. If the 277 videos are predominantly Level 2, then the title, abstract, contributions, and §5.4 warning-design recommendations all reference a system class unsupported by the data. The authors should provide a table of included vehicle models, system vers
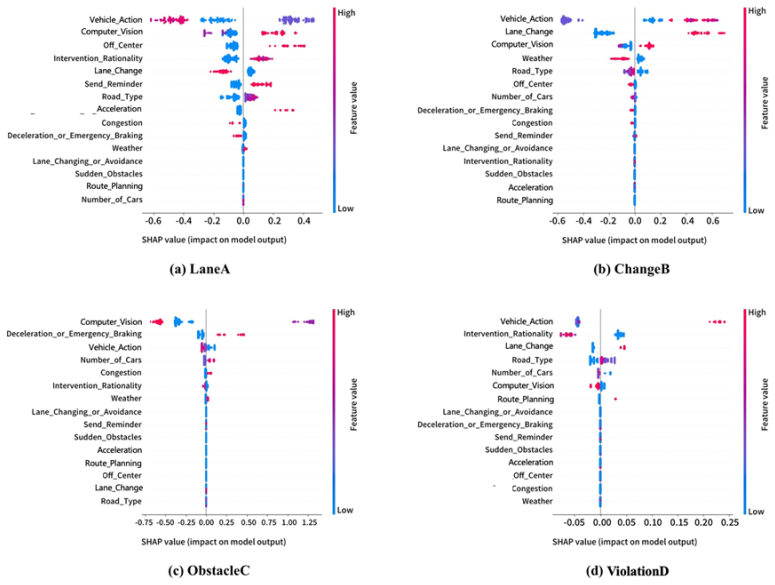
- [§3.3.1, Table 3] The XGBoost model achieves Macro-F1 = 56.10% on 277 samples with class proportions 30.7%/42.6%/19.9%/6.9%. This is modest, and the paper does not report per-class precision/recall or a confusion matrix; the smallest class (ViolationD, n=19) is likely very poorly recovered. More importantly, the model is described as predicting micro accidents, but the feature set in Table 2 includes temporally concurrent or post-event variables such as 'Intervention Rationality', 'Deceleration or Emergency Braking', and 'Lane Changing or Avoidance'. The model therefore classifies an already-annotated accident type from contemporaneous/outcome labels, not from pre-event information. Contribution 1's phrase 'prediction' is not supported. The SHAP analysis in §4.1 should be presented as descriptive of annotation correlations, not as locating variables that 'invoke' micro accidents, unless the feature set is
- [§3.4, §4.2.4, Highlights] Highlight 1 states that 'Two-thirds of drivers failed to recognize risky situations before micro accidents occurred.' The experiment did not measure drivers in the original videos: participants were MTurk workers who watched short clips and were explicitly told that the scenario was Level 3 automated driving. The result that 61/189 = 32% of pre-accident surveys judged an emergent event as possible is a statement about crowd observers under a particular instruction, not about the situation awareness of the actual drivers. The video-editing manipulation (deleting 0.4 s before the event) and the participants' prior knowledge that a micro accident is likely may also inflate or deflate anticipation in ways unrelated to real driving. This overgeneralization is load-bearing because contribution 2 is explicitly about 'drivers' perception around micro accidents.' The authors should either reframe
- [§3.2, Table 2] Several annotation variables encode information that is not available at the decision point. For example, 'Vehicle action' includes 'Will meet an intersection', 'Will enter a curve', and 'Encounter complex intersections', and the intervention variables are outcomes of the micro accident. Using these as SHAP predictors conflates causes with consequences and explains why 'Vehicle action' dominates the SHAP plots in Figure 1. The causal language in Table 4 ('Variables that Might Invoke Micro Accidents') is therefore misleading. The authors should annotate features strictly from the pre-event window if they want to support causal or predictive claims, or consistently use associational language.
minor comments (5)
- [Abstract, §1] The claim that 'automated driving in level 3 autonomy has been adopted by multiple companies such as Tesla and BMW' is inaccurate for Tesla and under-supported for others; please use system-specific terminology and cite certified Level 3 systems only.
- [Table 3] The Decision Tree Macro-F1 entry is printed as '51.59&'—likely a typo for %. Also, the table reports only aggregate metrics; per-class values would help assess the imbalanced-class problem.
- [§3.4] The justification for the 0.4 s deletion as 'perception time plus judgment time' is a strong assumption. The UN ALKS regulation's 0.4 s figure refers to a minimum risk-maneuver response specification, not to a general human risk-perception threshold. Please either cite a direct source for the perception/judgment decomposition or soften the claim.
- [§4.2.4] The sentence '61 out of 189 surveys thought there would be micro accidents' should clarify that this is an open-ended identification task and that the unit is surveys, not unique participants; the number of unique MTurk participants is not reported, making it impossible to assess within-participant dependencies.
- [§4.1.1] Typo: 'Vehicluar density' should be 'Vehicular density.'
Circularity Check
Partial circularity: SHAP 'key variables' include features that are definitionally the same as the micro-accident classes; the headline perception finding is independent.
-
self definitional
[Table 2 (Dependent Variable and Intervention Action); Section 4.1.2, Figure 1c]
"Micro Accident (0,1,2,3) LaneA = 0; ChangeB = 1; ObstacleC = 2; ViolationD = 3; ... ObstacleC - emergent braking. For example, the system failed to recognize an obstacle, leading to a near collision sharp braking. ... Deceleration or Emergency Braking (0,1) None = 0; Slow down or brake sharply = 1. ... In Obstacle C scenarios, the autonomous agents decelerated or braked (variable Deceleration or Emergency Braking in Figure 1c)."
The outcome class ObstacleC is defined as 'emergent braking' / 'sharp braking,' and the predictor set includes the feature 'Deceleration or Emergency Braking' coded as 'Slow down or brake sharply.' Section 4.1.2 then reports this feature as a key correlate of ObstacleC. The XGBoost/SHAP pipeline is therefore recovering the annotation scheme itself: a clip labeled ObstacleC almost by definition has the 'deceleration or braking' feature. Its high SHAP importance is by construction, not an empirical discovery about environments or autonomous agents.
-
self definitional
[Table 2 (Dependent Variable, Errors, and Vehicle Action); Section 4.1.2]
"ChangeB - risky multi-lane action. For example, wrong lane changes or incorrect route selection at forks. ... Lane Change (0,1) None = 0; Failure to change lane or turn when it could = 1. ... Lane Changing or Avoidance (0,1) None = 0; Lane change or avoidance = 1. ... Vehicle action ... Change lanes = 4."
The ChangeB class is defined by 'wrong lane changes,' and the predictor set includes 'Failure to change lane or turn when it could,' 'Lane changing or avoidance,' and a 'Vehicle action' value 'Change lanes.' SHAP analyses that rank lane-change/routing variables as important for explaining ChangeB are partly explaining the coding scheme rather than independent causation. These predictors are not independent of the label; they re-describe the behavior that defined the category.
full rationale
This paper is primarily an empirical, descriptive study and the headline human-perception claim comes from a separate crowdsourcing experiment (Section 4.2.4: '61 out of 189 surveys thought there would be micro accidents, less than one-third'), so the two-thirds failure-to-recognize result is independent of the ML/SHAP loop. No load-bearing self-citations appear. However, the SHAP variable-importance contribution is partially circular: the annotation taxonomy defines micro-accident classes in terms of behaviors that also appear as predictor features (ObstacleC = 'emergent braking' vs. the feature 'Deceleration or Emergency Braking'; ChangeB = 'wrong lane changes' vs. 'Lane Change' / 'Lane Changing or Avoidance'). The model thus recovers the coders' definitions, and the reported importance of intervention/lane variables is partly built into the labels. The SAE Level 3 screening by vehicle brand is a data-validity concern, not a circularity. Overall, the circularity is partial and localized to one contribution rather than the entire derivation, hence score 6.
Assumptions & free parameters
free parameters (2)
- XGBoost hyperparameters =
learning_rate=0.07, n_estimators=30, max_depth=4, min_child_weight=4, gamma=0.2, subsample=0.7, colsample_bytree=0.8, re
- Search page threshold =
10 pages initial, then 5 more if relevant
assumptions (6)
- domain assumption Videos are from SAE Level 3 systems, verified by checking vehicle brand.
- domain assumption User-generated online videos represent naturalistic micro accidents.
- domain assumption Crowdsourced participants' risk perceptions approximate those of actual drivers.
- domain assumption 0.4 seconds is enough for a driver to perceive and judge risk.
- domain assumption Annotated variables can be reliably recognized from video and central control screen.
- standard math XGBoost and SHAP provide valid inference for this small, imbalanced dataset.
Cite this review
Pith. "Pith review of Exploring Micro Accidents and Driver Responses in Automated Driving: Insights from Real-world Videos." pith.science (2026). https://pith.science/paper/UAESJIK4
@misc{pith2026250807256,
  author       = {Pith},
  title        = {Pith review of: Exploring Micro Accidents and Driver Responses in Automated Driving: Insights from Real-world Videos},
  year         = {2026},
  howpublished = {\url{https://pith.science/paper/UAESJIK4}},
  note         = {Machine review of arXiv:2508.07256}
}
read the original abstract
Automated driving in level 3 autonomy has been adopted by multiple companies such as Tesla and BMW, alleviating the burden on drivers while unveiling new complexities. This article focused on the under-explored territory of micro accidents during automated driving, characterized as not fatal but abnormal aberrations such as abrupt deceleration and snake driving. These micro accidents are basic yet pervasive events that might results in more severe accidents. Through collecting a comprehensive dataset of user generated video recording such micro accidents in natural driving scenarios, this article locates key variables pertaining to environments and autonomous agents using machine learning methods. Subsequently, crowdsourcing method provides insights into human risk perceptions and reactions to these micro accidents. This article thus describes features of safety critical scenarios other than crashes and fatal accidents, informing and potentially advancing the design of automated driving systems.
Figures


Figures from the paper (2 more)


Reference graph
Works this paper leans on
-
[1]
URL: https://www.sae.org/blog/sae-j3016-update
SAE International, Taxonomy and Definitions for Terms Re- lated to Driving Automation Systems for On-Road Motor Vehicles, Technical Report, SAE International, 2021. URL: https://www.sae.org/blog/sae-j3016-update
work page 2021
-
[2]
M. Chu, K. Zong, X. Shu, J. Gong, Z. Lu, K. Guo, X. Dai, G. Zhou, Work with AI and Work for AI: Autonomous Vehicle Safety Drivers’ Lived Experiences, 2023, pp. 1–16
work page 2023
- [3]
- [4]
-
[5]
M. Colley, S. Krauss, M. Lanzer, E. Rukzio, How Should Automated Vehicles Communicate Critical Situations? A Comparative Analysis of Visualization Concepts, Proc. ACM Interact. Mob. Wearable Ubiq- uitous Technol. 5 (2021). URL: https://doi.org/10.1145/3478111. doi:10.1145/3478111, publisher-place: New York, NY, USA publisher: Association for Computing Machinery
doi:10.1145/3478111 2021
-
[6]
A. Kim, J.-M. Park, U. Lee, Interruptibility for In-Vehicle Multitask- ing: Influence of Voice Task Demands and Adaptive Behaviors, Proc. ACM Interact. Mob. Wearable Ubiquitous Technol. 4 (2020). URL: https://doi.org/10.1145/3381009. doi:10.1145/3381009, publisher- place: New York, NY, USA publisher: Association for Computing Ma- chinery. 23
-
[7]
V. A. Banks, K. L. Plant, N. A. Stanton, Driver error or designer error: Using the Perceptual Cycle Model to explore the circumstances surrounding the fatal Tesla crash on 7th May 2016, Safety science 108 (2018) 278–285. Publisher: Elsevier
work page 2016
-
[8]
C. D. D. Cabrall, A. Eriksson, F. Dreger, R. Happee, J. de Win- ter, How to keep drivers engaged while supervising driving au- tomation? A literature survey and categorisation of six solution ar- eas, Theoretical Issues in Ergonomics Science 20 (2019) 332–365. doi:10.1080/1463922X.2018.1528484
Show all 50 references
-
[9]
H. H. van Huysduynen, J. Terken, B. Eggen, Why Dis- able the Autopilot?, in: Proceedings of the 10th Interna- tional Conference on Automotive User Interfaces and Interactive Vehicular Applications, ACM, Toronto ON Canada, 2018, pp. 247–257. URL: https://dl.acm.org/doi/10.1145/...
2018
-
[10]
V. A. Banks, A. Eriksson, J. O’Donoghue, N. A. Stanton, Is partially automated driving a bad idea? Observations from an on-road study, Ap- plied Ergonomics 68 (2018) 138–145. doi:10.1016/j.apergo.2017.11.010
2018 doi
-
[11]
P. Liu, Y. Du, Blame Attribution Asymmetry in Human–Automation Cooperation, Risk Analysis (2021) risa.13674. doi:10.1111/risa.13674
2021 doi
-
[12]
C. P. Janssen, S. T. Iqbal, A. L. Kun, S. F. Donker, Interrupted by my car? Implications of interruption and interleaving research for auto- mated vehicles, International Journal of Human-Computer Studies 130 (2019) 221–233. Publisher: Elsevier
2019
-
[13]
S. E. Merriman, K. L. Plant, K. M. Revell, N. A. Stanton, Challenges for automated vehicle driver training: A thematic analysis from manual and automated driving, Transportation Research Part F: Traffic Psychology and Behaviour 76 (2021) 238–268. doi:10.1016/j.trf.2020.10.011
2021 doi
-
[14]
Grahn, T
H. Grahn, T. Kujala, Impacts of touch screen size, user interface design, and subtask boundaries on in-car task’s visual demand and driver dis- traction, International Journal of Human-Computer Studies 142 (2020) 102467. Publisher: Elsevier. 24
2020
-
[15]
Hafizi, J
A. Hafizi, J. Henderson, A. Neshati, W. Zhou, E. Lank, D. Vogel, In- vehicle Performance and Distraction for Midair and Touch Directional Gestures, 2023, pp. 1–13
2023
-
[16]
Chen, H.-Y
K.-T. Chen, H.-Y. W. Chen, Manipulating music to communicate au- tomation reliability in conditionally automated driving: A driving sim- ulator study, International Journal of Human-Computer Studies 145 (2021) 102518. Publisher: Elsevier
2021
-
[17]
Kolekar, J
S. Kolekar, J. de Winter, D. Abbink, Human-like driving behaviour emerges from a risk-based driver model, Nature Communications 11 (2020) 4850. doi:10.1038/s41467-020-18353-4
2020 doi
-
[18]
Y. Ba, W. Zhang, A. H. Chan, T. Zhang, A. S. Cheng, How drivers fail to avoid crashes: A risk-homeostasis/perception-response (RH/PR) framework evidenced by visual perception, electrodermal activity and behavioral responses, Transportation Research Part F: Traffic Psychol- ogy...
2016 doi
-
[19]
N. A. Stanton, P. M. Salmon, G. H. Walker, M. Stanton, Models and methods for collision analysis: A comparison study based on the Uber collision with a pedestrian, Safety Science 120 (2019) 117–128. doi:10.1016/j.ssci.2019.06.008
2019 doi
-
[20]
R. Lin, N. Liu, L. Ma, T. Zhang, W. Zhang, Exploring the self-regulation of secondary task engagement in the context of partially automated driv- ing: A pilot study, Transportation Research Part F: Traffic Psychology and Behaviour 64 (2019) 147–160. doi:10.1016/j.trf.2019.05.005
2019 doi
-
[21]
J. R. Clark, N. A. Stanton, K. M. Revell, Conditionally and highly automated vehicle handover: A study exploring vocal communication between two drivers, Transportation Research Part F: Traffic Psychol- ogy and Behaviour 65 (2019) 699–715. doi:10.1016/j.trf.2018.06.008
2019 doi
-
[22]
Y. S. Cohen, E. Shmueli, Money Drives: Can Monetary Incentives Based on Real-Time Monitoring Improve Driving Behavior?, Proc. ACM Interact. Mob. Wearable Ubiquitous Technol. 1 (2018). URL: https://doi.org/10.1145/3161417. doi:10.1145/3161417, publisher- place: New York, NY, US...
2018 doi
-
[23]
Maurer, L
S. Maurer, L. Scatturin, E. Rukzio, Playing guardian angel: us- ing a gamified approach to overcome the overconfidence bias in driving, in: Proceedings of the 18th International Conference on Mobile and Ubiquitous Multimedia, ACM, Pisa Italy, 2019, pp. 1–12. URL: https://dl.ac...
2019
-
[24]
de Winter, N
J. de Winter, N. Stanton, Y. B. Eisma, Is the take-over paradigm a mere convenience?, Transportation Research Interdisciplinary Perspectives 10 (2021) 100370. doi:10.1016/j.trip.2021.100370
2021
-
[25]
Tr¨ osterer, A
S. Tr¨ osterer, A. Meschtscherjakov, A. G. Mirnig, A. Lupp, M. G¨ artner, F. McGee, R. McCall, M. Tscheligi, T. Engel, What We Can Learn from Pilots for Handovers and (De)Skilling in Semi-Autonomous Driving: An Interview Study, in: Proceedings of the 9th In- ternational Confer...
2017
-
[26]
Fridman, D
L. Fridman, D. E. Brown, M. Glazer, W. Angell, S. Dodd, B. Jenik, J. Terwilliger, A. Patsekin, J. Kindelsberger, L. Ding, S. Seaman, A. Mehler, A. Sipperley, A. Pettinato, B. D. Seppelt, L. Angell, B. Mehler, B. Reimer, Mit Advanced Vehicle Technology Study: Large-Scale Natura...
2019
-
[27]
Al-Taie, Y
A. Al-Taie, Y. Abdrabou, S. A. Macdonald, F. Pollick, S. A. Brewster, Keep it Real: Investigating Driver-Cyclist Interaction in Real-World Traffic, 2023, pp. 1–15
2023
-
[28]
L. Ding, M. Glazer, M. Wang, B. Mehler, B. Reimer, L. Fridman, Mit- A VT Clustered Driving Scene Dataset: Evaluating Perception Systems in Real-World Naturalistic Driving Scenarios, in: 2020 IEEE Intelli- gent Vehicles Symposium (IV), IEEE, Las Vegas, NV, USA, 2020, pp. 232–23...
2020
-
[29]
Morando, P
A. Morando, P. Gershon, B. Mehler, B. Reimer, Driver-initiated Tesla Autopilot Disengagements in Naturalistic Driving, in: 12th International Conference on Automotive User Interfaces and Interac- tive Vehicular Applications, ACM, Virtual Event DC USA, 2020, pp. 57–65. URL: htt...
2020
-
[30]
K. Koch, V. Mishra, S. Liu, T. Berger, E. Fleisch, D. Kotz, F. Wortmann, When Do Drivers Interact with In-Vehicle Well- Being Interventions? An Exploratory Analysis of a Longitudinal Study on Public Roads, Proc. ACM Interact. Mob. Wearable Ubiq- uitous Technol. 5 (2021). URL: ...
2021 doi
-
[31]
S. E. Merriman, K. L. Plant, K. M. Revell, N. A. Stanton, What can we learn from Automated Vehicle collisions? A deductive thematic analysis of five Automated Vehicle collisions, Safety Science 141 (2021) 105320. doi:10.1016/j.ssci.2021.105320
2021
-
[32]
Brown, M
B. Brown, M. Broth, E. Vinkhuyzen, The Halting problem: Video analysis of self-driving cars in traffic, 2023, pp. 1–14
2023
-
[33]
D. Lord, F. Mannering, The statistical analysis of crash-frequency data: A review and assessment of methodological alternatives, Trans- portation Research Part A: Policy and Practice 44 (2010) 291–305. doi:10.1016/j.tra.2010.02.001
2010 doi
-
[34]
N. Dong, H. Huang, L. Zheng, Support vector machine in crash pre- diction at the level of traffic analysis zones: Assessing the spatial proximity effects, Accident Analysis & Prevention 82 (2015) 192–198. doi:10.1016/j.aap.2015.05.018
2015 doi
-
[35]
A. B. Parsa, H. Taghipour, S. Derrible, A. K. Mohammadian, Real-time accident detection: Coping with imbalanced data, Accident Analysis & Prevention 129 (2019) 202–210. doi:10.1016/j.aap.2019.05.014
2019 doi
-
[36]
Ozbayoglu, G
M. Ozbayoglu, G. Kucukayan, E. Dogdu, A real-time autonomous highway accident detection model based on big data processing and computational intelligence, in: 2016 IEEE International Conference 27 on Big Data (Big Data), IEEE, Washington DC,USA, 2016, pp. 1807–1813. URL: http:...
2016
-
[37]
A. B. Parsa, R. S. Chauhan, H. Taghipour, S. Derrible, Applying Deep Learning to Detect Traffic Accidents in Real Time Using Spatiotemporal Sequential Data, arXiv preprint arXiv:1912.06991 (2019)
1912 arXiv
-
[38]
F. Zhou, X. J. Yang, J. C. F. de Winter, Using Eye-Tracking Data to Predict Situation Awareness in Real Time During Takeover Transitions in Conditionally Automated Driving, IEEE Transac- tions on Intelligent Transportation Systems 23 (2022) 2284–2295. doi:10.1109/TITS.2021.3069776
2022
-
[39]
Ayoub, X
J. Ayoub, X. J. Yang, F. Zhou, Modeling dispositional and initial learned trust in automated vehicles with predictability and explainability, Trans- portation Research Part F: Traffic Psychology and Behaviour 77 (2021) 102–116. doi:10.1016/j.trf.2020.12.015
2021 doi
-
[40]
Hu, M.-C
J. Hu, M.-C. Huang, X. Yu, Efficient mapping of crash risk at intersections with connected vehicle data and deep learning models, Accident Analysis & Prevention 144 (2020) 105665. doi:10.1016/j.aap.2020.105665
2020
-
[41]
X. Wen, Y. Xie, L. Wu, L. Jiang, Quantifying and comparing the ef- fects of key risk factors on various types of roadway segment crashes with LightGBM and SHAP, Accident Analysis & Prevention 159 (2021) 106261. doi:10.1016/j.aap.2021.106261
2021
-
[42]
A. B. Parsa, A. Movahedi, H. Taghipour, S. Derrible, A. K. Moham- madian, Toward safer highways, application of XGBoost and SHAP for real-time accident detection and feature analysis, Accident Analysis & Prevention 136 (2020) 105405. doi:10.1016/j.aap.2019.105405
2020
-
[43]
Brown, E
B. Brown, E. Laurier, The Trouble with Autopilots: As- sisted and Autonomous Driving on the Social Road, in: Pro- ceedings of the 2017 CHI Conference on Human Factors in Computing Systems, ACM, Denver Colorado USA, 2017, pp. 416–429. URL: https://dl.acm.org/doi/10.1145/3025453...
2017
-
[44]
K. A. Thomas, S. Clifford, Validity and Mechanical Turk: An assessment of exclusion methods and interactive experiments, Computers in Human Behavior 77 (2017) 184–197. doi:10.1016/j.chb.2017.08.038
2017 doi
-
[45]
M. C. Green, Transportation Into Narrative Worlds: The Role of Prior Knowledge and Perceived Realism, Discourse Processes 38 (2004) 247–
2004
-
[46]
Van Schagen, R
I. Van Schagen, R. Welsh, A. Backer-Grondahl, M. Hoedemaeker, T. Lotan, A. Morris, F. Sagberg, M. Winkelbauer, Towards a large- scale European Naturalistic Driving study: final report of PROLOGUE, SWOV Institute for Road Safety Research, Leidschendam, Netherlands (2011)
2011
-
[47]
T. Chen, C. Guestrin, Xgboost: A Scalable Tree Boosting System, in: Proceedings of the 22nd ACM SIGKDD Inter- national Conference on Knowledge Discovery and Data Min- ing, ACM, San Francisco California USA, 2016, pp. 785–794. URL: https://dl.acm.org/doi/10.1145/2939672.2939785...
2016
-
[48]
Klemelii, S
J. Klemelii, S. Klinke, H. Sofyan, Classification and Regression Trees, Springer Berlin, Heidelberg, 2000, pp. 281–304
2000
-
[49]
S. M. Lundberg, S.-I. Lee, A unified approach to interpreting model pre- dictions, Advances in neural information processing systems 30 (2017). 29
2017
-
[266]
doi:10.1207/s15326950dp3802 5, publisher: Routledge
Reviewed August 5, 2026 · model on record in the stance chip above.
Discussion (0). Continue with ORCID to comment.